Good News Lends Bulls A Hand
To say that we are experiencing unprecedented times on both Main and Wall Streets is likely the understatement of the century. Never before has the U.S. economy been intentionally shut down and then, for better or worse, quickly reopened a couple months later. Never before has the stock market fallen so far, so fast, only to recover in record time. Never before have we seen the type of intervention provided by governments and central bankers around the world. And never before have we seen the big stock market players get bigger - and then get bigger and bigger and...
Think about it; it wasn't that long ago when investors were astounded that a single company could reach a market cap of $1 Trillion. Speaking of a trillion dollars, it wasn't that long ago that the Fed's balance sheet was about half that amount. And it also wasn't that long ago when it looked like the U.S. economy was running out of workers to fill all the jobs needed.
So, with everything going on - you know, all the "never before" data and the "largest increase since" numbers - I guess we shouldn't be surprised by much these days. And yet, two pieces of economic data managed to surprise the heck out of everyone this week - in a good way.
Unless you make your living in the financial markets, you probably don't follow the ISM data. Why would you? After all, the Institute for Supply Management's survey of both manufacturing and services sector companies doesn't likely impact your daily life in any way.
But if you are wondering why the S&P 500 has been rising again this week and is now within a stone's throw of an all-time high, while the NASDAQ continues to march merrily higher (+22.6% YTD), the recent ISM data appears to provide some answers.
I know, I know... Reviewing economic data is usually best employed as an emergency sleep aid. But trust me, these numbers are worth a quick look-see.
ISM Manufacturing Surprises To The Upside
First up was the ISM Manufacturing Index, which looks at the health of, yep, you guessed it; companies in the U.S. manufacturing sector. In case you are new to the ISM data, it is important to note that readings below 50 indicate the sector is contracting (a bad thing), while reads above 50 indicate expansion (a good thing).
To be sure, no one was surprised to see this index plunge from a pre-COVID reading over 60 to around 42 a few months back as factories basically shut down so everyone could shelter in place. And it wasn't terribly surprising to see the index rebound when the economy began to reopen in May/June.
But July's read of 54.2 was clearly a surprise. First, this was above the consensus expectations. Next, the level was well over the 50-line. And third, 54.2 was the best level seen in 15 months, which included a fair amount of time before anybody had ever heard of COVID-19.
Yes, you can argue that there is likely a fair amount of catch-up and/or pent up demand seen in the recent readings. But the bottom line is 54 is a pretty healthy number.
ISM Services Was An Even Bigger Surprise
While the ISM Manufacturing Index was a pleasant surprise, the Non-Manufacturing (i.e. Services) Index was even better. The index came in at 58.1, which was above expectations for a decline to 55.0 and was the highest level seen since February 2019. Let that sink in because February 2019 was a full year before COVID hit.
What makes this number even more remarkable is the fact that this was a July reading. Lest we forget, this was when the virus surged out of control in the South and Western parts of the country, causing many cities/states to shut down services businesses such as restaurants, bars, movie theaters, gyms, etc.
Because of the spread of infection, the renewed fear of infection, the re-closing of services industries and all the talk about reinstating complete shutdowns, analysts didn't have high hopes for the July ISM Non-Manufacturing numbers. Thus, yesterday's positive surprise had an even stronger impact.
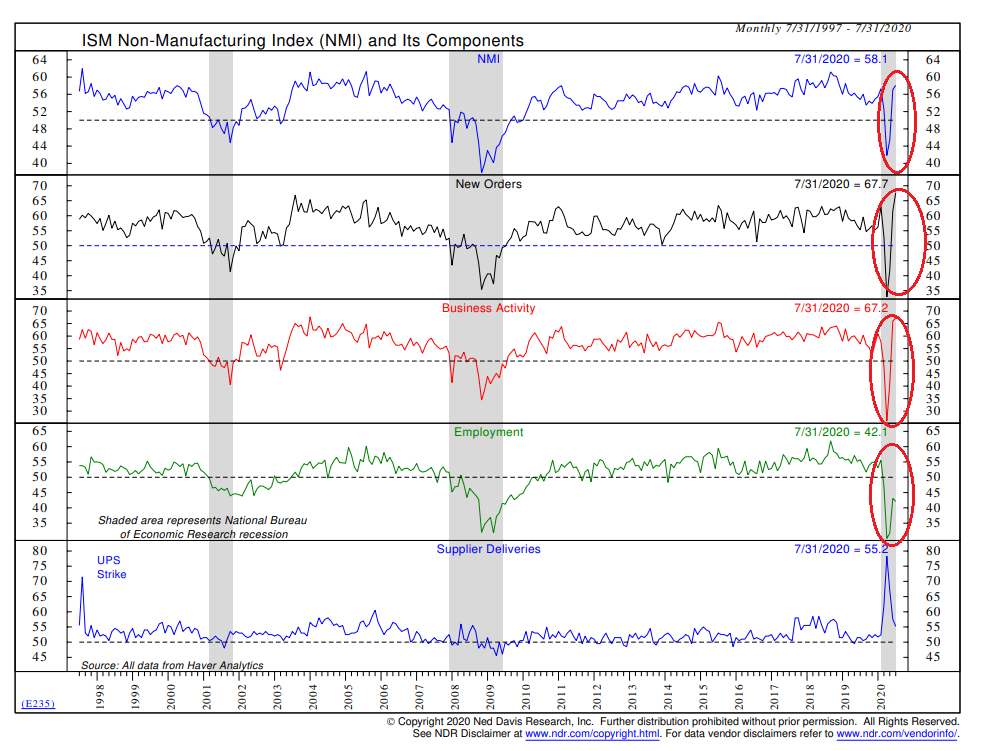
Digging into the report, we find a lot of good news and one not-so-hot item. Let's start with the good stuff. The chart below shows the Non-Manufacturing Index in the top clip, which shows that the level is now back above pre-crisis levels.
The next clip shows the New Orders component, which is even better and hit a new record high. Then there is the Business Activity component, which also looks pretty darn good.
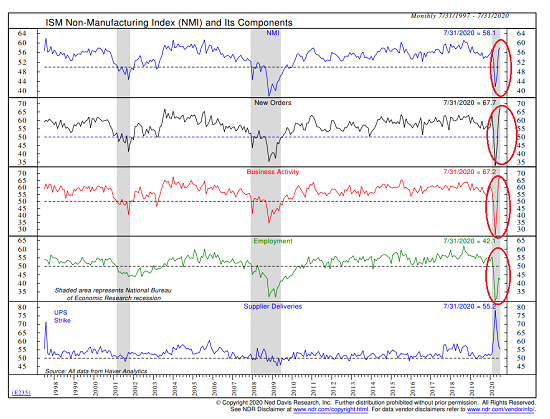
View Chart Online
Source: Ned Davis Research Group
But...
However, the green line in the fourth clip shows there to be a fly in the ointment. And unfortunately, this is a pretty big problem as the Employment component is still WELL below pre-COVID levels.
The concern here is that unemployment levels are still at exceptionally high levels. As such, one has to question the sustainability of the economic recovery - strong as it may appear at the present time - if tens of millions of unemployed folks stay that way.
The Bottom Line
We must always remember that stocks look forward and not back. So, with more good news on the economy, more stimulus money undoubtedly coming, continued upbeat news on the vaccine front, and a Fed that is ready to print money to infinity and beyond, stock market investors appear to be looking past the negatives and to better days ahead.
This does NOT mean that stocks will continue to move up in a straight line (although anybody looking for a dip to buy can't be blamed for feeling that way right about now). And we should keep in mind that the August/September period isn't exactly strong from an historical perspective - especially during election years. And that stocks are overbought. And overvalued.
So, from my seat, some sort of pause/pullback/corrective phase wouldn't be surprising at some point soon. But as long as the vaccine news continues to give people hope that "normal" might be a thing again in the not too distant future, I think we can stick with the bulls and keep buying those dips.
Thought For The Day:
"Ego is the enemy in Ms. Market's game!" -Yours Truly
Wishing you green screens and all the best for a great day,

David D. Moenning
Founder, Chief Investment Officer
Heritage Capital Research

Disclosures
At the time of publication, Mr. Moenning held long positions in the following securities mentioned: None - Note that positions may change at any time.
NOT INVESTMENT ADVICE. The opinions and forecasts expressed herein are those of Mr. David Moenning and Heritage Capital Research and may not actually come to pass. The opinions and viewpoints regarding the future of the markets should not be construed as recommendations. The analysis and information in this report is for informational purposes only. No part of the material presented in this report is intended as an investment recommendation or investment advice. Neither the information nor any opinion expressed constitutes a solicitation to purchase or sell securities or any investment program.
Any investment decisions must in all cases be made by the reader or by his or her investment adviser. Do NOT ever purchase any security without doing sufficient research. There is no guarantee that the investment objectives outlined will actually come to pass. All opinions expressed herein are subject to change without notice. Neither the editor, employees, nor any of their affiliates shall have any liability for any loss sustained by anyone who has relied on the information provided.
Mr. Moenning of Heritage Capital Research is an investment adviser representative of Eastsound Capital Advisors, LLC, a registered investment advisor. The adviser may not transact business in states where it is not appropriately registered, excluded or exempted from registration. Individualized responses to persons that involve either the effecting of transaction in securities, or the rendering of personalized investment advice for compensation, will not be made without registration or exemption.
Mr. Moenning and Heritage Capital Research may at times have positions in the securities referred to and may make purchases or sales of these securities while publications are in circulation. Positions may change at any time.
The analysis provided is based on both technical and fundamental research and is provided "as is" without warranty of any kind, either expressed or implied. Although the information contained is derived from sources which are believed to be reliable, they cannot be guaranteed.
The author neither endorses nor warrants the content of this site, any embedded advertisement, or any linked resource. The author or his managed funds may hold either long or short positions in the referenced securities. Republication rights must be expressly granted by author in writing.
Investments in equities carry an inherent element of risk including the potential for significant loss of principal. Past performance is not an indication of future results.