A Bull Market Until Proven Otherwise
Good Monday morning and welcome back to the land of blinking screens. Global growth, the Trump/Russia situation, oil, the upcoming Fed meeting, and the greenback are in focus to start the week.
On the growth front, the euro area Markit PMI fell to 55.8 in July, which is the weakest reading in six months. Next up, the IMF contends that the world will rely less on the United States to drive global growth in the coming years, cut its forecast for U.K. growth, and increased growth estimates for Japan and the euro area.
Next up, major oil producing countries are meeting in Russia and so far at least, there are no major changes/announcements relating to supply anticipated.
As for the Fed, Janet Yellen's merry band of bankers meets again this week. While just about everybody agrees that the Yellen & Co. won't take any action, the meeting, as usual, will be all about the post-meeting statement versus market expectations. Markets are looking for the Fed to officially embrace the stance Yellen took in her recent Congressional testimony.
Finally, since it's the start of a new week, let's get to our objective review the key market models and indicators and see where things stand. To review, the primary goal of this weekly exercise is to remove any subjective notions I might have in an effort to stay in line with what "is" happening in the markets.
The State of the Trend
We start each week with a look at the "state of the trend." These indicators are designed to give us a feel for the overall health of the current short- and intermediate-term trend models.
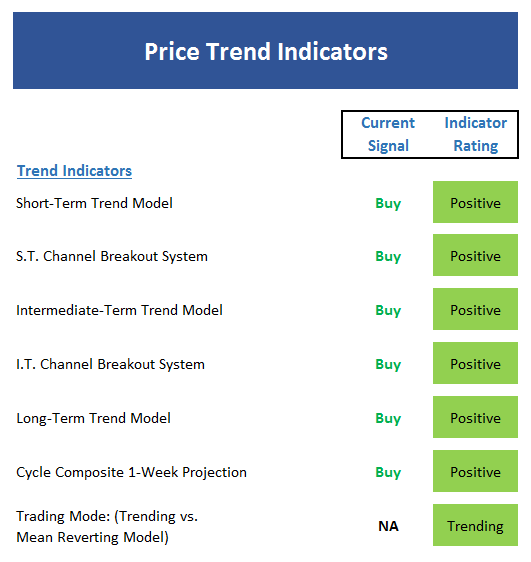
View Trend Indicator Board Online
Executive Summary:
- With the S&P one day removed from the latest all-time high, the short-term Trend Model remains positive.
- Both the short- and intermediate-term Channel Breakout Systems are on buy signals and sporting green lights.
- The intermediate-term Trend Model is also positive with the weekly chart of the S&P at all-time highs.
- The long-term Trend Model remains solidly green.
- The Cycle Composite points slightly higher for the next two weeks before entering a meaningful downtrend.
- The Trading Mode models suggest a "trending" environment has begun.
The State of Internal Momentum
Next up are the momentum indicators, which are designed to tell us whether there is any "oomph" behind the current trend...
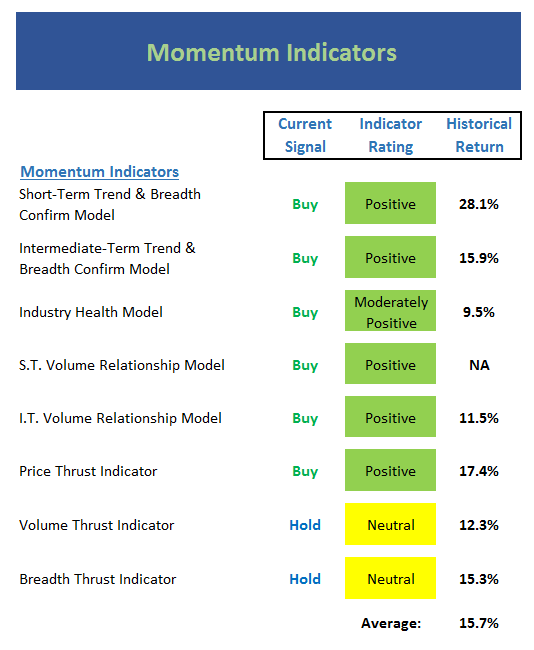
View Momentum Indicator Board Online
Executive Summary:
- Both the short- and intermediate-term Trend and Breadth Confirm models are positive
- The Industry Health Model is going nowhere fast with a reading slightly above neutral.
- The short-term Volume Relationship model is positive, but only by a slight margin. Note that while the upside volume line is above downside volume, upside volume is actually in a downtrend.
- The intermediate-term Volume Relationship remains in good shape. After flirting with a technical breakdown, upside volume is now trending higher again.
- The Price Thrust Indicator is green.
- The Volume Thrust Indicator remains neutral.
- The Breadth Thrust Indicator is also neutral again this week.
The State of the "Trade"
We also focus each week on the "early warning" board, which is designed to indicate when traders may start to "go the other way" -- for a trade.
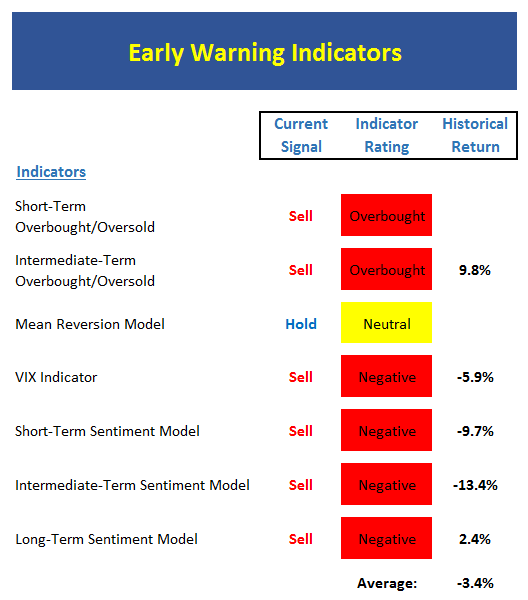
View Early Warning Indicator Board Online
Executive Summary:
- From a near-term perspective, stocks are once again overbought. However, this is not, in and of itself, a reason to sell.
- From an intermediate-term view, stocks are also overbought. The fact that both these models are overbought improves the odds for the bears.
- The Mean Reversion Model slipped to neutral last week.
- The VIX Indicators are negative across the board.
- From a short-term perspective, market sentiment is has turned overly complacent.
- The intermediate-term Sentiment Model continues to wave it's warning flag.
- Ditto for the longer-term Sentiment readings.
The State of the Macro Picture
Now let's move on to the market's "external factors" - the indicators designed to tell us the state of the big-picture market drivers including monetary conditions, the economy, inflation, and valuations.

View External Factors Indicator Board Online
Executive Summary:
- Absolute Monetary conditions remain neutral.
- On a relative basis, our Monetary Model continues to improve within the neutral zone.
- Our Economic Model (designed to call the stock market) has rediscovered its mojo and is in good shape here.
- The Inflation Model continues to fall within the neutral zone. But this is a clear indication that inflation pressures continue to ease.
- Our Relative Valuation Model remains neutral but is moving ever-so slightly back toward the "undervalued" zone.
- The Absolute Valuation Model continues to sing the same song - stocks are very overvalued relative to traditional valuation indicators.
The State of the Big-Picture Market Models
Finally, let's review our favorite big-picture market models, which are designed to tell us which team is in control of the prevailing major trend.
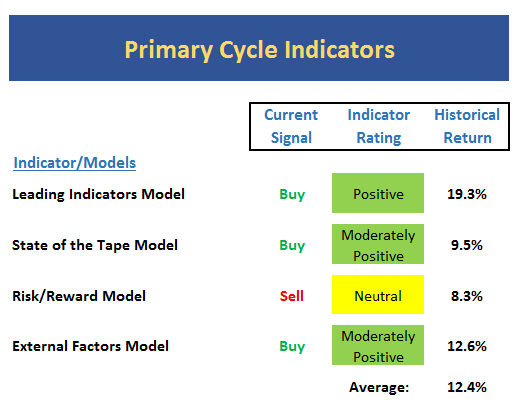
View My Favorite Market Models Online
Executive Summary:
- The Leading Indicators model, which was our best performing timing model during the last cycle, continues to sport a decent reading.
- The song remains the same with the tape as the indicators are moderately positive but not as robust as we'd like to see.
- The Risk/Reward model continues to suggest that some caution is warranted.
- The External Factors model continues to improve and is very close to moving into the outright positive zone. This is one of the better signs that I can find for the bull camp.
The Takeaway...
With the S&P and Dow making new highs last week, it is not surprising to see a lot of green on the indicator boards. And while there are some things to be concerned about - such as the projection of the cycle composite, the level of investor complacency, the overbought condition, and the lack of economic "oomph," the bottom line is this is a bull market until proven otherwise and our heroes in horns should be given the benefit of the doubt here. Experience has taught me that bull markets can last longer than almost anyone can imagine and go higher than most bears can withstand. So, as long as rates are low, the economy is growing, inflation is tame, and earnings are improving, stocks can be bought. My only caveats are to remember that typically stocks don't move in a straight line and that this is NOT a low-risk environment. So, while I'm happy to remain on the bull train, I will continue to keep an eye on where the nearest exits are located.
Thought For The Day:
Always do right. This will gratify some people and astonish the rest. - Mark Twain
Current Market Drivers
We strive to identify the driving forces behind the market action on a daily basis. The thinking is that if we can both identify and understand why stocks are doing what they are doing on a short-term basis; we are not likely to be surprised/blind-sided by a big move. Listed below are what we believe to be the driving forces of the current market (Listed in order of importance).
1. The State of the U.S. Economic Growth (Fast enough to justify valuations?)
2. The State of Earnings Growth
3. The State of Trump Administration Policies
4. The State of the Fed
Wishing you green screens and all the best for a great day,

David D. Moenning
Chief Investment Officer
Sowell Management Services
Disclosure: At the time of publication, Mr. Moenning and/or Sowell Management Services held long positions in the following securities mentioned: none. Note that positions may change at any time.
Looking for a "Modern" approach to Asset Allocation and Portfolio Design?
Looking for More on the State of the Markets?
Disclosures
The opinions and forecasts expressed herein are those of Mr. David Moenning and may not actually come to pass. Mr. Moenning's opinions and viewpoints regarding the future of the markets should not be construed as recommendations. The analysis and information in this report is for informational purposes only. No part of the material presented in this report is intended as an investment recommendation or investment advice. Neither the information nor any opinion expressed constitutes a solicitation to purchase or sell securities or any investment program.
Any investment decisions must in all cases be made by the reader or by his or her investment adviser. Do NOT ever purchase any security without doing sufficient research. There is no guarantee that the investment objectives outlined will actually come to pass. All opinions expressed herein are subject to change without notice. Neither the editor, employees, nor any of their affiliates shall have any liability for any loss sustained by anyone who has relied on the information provided.
The analysis provided is based on both technical and fundamental research and is provided "as is" without warranty of any kind, either expressed or implied. Although the information contained is derived from sources which are believed to be reliable, they cannot be guaranteed.
David D. Moenning is an investment adviser representative of Sowell Management Services, a registered investment advisor. For a complete description of investment risks, fees and services, review the firm brochure (ADV Part 2) which is available by contacting Sowell. Sowell is not registered as a broker-dealer.
Employees and affiliates of Sowell may at times have positions in the securities referred to and may make purchases or sales of these securities while publications are in circulation. Positions may change at any time.
Investments in equities carry an inherent element of risk including the potential for significant loss of principal. Past performance is not an indication of future results.
Advisory services are offered through Sowell Management Services.