Although The Action Has Gotten Sloppy...
Modern times demand modern thinking in portfolio design. Learn more...
Good morning. Let's start this first week of May with a review of the major market indicators and models.
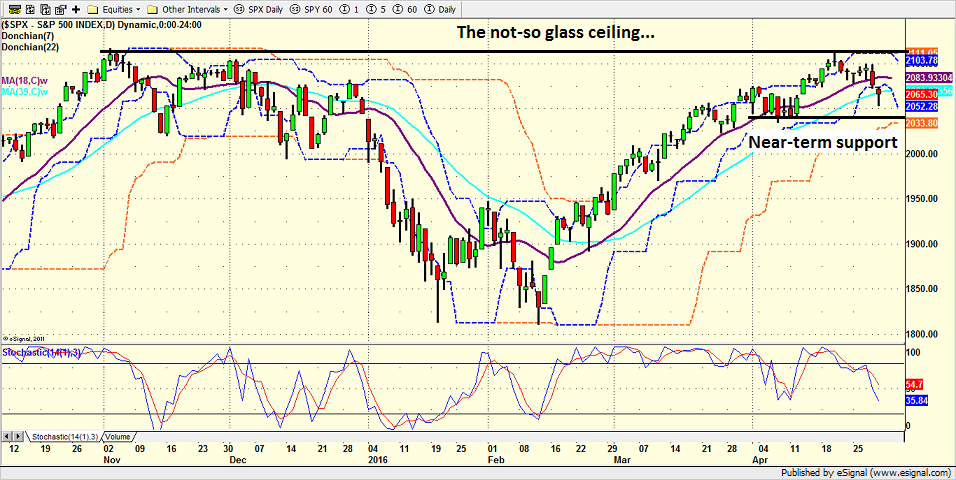
As usual, the first stop is a review of the price/trend of the market. From a shorter-term perspective, the calendar indicates that the "Sell in May and go away" season is upon us. And while the recent selling hasn't been very intense, Apple's "miss" may have served to remind traders that it is time to test an age-old Wall Street-ism.
Given the recent state of the "early warning" indicators, the current pullback should not be surprising to anyone. And cutting to the chase of this morning's report, unless short-term support is violated, the bulls should probably be given the benefit of any doubt.
Yet at the same time, we must recognize that the overhead resistance in the S&P 2100 area remains meaningful. As such, the back-and-forth game of tug of war would appear to remain firmly in place at this time.
S&P 500 - Daily 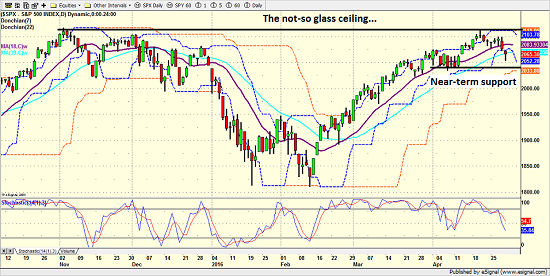
View Larger Image
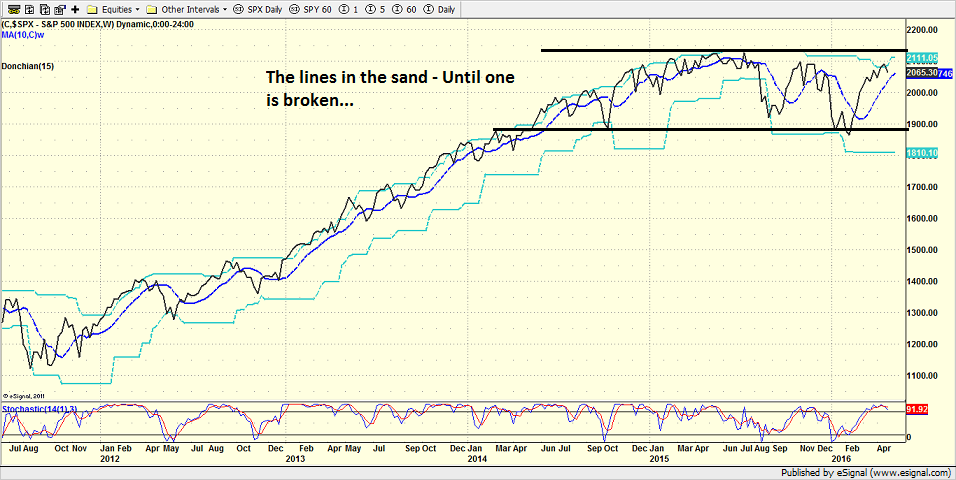
From a longer-term perspective (e.g. the weekly chart of the S&P 500), the song remains the same and stocks remain in a longer-term sideways consolidation pattern. Thus, until one of the key lines in the sand are broken, traders will likely continue to "ride the range" by selling the highs and buying the lows. But as I wrote last week, the good news is the textbooks tell us that stocks tend to exit a consolidation pattern heading in the direction they were going when the pattern began. Therefore, if we assume that stocks are entrenched in a secular bull market, we should expect to see a breakout to the upside.
The question, of course, is when this upside breakout will occur. From my seat, the key is to recognize that such a move is likely going to require a "trigger," such as an improvement in the economy or earnings. Or, of course, something we aren't seeing/thinking of at this time.
S&P 500 - Weekly 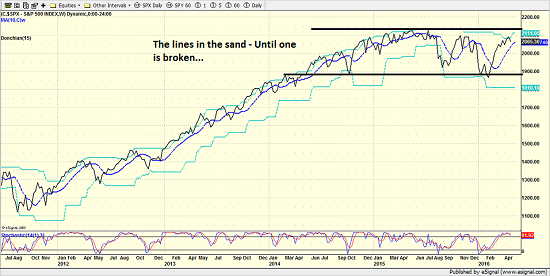
View Larger Image
Now it's time to cease with the subjective analysis of the price action and turn our attention to our objective panel of indicators...
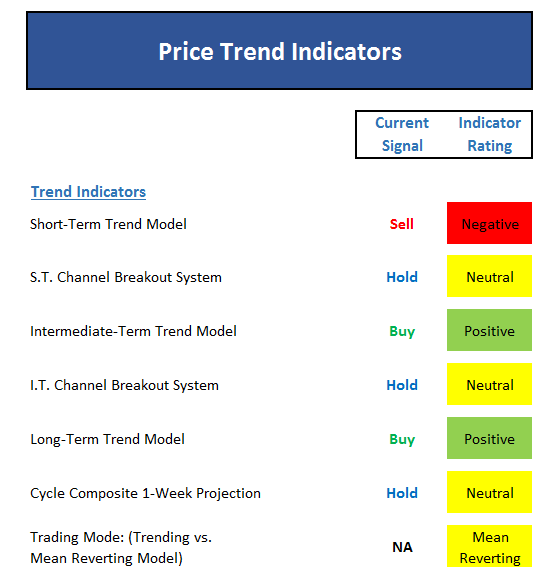
The first thing to note is that the price board is not nearly as positive as it was the past few weeks. While this is not a death knell for the bulls, it does confirm that things have indeed gotten a bit sloppy of late.
The good news is that while the shorter-term indicators have weakened a bit, the longer-term indicators are positive. As we talked about last week, the upwardly sloping 50-day moving average has now moved back above the 200-day, which to many technicians is a long-term sign of strength.
However, the cycle composite is not favorable for the next few weeks and our "trading environment" models continue to suggest that stocks are in a "mean reverting" mode at this time.
Next up is the momentum indicator board...
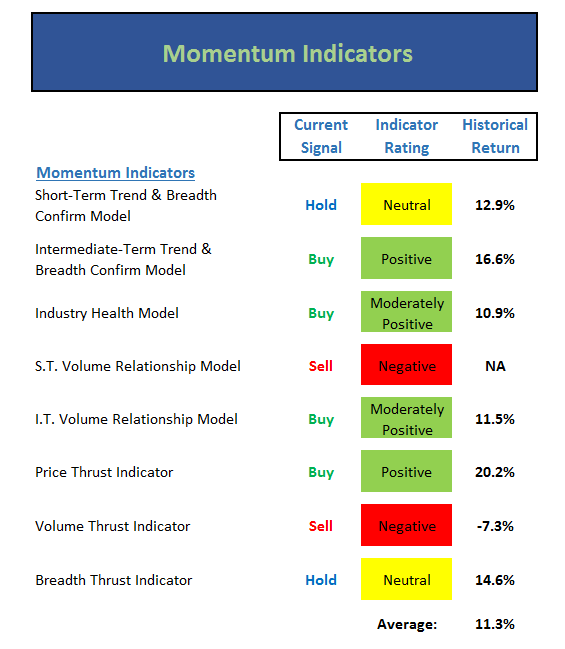
The big takeaway here is that although the shorter-term momentum indicators have softened, the longer-term models continue to be positive. From my perch, this board tells me that buyers are taking a break here.
But, I note that the average historical return of the S&P 500 when the momentum indicator panel is in its current state remains above the norm. So, again, unless the bears can find a solid reason to scare folks away from stocks, the longer-term "mo" seems to favor the bulls.
Next up is the "early warning" board, which is designed to indicate when traders may start to "go the other way" for a trade.
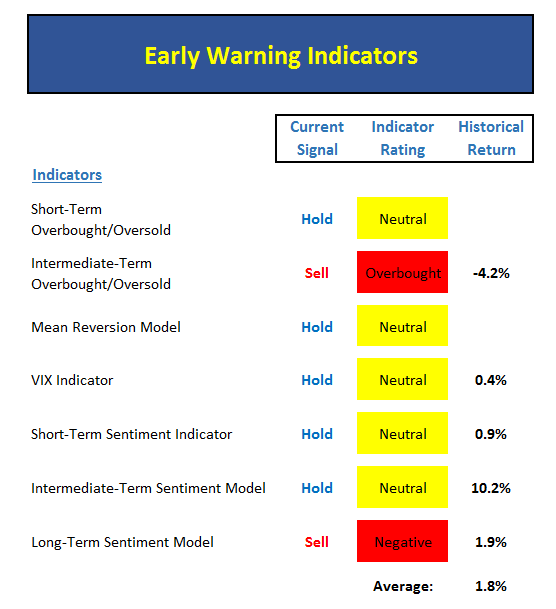
The message from this panel has clearly changed this week. Recall that for the past two weeks, we equated this board to a yellow flag being waved over the track, which suggested that a pullback could begin at any time.
However, with this panel having turned from mostly red to mostly yellow, we will now wait to see if the decline that the "table was set for" actually materializes. Remember, during strong uptrends, overbought conditions should be viewed as a sign of strength - and can persist for long periods of time. So, unless the bears can get something going to the downside in a hurry, stocks may not be able to reach an oversold condition.
Now let's move on to the market's "external factors" - the indicators designed to tell us the state of the big-picture market drivers including monetary conditions, the economy, inflation, and valuations.
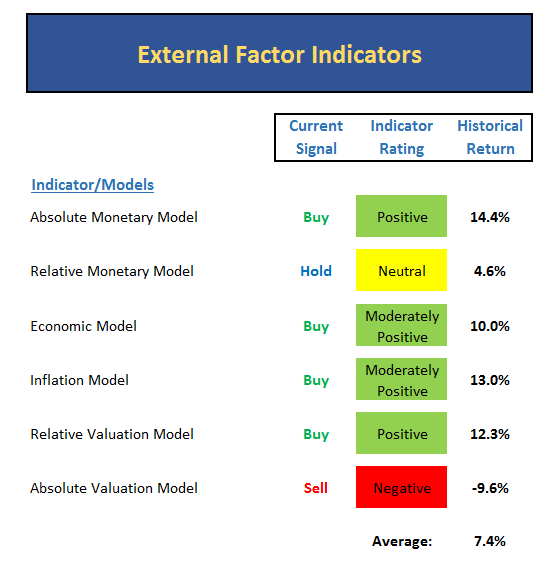
As a reminder, this board doesn't change very often at all. And once again, there is nothing new to report.
To review, monetary conditions remain favorable, our economic model is moderately positive, inflation isn't a problem, and valuations remain debatable. This tells us that the odds continue to favor the bulls from a big-picture standpoint.
Finally, let's turn to our favorite big-picture market models, which are designed to tell us which team is in control of the prevailing major trend.
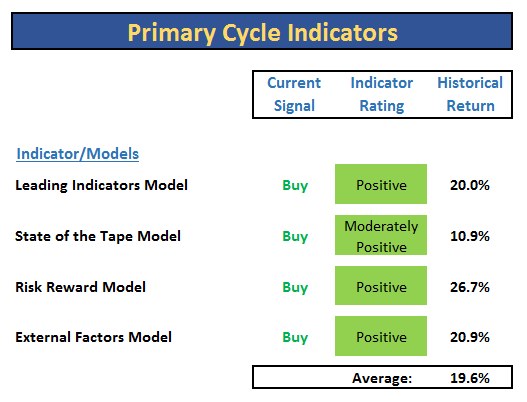
For some time now, I've been whining about the fact that the Risk/Reward Model has refused to move up into positive territory. The good news is that this model has also now turned positive.
However, I will note that the model flipped to green by the skinniest of margins and as such, I don't consider it to be a "strong" message at this time. And since the model has a tendency to flip-flop, I'd like to see a green light persist for a while before getting overly excited.
In addition, we should remember that these models are LOUSY "timing" indicators in the near-term. Usually, by the time there is enough "good stuff" happening to cause any of these long-term models to change colors, stocks are set up for a short-term reversal. Yet, from a 3-, 6-, and 12-month perspective, these indicators tend to do a good gob on getting the big picture right and we should recognize that all of the major models are now green.
The Takeaway...
To sum up, the "weight of the evidence" continues to suggest that investors should give the bulls the benefit of the doubt here and that the dips should be bought. And given the state of the calendar as well as Apple's recent struggles, it would be logical to assume that a dip worthy of purchase may be presented in the near futures.
Today's Pre-Game Indicators
Here are the Pre-Market indicators we review each morning before the opening bell...
Major Foreign Markets:
Japan: -3.11%
Hong Kong: -1.50%
Shanghai: -0.25%
London: -1.27%
Germany: +1.01%
France: +0.53%
Italy: -0.12%
Spain: -0.57%
Crude Oil Futures: -$0.05 to $45.87
Gold: +$9.80 at $1300.20
Dollar: lower against the yen, euro and pound
US 10-Year Bond Yield: Currently trading at 1.819%
German 10-Year Bund Yield: Currently trading at 0.249%
Stock Indices in U.S. (relative to fair value):
S&P 500: +4.75
Dow Jones Industrial Average: +36
NASDAQ Composite: +7.25
Thought For The Day:
In the right light, at the right time, everything is extraordinary. - Aaron Rose
Here's wishing you green screens and all the best for a great day,

David D. Moenning
Founder: Heritage Capital Research
Chief Investment Officer: Sowell Management Services
Looking for More on the State of the Markets?
Disclosures
The opinions and forecasts expressed herein are those of Mr. David Moenning and may not actually come to pass. Mr. Moenning's opinions and viewpoints regarding the future of the markets should not be construed as recommendations. The analysis and information in this report is for informational purposes only. No part of the material presented in this report is intended as an investment recommendation or investment advice. Neither the information nor any opinion expressed constitutes a solicitation to purchase or sell securities or any investment program.
Any investment decisions must in all cases be made by the reader or by his or her investment adviser. Do NOT ever purchase any security without doing sufficient research. There is no guarantee that the investment objectives outlined will actually come to pass. All opinions expressed herein are subject to change without notice. Neither the editor, employees, nor any of their affiliates shall have any liability for any loss sustained by anyone who has relied on the information provided.
The analysis provided is based on both technical and fundamental research and is provided "as is" without warranty of any kind, either expressed or implied. Although the information contained is derived from sources which are believed to be reliable, they cannot be guaranteed.
David D. Moenning is an investment adviser representative of Sowell Management Services, a registered investment advisor. For a complete description of investment risks, fees and services, review the firm brochure (ADV Part 2) which is available by contacting Sowell. Sowell is not registered as a broker-dealer.
Employees and affiliates of Sowell may at times have positions in the securities referred to and may make purchases or sales of these securities while publications are in circulation. Positions may change at any time.
Investments in equities carry an inherent element of risk including the potential for significant loss of principal. Past performance is not an indication of future results.
Advisory services are offered through Sowell Management Services.