BlackRock: "Win More by Losing Less"
When interviewing investment managers, one of the most important things to understand is the manager's and/or the firm's bias. Make no mistake about it; most all managers have a "view of the world" (aka how the markets work) that will impact their approach to managing money. Thus, it is critical to understand how a manager/firm is going to approach your portfolio.
For example, some managers believe in a passive approach to investing using indexes. This particular methodology has become quite popular these days. The reason is simple. The current bull market has become long in the tooth and market leadership has narrowed, making it more difficult for managers to outperform the indices.
Other managers believe in buying growth oriented companies at a reasonable price (GARP). Others focus on value. Still others believe that a big, bad bear market in bonds is underway and that alternatives is the way to go. And so on and so on.
As I "esplained" last week I am a risk manager. Always have been, always will be. In short, I believe that one of the best ways to outperform the market over the long run is to stay in tune with the risk/reward environment and attempt to lose the least amount possible during the severe downturns that tend to occur every so often in the stock market.
As I said last time, this hasn't always been a popular approach, which has been just fine by me. However, at our recent advisor conference in Denver, BlackRock shocked me with a presentation that focused on the idea of managing risk.
Granted, my approach to managing risk differs from that of BlackRock. But the fact that one of the world's largest money managers is pounding the table about the idea of managing risk in your portfolio was eye-opening to everyone in the room. And I wanted to share the firm's key points this morning.
BlackRock: Risk Factors are High
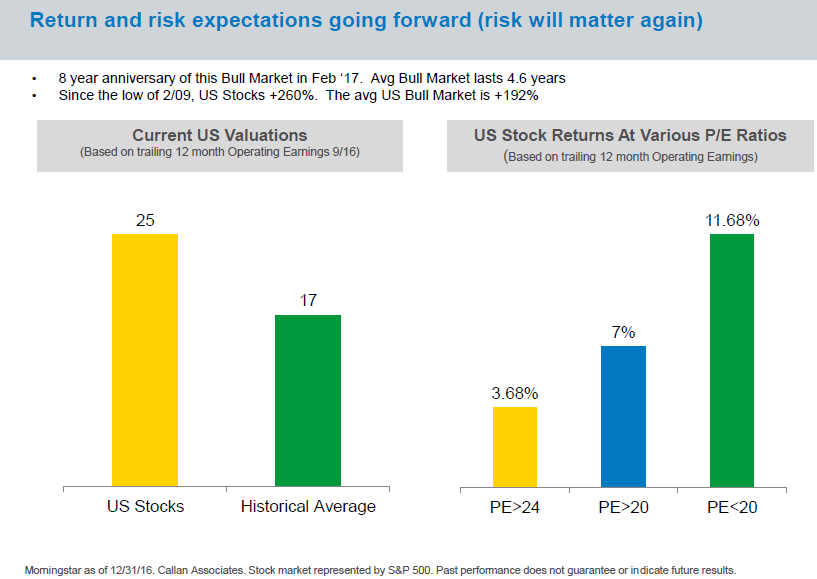
The presentation was given by Mark Peterson, the Director Investment Strategy and Education at BlackRock. Mark's first point got my attention immediately. He told advisors that valuations in the stock market are quite high by historical standards and that risk will matter again at some point in the future.
Mr. Peterson pointed to the following chart, which shows current valuations relative to the historical mean and how stocks have performed at various P/E levels in the past.
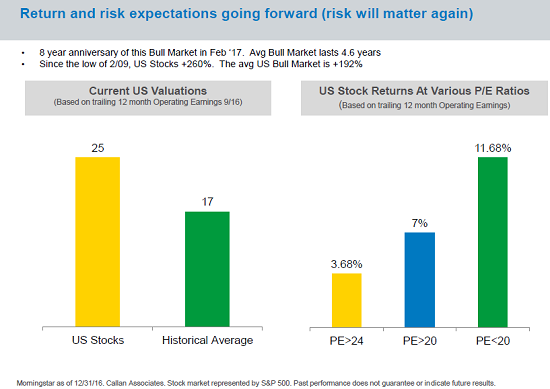
This chart makes it clear that (a) stocks are overvalued compared to the historical average and (b) the returns of the stock market when P/E's are as high as they are currently being well below average.
Diversified Stock Portfolios Have Become Higher Risk
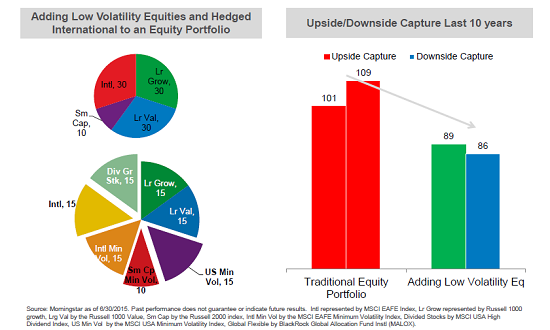
The next point Mr. Peterson made was that the traditional diversified stock portfolio (as defined by a portfolio consisting of 30% Large Cap Value, 30% Large Cap Growth, 30% International, and 10% Small Cap) is a higher risk endeavor today than in the past.
The following chart shows the upside/downside capture (the amount of upside a portfolio "captures" during times when the stock market is rising and vice versa) of a diversified stock portfolio in 1991 versus today.
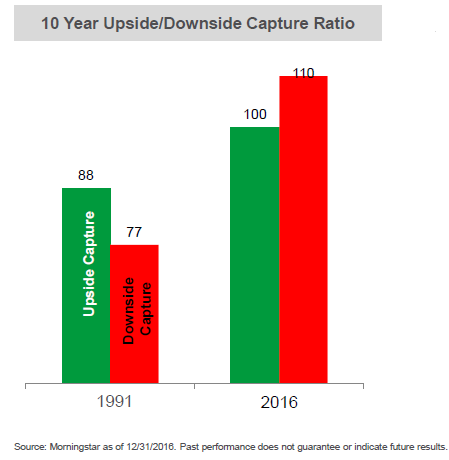
On the left side of the chart, you will see that 25 years ago, a diversified stock portfolio captured 88% of the upside when stocks were rising and then just 77% of the downside when stock were falling. And when you do the math, it becomes clear that this is a winning combination over time.
However, as of 12/31/2016, the situation has changed - dramatically. The good news is that according to BlackRock, a diversified stock portfolio now captures ALL of the upside during rising markets. The bad news is that the portfolio now captures MORE (110% to be exact) of the downside. This alone helps explain why so many managers have underperformed.
Losing Less Is Powerful
Mr. Peterson went on to pound the table about how important it is to "lose less" during bear market environments.
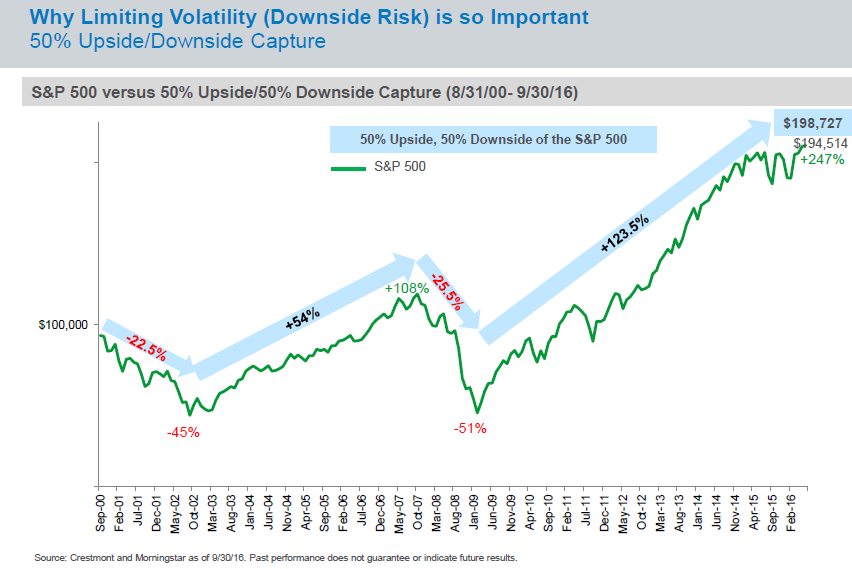
The following chart illustrates the return of the S&P 500 and the hypothetical return of a portfolio that captured 50% of the upside during rising markets and 50% of the downside during falling markets since 2000.
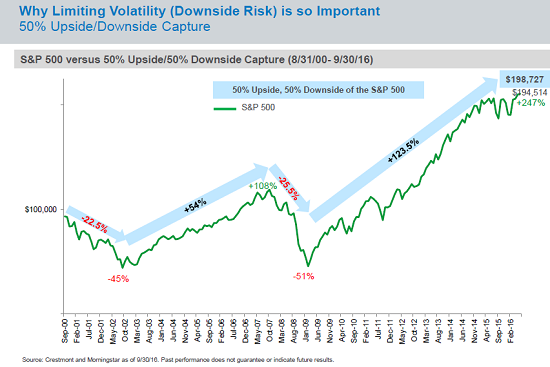
While it may be hard to fathom, capturing just 50% of both the upside and the downside actually produces a higher return than the buy-and-hope approach.
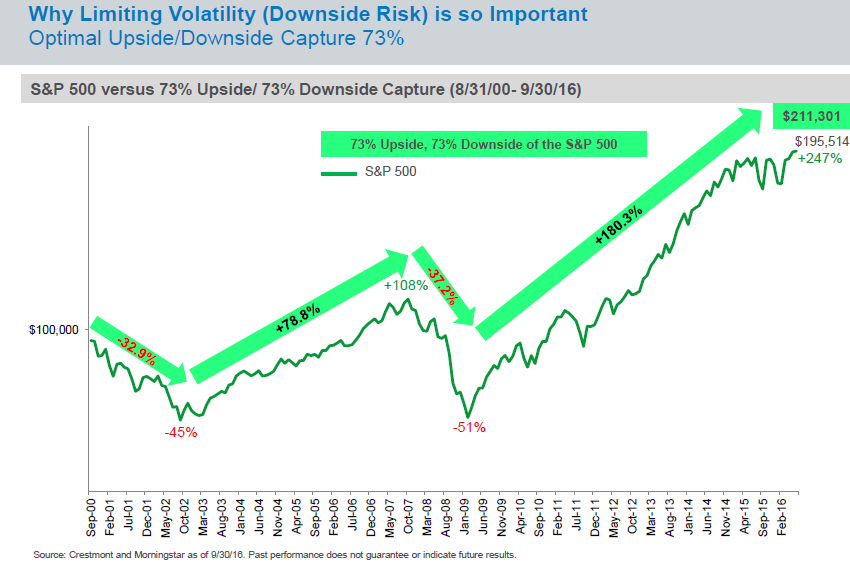
Next, BlackRock wanted to know what the optimal upside/downside capture was over the last 17 years.

As the chart illustrates, capturing 73% of both the upside and the downside would have produced superior results.
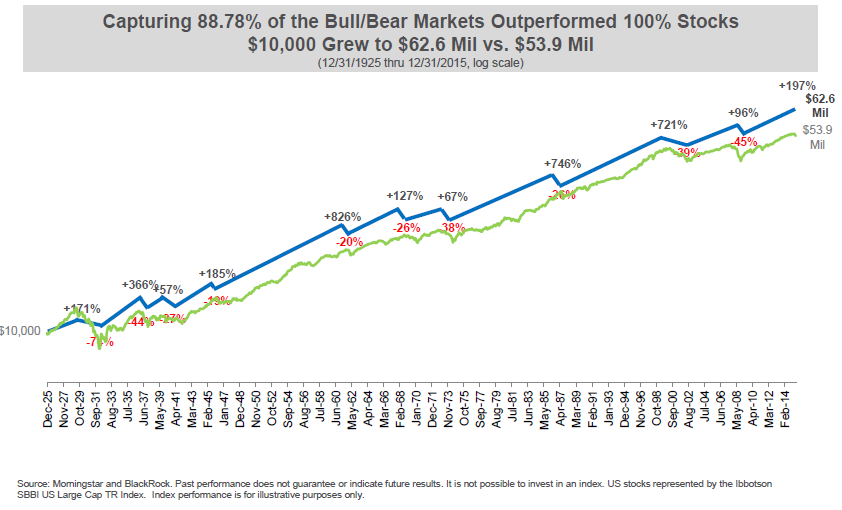
And in order to prove that this concept wasn't just a passing fancy that worked well in a single period, BlackRock went back to 1926.
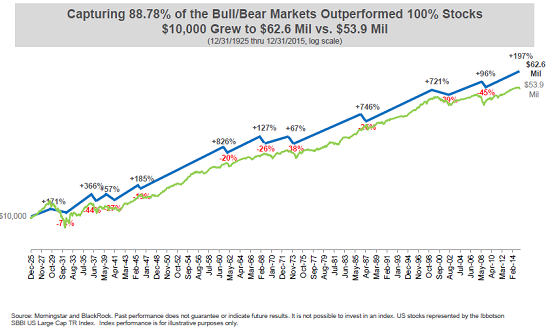
What they found was that an upside/downside capture ratio of 89% produced more gains over the 90-year period.
BlackRock's Approach to Managing Risk
The next logical question is how does one go about creating a portfolio that would generate the desired upside/downside capture?
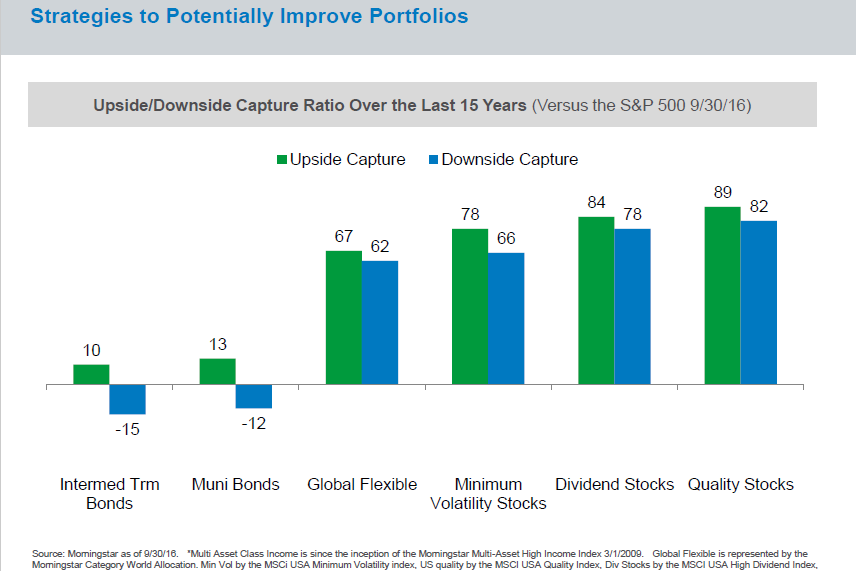
BlackRock went back and looked at the upside/downside capture of various asset classes/factors over the last fifteen years including: Intermediate-Term Corporate Bonds, Muni Bonds, Global Flexible, Minimum Volatility, Dividend Payers, and High Quality Stocks. Below is the summary of the upside/downside of each.

As the chart shows, the first point is that a dose of corporate and/or muni bonds is likely to do the job as the downside capture of both is actually negative - meaning that these bonds go up when stocks go down.
If you look at the spread between the upside and downside capture numbers, it becomes clear that Minimum Volatility and Dividend Paying stocks also can get the job done.
BlackRock's Plan
The final chart below shows BlackRock's idea for a portfolio that creates favorable upside/downside capture versus the traditional diversified equity portfolio.
Instead of 70% US stocks split by 30% Large Cap Growth/Value and 10% Small Cap, and then 30% International, BlackRock proposes cutting the LC Growth/Value allocation in half and substituting Minimum Volatility and Dividend Payers. Next, they propose replacing Small Caps with Min Vol Small Caps. And finally, they split the 30% International allocation into two parts and insert half International Min Vol.
Thus, 55% of the portfolio becomes classes/factors that have historically enjoyed favorable upside/downside ratios. And according to BlackRock, such a portfolio would have created 89% upside capture over the last ten years and 86% downside capture, which based on the research provided would appear to be a strong combination.
In closing, I will say that I think investors can/should do more to limit downside exposure during severely negative market environments. However, I am thrilled to see a firm of the size and stature as BlackRock singing the risk management song.
Publishing Note: I have early commitments for the rest of this week and will publish reports as time permits.
Thought For The Day:
Never attribute to malice that which can be explained by ignorance.
Current Market Drivers
We strive to identify the driving forces behind the market action on a daily basis. The thinking is that if we can both identify and understand why stocks are doing what they are doing on a short-term basis; we are not likely to be surprised/blind-sided by a big move. Listed below are what we believe to be the driving forces of the current market (Listed in order of importance).
1. The State of the U.S. Economy
2. The State of Earning Growth
3. The State of Trump Administration Policies
Wishing you green screens and all the best for a great day,

David D. Moenning
Chief Investment Officer
Sowell Management Services
Disclosure: At the time of publication, Mr. Moenning and/or Sowell Management Services held long positions in the following securities mentioned: none. Note that positions may change at any time.
Looking for a "Modern" approach to Asset Allocation and Portfolio Design?
Looking for More on the State of the Markets?
Disclosures
The opinions and forecasts expressed herein are those of Mr. David Moenning and may not actually come to pass. Mr. Moenning's opinions and viewpoints regarding the future of the markets should not be construed as recommendations. The analysis and information in this report is for informational purposes only. No part of the material presented in this report is intended as an investment recommendation or investment advice. Neither the information nor any opinion expressed constitutes a solicitation to purchase or sell securities or any investment program.
Any investment decisions must in all cases be made by the reader or by his or her investment adviser. Do NOT ever purchase any security without doing sufficient research. There is no guarantee that the investment objectives outlined will actually come to pass. All opinions expressed herein are subject to change without notice. Neither the editor, employees, nor any of their affiliates shall have any liability for any loss sustained by anyone who has relied on the information provided.
The analysis provided is based on both technical and fundamental research and is provided "as is" without warranty of any kind, either expressed or implied. Although the information contained is derived from sources which are believed to be reliable, they cannot be guaranteed.
David D. Moenning is an investment adviser representative of Sowell Management Services, a registered investment advisor. For a complete description of investment risks, fees and services, review the firm brochure (ADV Part 2) which is available by contacting Sowell. Sowell is not registered as a broker-dealer.
Employees and affiliates of Sowell may at times have positions in the securities referred to and may make purchases or sales of these securities while publications are in circulation. Positions may change at any time.
Investments in equities carry an inherent element of risk including the potential for significant loss of principal. Past performance is not an indication of future results.
Advisory services are offered through Sowell Management Services.