Fear Has Arrived. What's The Plan?
Anyone thinking that the stock market would simply ignore the potential economic impact of the coronavirus pandemic is getting a wakeup call this morning. Instead of focusing on the bright side and the stimulus plans that have been bandied about in places like China, stocks are now in full-on price exploration mode - to the downside.
On Friday, stocks fell, but the coronavirus really wasn't to blame. Although the outbreak is far from contained, investors faced a different sort of worry on Friday - punk data in the good 'ol USofA. In short, it was the Markit Services Purchasing Manager Index causing trouble at the end of last week. While the Markit number is a "flash" reading and can vary widely from the official ISM readings, I think there are two key takeaways here.
First, we aren't talking about the manufacturing sector. No, this is the services sector. You know, the sector that has been holding up nicely and accounts for something on the order of two-thirds of the U.S. economy. Next, with the reading coming in at 49.4, there can be no denying that activity in the services sector appears to have slowed, which if confirmed by other data, is a pretty big surprise. It is also worth noting that this was the weakest print since 2013 and more importantly, was below the all-important 50 level (recall that readings below 50 indicate contraction). Also, the number was well below the 53.4 that economists were expecting. As one analyst put it, "A collective "yikes" filtered through markets: Treasury yields fell, oil priced slumped, the price of gold rose, and stocks fell."
Frankly, I took Friday's report in stride. Sure, I raised an eyebrow at the number. However, this report also runs contrary to almost all other data relating to the U.S. consumer. Thus, I didn't see it as a reason to panic.
Then came the 2:00am alert on my phone saying that Dow futures were down first 700, and then 900 points. This certainly got my attention and puts the current pullback in a different light.
I'll opine that there is clearly high-speed trading involved this morning. And hedging. And shorting for profit. And taking profits. And running for the hills. It's clearly a one-way street today and there is simply no telling where the indices end the day. If I had to guess, I'd bet that the Dow will fall more than 1,000 points at some point in the day. Remember, computers run wild on days like these and don't stop until the closine bell rings.
From my seat, the first key question we have to consider with the S&P down over 100 points is, how much of this is "real" and how much should be seen as trading "noise?" How much is fundamental and how much is traders all doing the same thing at the same time?
To be sure, we've seen this movie before. Something causes a bad-news panic to begin in an overbought/over-believed market. The computers do their thing and a waterfall decline ensues. Within a few days/weeks, prices wind up going too far. Then, out of the blue - and usually when the outlook is the darkest - something good comes along (friendly Fedspeak for example). Next the V-bottom occurs. And within days, the indices are right back to where they started. Such is the way the game is played these days.
Unless, of course, there is something happening to cause the U.S. consumer to stop spending on a dime. In the early days after the Financial Crisis, traders learned the hard way that John Q. Public and his family will pull in the reins quickly if they get scared. And when the consumer stops spending, the U.S. economy slows down - fast.
So, for me, the question of the day is if this pandemic will scare consumers here in the U.S. I.E. scare them enough to put that vacation on hold. To avoid the mall (oops, I mean Amazon.com). To wait a while on upgrading those kitchen appliances. To scale down on their birthday gifts. Etc.
At this stage, I don't see the big, bad, bear case evolving. And yes, it makes sense to add a "(yet???)" to the end of the last sentence. But from my perch, the bottom line is we don't have thousands of cases of the coronavirus across the country. The virus isn't killing people in the United States of America. As such, I'll argue that the folks won't stop using Microsoft. They won't change their spending habits to any great degree. (Well, okay, I will agree that this might not be a great time to be a cruise ship operator!) And if the consumer doesn't change their spending habits, then the U.S. economy isn't likely to be severely impacted. And if the economy isn't impacted to any great degree, then earnings will be fine. And if earnings are fine, then the market indices WILL recover in time. Especially if the central bankers of the world start talking nice again.
For now, it is important to recognize that this is the dip that investors were worried wouldn't ever give them a chance to "get in" a few weeks back. This is the dip that should be scaled into. This is the dip that Warren Buffett said he will be buying.
However, it probably isn't a great idea to do all your dip-buying at once. No, take your time. Spread it out. Give yourself a chance to take advantage of the sale going on in some of the big names. Next, recognize that you won't get the bottom - you rarely, if ever, do. But adding to positions and/or portfolios during a big scare has been a great strategy for a very long time. And frankly, I don't think this time will be any different.
Weekly Market Model Review
Each week we do a disciplined, deep dive into our key market indicators and models. The overall goal of this exercise is to (a) remove emotion from the investment process, (b) stay "in tune" with the primary market cycles, and (c) remain cognizant of the risk/reward environment.
The Major Market Models
We start with six of our favorite long-term market models. These models are designed to help determine the "state" of the overall market.
There are two changes to report on the Primary Cycle board this week. First, the Leading Indicators flip-flopped again this week; moving back into neutral territory (albeit the reading is "high neutral") from positive. In addition, the Risk/Reward model also pulled back to the neutral zone. The good news is that there are no sell signals on the board at the present time. But, given that 4 models now sport neutral readings, I think we have to recognize that the environment "could" be shifting. I'm not ready to declare that a change is afoot. But I will admit that my favorite big-picture models are starting to wobble a bit. The bottom line is (a) pullbacks never "feel" good when they are happening but we also need to recognize that a "dip" may be unfolding and (b) I still believe we are in a "buy the dip" environment.
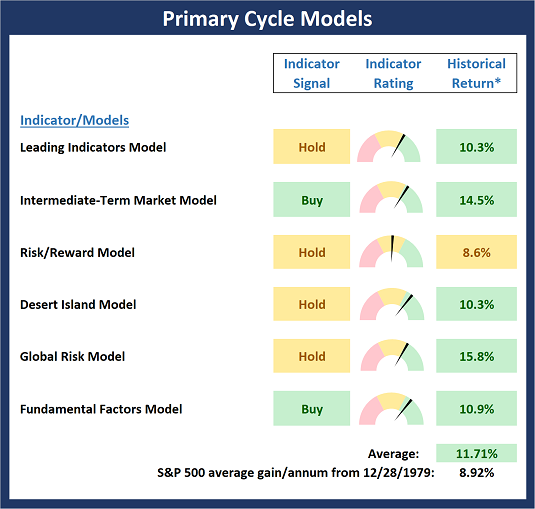
* Source: Ned Davis Research (NDR) as of the date of publication. Historical returns are hypothetical average annual performances calculated by NDR. Past performances do not guarantee future results or profitability - NOT INDIVIDUAL INVESTMENT ADVICE.
View My Favorite Market Models Online
The State of the Fundamental Backdrop
Next, we review the market's fundamental factors in the areas of interest rates, the economy, inflation, and valuations.
There was a change to take note of on the Fundamental Factors board this week. Our Inflation model upticked to positive and flashed a fresh buy signal. While one can argue that deflationary pressures remain in place and are problematic from a central banker point of view, it is important to remember that low inflation environments have historically been kind to stock market investors. So, with the Fundamental board in good shape, I'll continue to opine that the bulls should be given the benefit of any/all doubt and all the dips (scary and otherwise) should be bought.
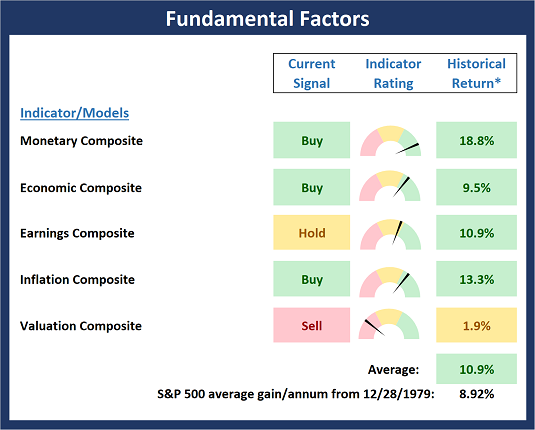
* Source: Ned Davis Research (NDR) as of the date of publication. Historical returns are hypothetical average annual performances calculated by NDR. Past performances do not guarantee future results or profitability - NOT INDIVIDUAL INVESTMENT ADVICE.
View Fundamental Indicator Board Online
The State of the Trend
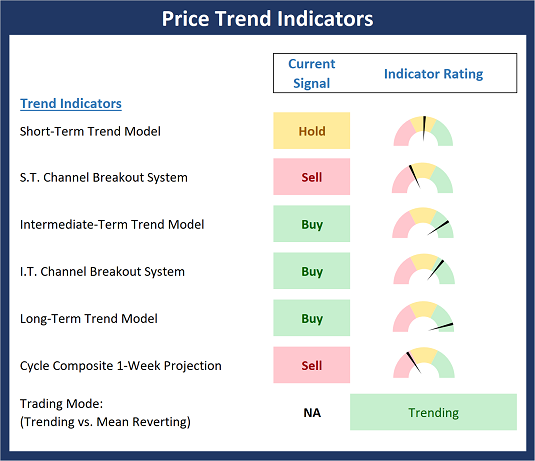
After looking at the big-picture models and the fundamental backdrop, I like to look at the state of the trend. This board of indicators is designed to tell us about the overall technical health of the current trend.
The key change to the Price Trend board is the pullback by both our Short-Term Trend and Channel Breakout System models. The Trend model moved from positive to neutral as the major indices are now off their highs and have made no price progress over the last two weeks. And the Channel Breakout System, which is the most skittish of our trend-following indicators moved to a sell lasts week. However, it is important to note that it wouldn't take much upside action to flip this indicator back to positive. Bottom line is that the trend is starting to look a bit shaky from a near-term perspective but still in good shape from the intermediate- and longer-term trend perspectives.
NOT INDIVIDUAL INVESTMENT ADVICE.
View Trend Indicator Board Online
The State of Internal Momentum
Next, we analyze the "oomph" behind the current trend via our group of market momentum indicators/models.
The was a fair amount of movement on the Momentum board again this week as the Short-Term Trend and Breadth model slipped back to neutral and all three of our "Thrust" indicators moved from positive to neutral. While this is hardly a death knell for the market, it does indicate that the momentum tailwinds that have been in place for some time appear to be fading a bit here.
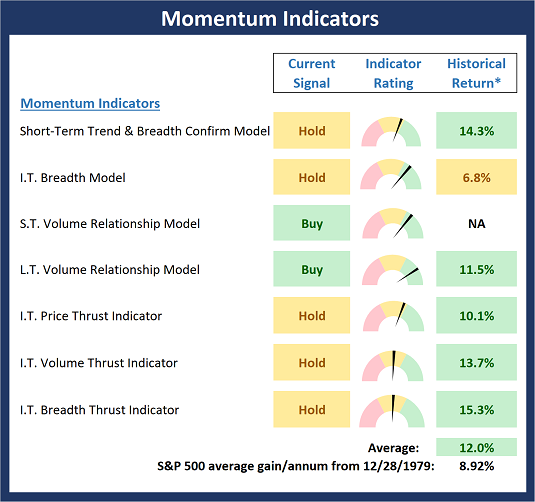
* Source: Ned Davis Research (NDR) as of the date of publication. Historical returns are hypothetical average annual performances calculated by NDR. Past performances do not guarantee future results or profitability - NOT INDIVIDUAL INVESTMENT ADVICE.
View Momentum Indicator Board Online
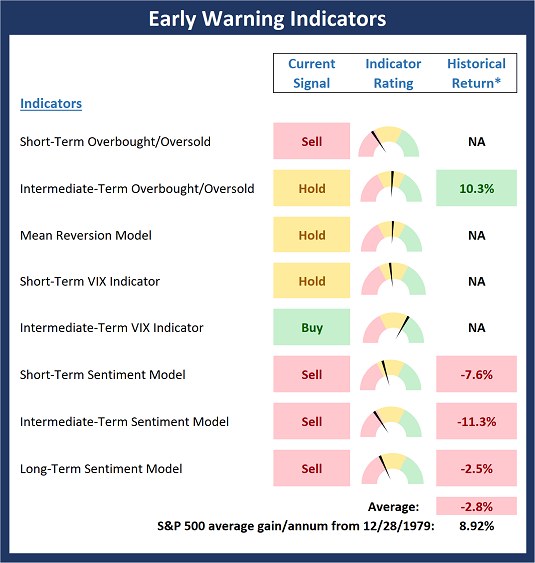
Early Warning Signals
Once we have identified the current environment, the state of the trend, and the degree of momentum behind the move, we then review the potential for a counter-trend move to begin. This batch of indicators is designed to suggest when the table is set for the trend to "go the other way."
The Early Warning board continued to move toward the bears side of the ledger last week. However, given that price has already started to slip and that pullbacks have been short and shallow of late, I'm not interested in pounding the table with a bearish argument here. Sure, the news flow wasn't great and many of the leaders took a hit last week . However, the bottom line is the moves in many of the big-name winners was getting out of hand and the bulls were due to take a break.
* Source: Ned Davis Research (NDR) as of the date of publication. Historical returns are hypothetical average annual performances calculated by NDR. Past performances do not guarantee future results or profitability - NOT INDIVIDUAL INVESTMENT ADVICE.
View Early Warning Indicator Board Online
Thought For The Day:
An investment in knowledge pays the best interest. - Benjamin Franklin
Wishing you green screens and all the best for a great day,

David D. Moenning
Founder, Chief Investment Officer
Heritage Capital Research

Disclosures
At the time of publication, Mr. Moenning held long positions in the following securities mentioned: MSFT, AMZN - Note that positions may change at any time.
Leading Indicators Model: A group of indicators that have historically shown tendencies to lead the market at major turning points.
Intermediate-Term Market Model: A composite model (model of models) focused on trend and momentum indicators which has been designed to provide identify intermediate-term trading opportunities.
Risk/Reward Model: A model-of-models intended to provide an overall view of the state of the risk/reward environment. The model includes tape, monetary, and sentiment indicators as well as 7 big-picture market model readings.
Desert Island Model: If I was stranded on a desert island with access to only one market model to manage money with, this would be the model. The model is a comprehensive model-of-models comprised of trend, momentum, mean reversion, economic, monetary, sentiment, and factor-based indicators/models.
External Factors Model: A model-of-models designed to provide a reading on the "macro state" of the market environment. The model is comprised of indicators/models in the areas of various index yields, industrial production, investors sentiment, and historic volatility.
Short-Term Trend-and-Breadth Signal Explained: History shows the most reliable market moves tend to occur when the breadth indices are in gear with the major market averages. When the breadth measures diverge, investors should take note that a trend reversal may be at hand. This indicator incorporates NDR's All-Cap Dollar Weighted Equity Series and A/D Line. From 1998, when the A/D line is above its 5-day smoothing and the All-Cap Equal Weighted Equity Series is above its 25-day smoothing, the equity index has gained at a rate of +32.5% per year. When one of the indicators is above its smoothing, the equity index has gained at a rate of +13.3% per year. And when both are below, the equity index has lost +23.6% per year.
Channel Breakout System Explained: The short-term and intermediate-term Channel Breakout Systems are modified versions of the Donchian Channel indicator. According to Wikipedia, "The Donchian channel is an indicator used in market trading developed by Richard Donchian. It is formed by taking the highest high and the lowest low of the last n periods. The area between the high and the low is the channel for the period chosen."
Intermediate-Term Trend-and-Breadth Signal Explained: This indicator incorporates NDR's All-Cap Dollar Weighted Equity Series and A/D Line. From 1998, when the A/D line is above its 45-day smoothing and the All-Cap Equal Weighted Equity Series is above its 45-day smoothing, the equity index has gained at a rate of +17.6% per year. When one of the indicators is above its smoothing, the equity index has gained at a rate of +6.5% per year. And when both are below, the equity index has lost -1.3% per year.
Cycle Composite Projections: The cycle composite combines the 1-year Seasonal, 4-year Presidential, and 10-year Decennial cycles. The indicator reading shown uses the cycle projection for the upcoming week.
Trading Mode Indicator: This indicator attempts to identify whether the current trading environment is "trending" or "mean reverting." The indicator takes the composite reading of the Efficiency Ratio, the Average Correlation Coefficient, and Trend Strength models.
Volume Relationship Models: These models review the relationship between "supply" and "demand" volume over the short- and intermediate-term time frames.
Price Thrust Model Explained: This indicator measures the 3-day rate of change of the Value Line Composite relative to the standard deviation of the 30-day average. When the Value Line's 3-day rate of change have moved above 0.5 standard deviation of the 30-day average ROC, a "thrust" occurs and since 2000, the Value Line Composite has gained ground at a rate of +20.6% per year. When the indicator is below 0.5 standard deviation of the 30-day, the Value Line has lost ground at a rate of -10.0% per year. And when neutral, the Value Line has gained at a rate of +5.9% per year.
Volume Thrust Model Explained: This indicator uses NASDAQ volume data to indicate bullish and bearish conditions for the NASDAQ Composite Index. The indicator plots the ratio of the 10-day total of NASDAQ daily advancing volume (i.e., the total volume traded in stocks which rose in price each day) to the 10-day total of daily declining volume (volume traded in stocks which fell each day). This ratio indicates when advancing stocks are attracting the majority of the volume (readings above 1.0) and when declining stocks are seeing the heaviest trading (readings below 1.0). This indicator thus supports the case that a rising market supported by heavier volume in the advancing issues tends to be the most bullish condition, while a declining market with downside volume dominating confirms bearish conditions. When in a positive mode, the NASDAQ Composite has gained at a rate of +38.3% per year, When neutral, the NASDAQ has gained at a rate of +13.3% per year. And when negative, the NASDAQ has lost at a rate of -14.279% per year.
Breadth Thrust Model Explained: This indicator uses the number of NASDAQ-listed stocks advancing and declining to indicate bullish or bearish breadth conditions for the NASDAQ Composite. The indicator plots the ratio of the 10-day total of the number of stocks rising on the NASDAQ each day to the 10-day total of the number of stocks declining each day. Using 10-day totals smooths the random daily fluctuations and gives indications on an intermediate-term basis. As expected, the NASDAQ Composite performs much better when the 10-day A/D ratio is high (strong breadth) and worse when the indicator is in its lower mode (weak breadth). The most bullish conditions for the NASDAQ when the 10-day A/D indicator is not only high, but has recently posted an extreme high reading and thus indicated a thrust of upside momentum. Bearish conditions are confirmed when the indicator is low and has recently signaled a downside breadth thrust. In positive mode, the NASDAQ has gained at a rate of +22.1% per year since 1981. In a neutral mode, the NASDAQ has gained at a rate of +14.5% per year. And when in a negative mode, the NASDAQ has lost at a rate of -6.4% per year.
Short-Term Overbought/sold Indicator: This indicator is the current reading of the 14,1,3 stochastic oscillator. When the oscillator is above 80 and the %K is above the %D, the indicator gives an overbought reading. Conversely, when the oscillator is below 20 and %K is below its %D, the indicator is oversold.
Intermediate-Term Overbought/sold Indicator: This indicator is a 40-day RSI reading. When above 57.5, the indicator is considered overbought and wnen below 45 it is oversold.
Mean Reversion Model: This is a diffusion model consisting of five indicators that can produce buy and sell signals based on overbought/sold conditions.
VIX Indicator: This indicators looks at the current reading of the VIX relative to standard deviation bands. When the indicator reaches an extreme reading in either direction, it is an indication that a market trend could reverse in the near-term.
Short-Term Sentiment Indicator: This is a model-of-models composed of 18 independent sentiment indicators designed to indicate when market sentiment has reached an extreme from a short-term perspective. Historical analysis indicates that the stock market's best gains come after an environment has become extremely negative from a sentiment standpoint. Conversely, when sentiment becomes extremely positive, market returns have been subpar.
Intermediate-Term Sentiment Indicator: This is a model-of-models composed of 7 independent sentiment indicators designed to indicate when market sentiment has reached an extreme from a intermediate-term perspective. Historical analysis indicates that the stock market's best gains come after an environment has become extremely negative from a sentiment standpoint. Conversely, when sentiment becomes extremely positive, market returns have been subpar.
Long-Term Sentiment Indicator: This is a model-of-models composed of 6 independent sentiment indicators designed to indicate when market sentiment has reached an extreme from a long-term perspective. Historical analysis indicates that the stock market's best gains come after an environment has become extremely negative from a sentiment standpoint. Conversely, when sentiment becomes extremely positive, market returns have been subpar.
Absolute Monetary Model Explained: The popular cliche, "Don't fight the Fed" is really a testament to the profound impact that interest rates and Fed policy have on the market. It is a proven fact that monetary conditions are one of the most powerful influences on the direction of stock prices. The Absolute Monetary Model looks at the current level of interest rates relative to historical levels and Fed policy.
Relative Monetary Model Explained: The "relative" monetary model looks at monetary indicators relative to recent levels as well as rates of change and Fed Policy.
Economic Model Explained: During the middle of bull and bear markets, understanding the overall health of the economy and how it impacts the stock market is one of the few truly logical aspects of the stock market. When our Economic model sports a "positive" reading, history (beginning in 1965) shows that stocks enjoy returns in excess of 21% per year. Yet, when the model's reading falls into the "negative" zone, the S&P has lost nearly -25% per year. However, it is vital to understand that there are times when good economic news is actually bad for stocks and vice versa. Thus, the Economic model can help investors stay in tune with where we are in the overall economic cycle.
Inflation Model Explained: They say that "the tape tells all." However, one of the best "big picture" indicators of what the market is expected to do next is inflation. Simply put, since 1962, when the model indicates that inflationary pressures are strong, stocks have lost ground. Yet, when inflationary pressures are low, the S&P 500 has gained ground at a rate in excess of 13%. The bottom line is inflation is one of the primary drivers of stock market returns.
Valuation Model Explained: If you want to get analysts really riled up, you need only to begin a discussion of market valuation. While the question of whether stocks are overvalued or undervalued appears to be a simple one, the subject is actually extremely complex. To simplify the subject dramatically, investors must first determine if they should focus on relative valuation (which include the current level of interest rates) or absolute valuation measures (the more traditional readings of Price/Earnings, Price/Dividend, and Price/Book Value). We believe that it is important to recognize that environments change. And as such, the market's focus and corresponding view of valuations are likely to change as well. Thus, we depend on our Valuation Models to help us keep our eye on the ball.
Disclosures
NOT INVESTMENT ADVICE. The opinions and forecasts expressed herein are those of Mr. David Moenning and Heritage Capital Research and may not actually come to pass. The opinions and viewpoints regarding the future of the markets should not be construed as recommendations. The analysis and information in this report is for informational purposes only. No part of the material presented in this report is intended as an investment recommendation or investment advice. Neither the information nor any opinion expressed constitutes a solicitation to purchase or sell securities or any investment program.
Any investment decisions must in all cases be made by the reader or by his or her investment adviser. Do NOT ever purchase any security without doing sufficient research. There is no guarantee that the investment objectives outlined will actually come to pass. All opinions expressed herein are subject to change without notice. Neither the editor, employees, nor any of their affiliates shall have any liability for any loss sustained by anyone who has relied on the information provided.
Mr. Moenning of Heritage Capital Research is an investment adviser representative of Eastsound Capital Advisors, LLC, a registered investment advisor. The adviser may not transact business in states where it is not appropriately registered, excluded or exempted from registration. Individualized responses to persons that involve either the effecting of transaction in securities, or the rendering of personalized investment advice for compensation, will not be made without registration or exemption.
Mr. Moenning and Heritage Capital Research may at times have positions in the securities referred to and may make purchases or sales of these securities while publications are in circulation. Positions may change at any time.
The analysis provided is based on both technical and fundamental research and is provided "as is" without warranty of any kind, either expressed or implied. Although the information contained is derived from sources which are believed to be reliable, they cannot be guaranteed.
The author neither endorses nor warrants the content of this site, any embedded advertisement, or any linked resource. The author or his managed funds may hold either long or short positions in the referenced securities. Republication rights must be expressly granted by author in writing.
Investments in equities carry an inherent element of risk including the potential for significant loss of principal. Past performance is not an indication of future results.