We Don't Need A Deal, But...
Greetings from York, England. We've just completed our driving tour of Scotland where I learned that a "dual carriageway" sign is a rare and welcome sight from the driver's seat and that most of the "roads" in the Highlands (and rural England) are merely golf cart paths that aren't really wide enough for 2 vehicles - but still have 50 mph speed limits! We are working our way back to London and sadly our adventure ends with a flight back to the states on Thursday. But it will suffice to say that our time across the pond has been, as the Brits like to say, brilliant!
Looking at the markets, stocks continue to be whipped back and forth by the news from the front - the front lines of the trade war, that is. By now, I'm sure you are all well aware of the various tweets, threats, new tariffs, raised tariffs, and retaliatory headlines, so I'll spare you the rehash of who said what and when. For me, the bottom line is this remains a news-driven, trading range environment and we need to (a) keep this in mind when things get hairy and (b) play the game accordingly.
To be sure, there has been some deterioration in the indicators. Yes, a negative macro argument can be made about the state of the global economy. And the latest narrative is that the recent escalation of the trade war leaves no way out for either side. However, I think the most important thing to keep in mind when the indices are diving, and things are looking dire is that in a news-driven environment - good news can happen.
Getting To The Key Point
I'll make my primary point on this beautiful Monday afternoon in the UK by way of a question. So, what happens to that big, bad negative outlook if one takes the trade war off the table? Be sure to include this in your thinking because, from my seat, it is the most likely scenario. The only question in my mind is when a deal gets done.
Timing Is Everything
On that score, the good news is that the meat of the election season isn't too far off. With corporate CEO's blaming weakened growth and a lack of clarity about the future on the trade war uncertainty and the slowdown in the economic data, I believe most will agree that the global economy is either at or close to a tipping point. And come spring of next year, if this thing isn't wrapped up, the President may not be able to get out of the economic hole that is being dug. And no, blaming Jay Powell for the economic slowdown isn't going to fly with anyone who understands markets or economics. So, while some will argue that a deal isn't likely to get done in the near-term, I'm of the mind that the fight is on a short leash due at least in part to the political season.
My thinking is that at this point, the economic hole isn't very deep here in the U.S. To be clear, the economy is nowhere near recession, regardless of what the inverted yield curve might suggest. But remember, economic sentiment is critical at this stage of the game. As we talked about last week, it wouldn't take much for CEO's to start sitting on their hands with regard to expansion, hiring, capex, etc., given the uncertainty created by the trade tiff. And if you toss in the potential for a recession in Germany, a hard Brexit, significant slowing in China, and a falling growth rate here at home, the argument for the "tremendous" Trump Economy loses a whole lot of steam.
In other words, you can't really campaign on your accomplishments if economic growth is falling. Sure, the tax cuts gave the economy a temporary boost last year. But currently, the trend of GDP is down, and the absolute GDP readings are moving in the wrong direction. As one analyst put it, not getting a trade deal done is like taking the trillion dollars spent on the tax cuts and lighting it on fire. So again, while no one on either side will ever admit it, getting the trade spat settled is politically expedient.
Ms. Market Doesn't Need A Signed Deal
While a deal may not be imminent, my thought is that we will likely see some sort of agreement within the next six months. And let's keep in mind that this is also the time frame that the stock market tends to focus on when "discounting" future expectations. So, while I'm just spit ballin' here, if the two sides can stop playing games via Twitter and the press and show us that this thing isn't going to get out of hand, the market can move forward and look ahead to better days.
What I'm attempting to say is that the market doesn't necessarily need a signed deal anytime soon. No, traders just need to feel confident that a deal is going to get done. Once the market can assume a resolution is the most likely scenario, then it can move on.
Now for the bad news. If cooler heads fail to prevail and the trade spat continues to escalate, we very well could have a self-inflicted economic mess on our hands. As such, I am NOT saying that this market is without risk. No, I'm simply saying that logic suggests that a resolution is best for both sides, as well as our friends here in the UK and the rest of Europe.
But now I'm off to a river boat ride to explore York on a glorious afternoon. It is my sincere hope that my day isn't interrupted by yet another tweet. Fingers crossed!
Weekly Market Model Review
Now let's turn to the weekly review of my favorite indicators and market models...
The State of My Favorite Big-Picture Market Models
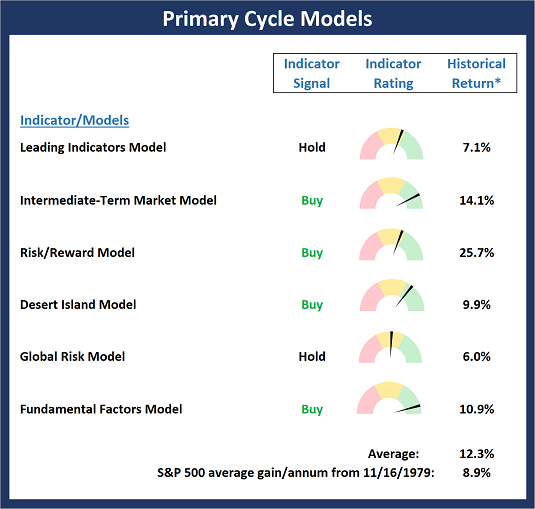
The bears tell us the market is doomed due to the idea that the yield curve has inverted and a recession may be on the way. However, our Primary Cycle board doesn't agree. With 4 buy signals, 2 holds, and no sells, my favorite longer-term indicators continue to suggest that the bulls deserve the benefit of any doubt here.
This week's mean percentage score of my 6 favorite models rose to 68.9% from 62.8%% last week (Prior readings: 71.1%, 70.3%, 84.1%, 79%, 83.9%, 81.1%) while the median also improved to 65.0% versus 63.4% last week (Prior readings: 70.0%, 68.4%, 86.5%, 80%, 86.7%, 82.5%, 68.5%).
* Source: Ned Davis Research (NDR) as of the date of publication. Historical returns are hypothetical average annual performances calculated by NDR. Past performances do not guarantee future results or profitability - NOT INDIVIDUAL INVESTMENT ADVICE.
View My Favorite Market Models Online
The State of the Fundamental Backdrop
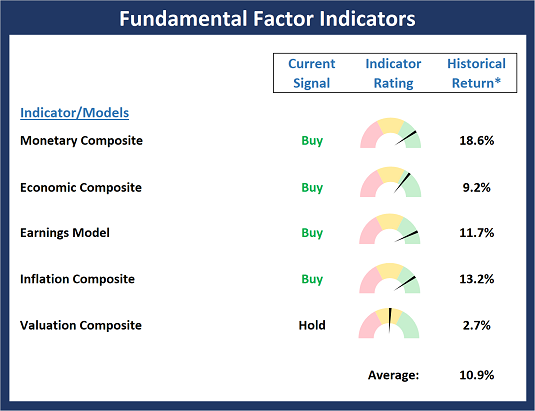
While prices moved wildly in stock and bond markets, the Fundamental Factors board didn't budge an inch. And if you can pull yourself away from the tweets, the headlines and the algo-driven hysterics, the backdrop for equities remains upbeat.
* Source: Ned Davis Research (NDR) as of the date of publication. Historical returns are hypothetical average annual performances calculated by NDR. Past performances do not guarantee future results or profitability - NOT INDIVIDUAL INVESTMENT ADVICE.
View Fundamental Indicator Board Online
The State of the Trend
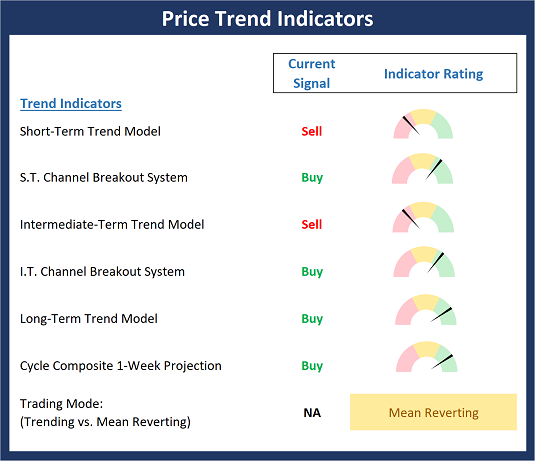
Last week, I wrote that I was putting less importance on precise price levels and trends due to the fact that algo trading tends to exaggerate intraday movements. This week's market machinations are a perfect example of this point. One minute stocks look ready to break out to the upside and the next - after a tweet or two - the major indices are threatening to break down. This is just the way the game is played in a news-driven, trading range environment. So, my advice is to put less emphasis on the near-term price movements and instead stay in tune with the big picture environment. And for now, this remains modestly positive for the U.S. stock market.
NOT INDIVIDUAL INVESTMENT ADVICE.
View Trend Indicator Board Online
The State of Internal Momentum
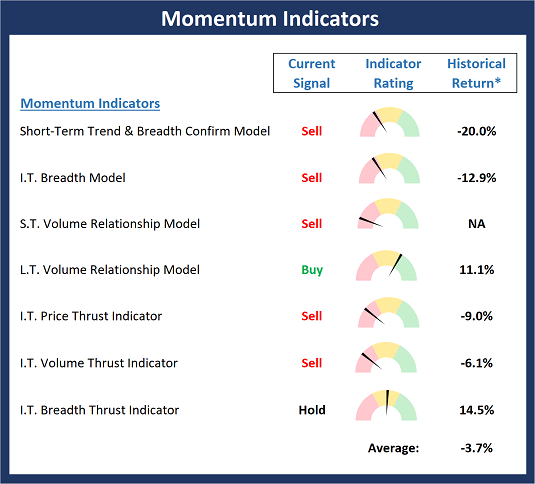
As I've been saying the last few weeks, the Momentum board continues to be a problem and suggests that some caution is warranted. The good news is that several of the board's indicators are beginning to become oversold. The bad news is that the current "state" of the board gives the bears an edge if the overall environment weakens further.
* Source: Ned Davis Research (NDR) as of the date of publication. Historical returns are hypothetical average annual performances calculated by NDR. Past performances do not guarantee future results or profitability - NOT INDIVIDUAL INVESTMENT ADVICE.
View Momentum Indicator Board Online
The State of the "Trade"
With stocks flip-flopping on every tweet, the typical "flow" of the early warning indicators has been interrupted. Thus, we will have to wait for the stars to align in order to have more confidence in making a mean-reversion call. At this stage, things are starting to move the bulls' direction, but they aren't quite there yet. But then again, it is the next positive tweet that will likely move markets and not an oversold condition.

* Source: Ned Davis Research (NDR) as of the date of publication. Historical returns are hypothetical average annual performances calculated by NDR. Past performances do not guarantee future results or profitability - NOT INDIVIDUAL INVESTMENT ADVICE.
View Early Warning Indicator Board Online
Thought For The Day:
Never believe that a few caring people can't change the world. -Margaret Mead
Wishing you green screens and all the best for a great day,

David D. Moenning
Founder, Chief Investment Officer
Heritage Capital Research

HCR Focuses on a Risk-Managed Approach to Investing
What Risk Management Can and Cannot Do
Disclosures
At the time of publication, Mr. Moenning held long positions in the following securities mentioned: None - Note that positions may change at any time.
Leading Indicators Model: A group of indicators that have historically shown tendencies to lead the market at major turning points.
Intermediate-Term Market Model: A composite model (model of models) focused on trend and momentum indicators which has been designed to provide identify intermediate-term trading opportunities.
Risk/Reward Model: A model-of-models intended to provide an overall view of the state of the risk/reward environment. The model includes tape, monetary, and sentiment indicators as well as 7 big-picture market model readings.
Desert Island Model: If I was stranded on a desert island with access to only one market model to manage money with, this would be the model. The model is a comprehensive model-of-models comprised of trend, momentum, mean reversion, economic, monetary, sentiment, and factor-based indicators/models.
External Factors Model: A model-of-models designed to provide a reading on the "macro state" of the market environment. The model is comprised of indicators/models in the areas of various index yields, industrial production, investors sentiment, and historic volatility.
Short-Term Trend-and-Breadth Signal Explained: History shows the most reliable market moves tend to occur when the breadth indices are in gear with the major market averages. When the breadth measures diverge, investors should take note that a trend reversal may be at hand. This indicator incorporates NDR's All-Cap Dollar Weighted Equity Series and A/D Line. From 1998, when the A/D line is above its 5-day smoothing and the All-Cap Equal Weighted Equity Series is above its 25-day smoothing, the equity index has gained at a rate of +32.5% per year. When one of the indicators is above its smoothing, the equity index has gained at a rate of +13.3% per year. And when both are below, the equity index has lost +23.6% per year.
Channel Breakout System Explained: The short-term and intermediate-term Channel Breakout Systems are modified versions of the Donchian Channel indicator. According to Wikipedia, "The Donchian channel is an indicator used in market trading developed by Richard Donchian. It is formed by taking the highest high and the lowest low of the last n periods. The area between the high and the low is the channel for the period chosen."
Intermediate-Term Trend-and-Breadth Signal Explained: This indicator incorporates NDR's All-Cap Dollar Weighted Equity Series and A/D Line. From 1998, when the A/D line is above its 45-day smoothing and the All-Cap Equal Weighted Equity Series is above its 45-day smoothing, the equity index has gained at a rate of +17.6% per year. When one of the indicators is above its smoothing, the equity index has gained at a rate of +6.5% per year. And when both are below, the equity index has lost -1.3% per year.
Cycle Composite Projections: The cycle composite combines the 1-year Seasonal, 4-year Presidential, and 10-year Decennial cycles. The indicator reading shown uses the cycle projection for the upcoming week.
Trading Mode Indicator: This indicator attempts to identify whether the current trading environment is "trending" or "mean reverting." The indicator takes the composite reading of the Efficiency Ratio, the Average Correlation Coefficient, and Trend Strength models.
Volume Relationship Models: These models review the relationship between "supply" and "demand" volume over the short- and intermediate-term time frames.
Price Thrust Model Explained: This indicator measures the 3-day rate of change of the Value Line Composite relative to the standard deviation of the 30-day average. When the Value Line's 3-day rate of change have moved above 0.5 standard deviation of the 30-day average ROC, a "thrust" occurs and since 2000, the Value Line Composite has gained ground at a rate of +20.6% per year. When the indicator is below 0.5 standard deviation of the 30-day, the Value Line has lost ground at a rate of -10.0% per year. And when neutral, the Value Line has gained at a rate of +5.9% per year.
Volume Thrust Model Explained: This indicator uses NASDAQ volume data to indicate bullish and bearish conditions for the NASDAQ Composite Index. The indicator plots the ratio of the 10-day total of NASDAQ daily advancing volume (i.e., the total volume traded in stocks which rose in price each day) to the 10-day total of daily declining volume (volume traded in stocks which fell each day). This ratio indicates when advancing stocks are attracting the majority of the volume (readings above 1.0) and when declining stocks are seeing the heaviest trading (readings below 1.0). This indicator thus supports the case that a rising market supported by heavier volume in the advancing issues tends to be the most bullish condition, while a declining market with downside volume dominating confirms bearish conditions. When in a positive mode, the NASDAQ Composite has gained at a rate of +38.3% per year, When neutral, the NASDAQ has gained at a rate of +13.3% per year. And when negative, the NASDAQ has lost at a rate of -14.279% per year.
Breadth Thrust Model Explained: This indicator uses the number of NASDAQ-listed stocks advancing and declining to indicate bullish or bearish breadth conditions for the NASDAQ Composite. The indicator plots the ratio of the 10-day total of the number of stocks rising on the NASDAQ each day to the 10-day total of the number of stocks declining each day. Using 10-day totals smooths the random daily fluctuations and gives indications on an intermediate-term basis. As expected, the NASDAQ Composite performs much better when the 10-day A/D ratio is high (strong breadth) and worse when the indicator is in its lower mode (weak breadth). The most bullish conditions for the NASDAQ when the 10-day A/D indicator is not only high, but has recently posted an extreme high reading and thus indicated a thrust of upside momentum. Bearish conditions are confirmed when the indicator is low and has recently signaled a downside breadth thrust. In positive mode, the NASDAQ has gained at a rate of +22.1% per year since 1981. In a neutral mode, the NASDAQ has gained at a rate of +14.5% per year. And when in a negative mode, the NASDAQ has lost at a rate of -6.4% per year.
Short-Term Overbought/sold Indicator: This indicator is the current reading of the 14,1,3 stochastic oscillator. When the oscillator is above 80 and the %K is above the %D, the indicator gives an overbought reading. Conversely, when the oscillator is below 20 and %K is below its %D, the indicator is oversold.
Intermediate-Term Overbought/sold Indicator: This indicator is a 40-day RSI reading. When above 57.5, the indicator is considered overbought and wnen below 45 it is oversold.
Mean Reversion Model: This is a diffusion model consisting of five indicators that can produce buy and sell signals based on overbought/sold conditions.
VIX Indicator: This indicators looks at the current reading of the VIX relative to standard deviation bands. When the indicator reaches an extreme reading in either direction, it is an indication that a market trend could reverse in the near-term.
Short-Term Sentiment Indicator: This is a model-of-models composed of 18 independent sentiment indicators designed to indicate when market sentiment has reached an extreme from a short-term perspective. Historical analysis indicates that the stock market's best gains come after an environment has become extremely negative from a sentiment standpoint. Conversely, when sentiment becomes extremely positive, market returns have been subpar.
Intermediate-Term Sentiment Indicator: This is a model-of-models composed of 7 independent sentiment indicators designed to indicate when market sentiment has reached an extreme from a intermediate-term perspective. Historical analysis indicates that the stock market's best gains come after an environment has become extremely negative from a sentiment standpoint. Conversely, when sentiment becomes extremely positive, market returns have been subpar.
Long-Term Sentiment Indicator: This is a model-of-models composed of 6 independent sentiment indicators designed to indicate when market sentiment has reached an extreme from a long-term perspective. Historical analysis indicates that the stock market's best gains come after an environment has become extremely negative from a sentiment standpoint. Conversely, when sentiment becomes extremely positive, market returns have been subpar.
Absolute Monetary Model Explained: The popular cliche, "Don't fight the Fed" is really a testament to the profound impact that interest rates and Fed policy have on the market. It is a proven fact that monetary conditions are one of the most powerful influences on the direction of stock prices. The Absolute Monetary Model looks at the current level of interest rates relative to historical levels and Fed policy.
Relative Monetary Model Explained: The "relative" monetary model looks at monetary indicators relative to recent levels as well as rates of change and Fed Policy.
Economic Model Explained: During the middle of bull and bear markets, understanding the overall health of the economy and how it impacts the stock market is one of the few truly logical aspects of the stock market. When our Economic model sports a "positive" reading, history (beginning in 1965) shows that stocks enjoy returns in excess of 21% per year. Yet, when the model's reading falls into the "negative" zone, the S&P has lost nearly -25% per year. However, it is vital to understand that there are times when good economic news is actually bad for stocks and vice versa. Thus, the Economic model can help investors stay in tune with where we are in the overall economic cycle.
Inflation Model Explained: They say that "the tape tells all." However, one of the best "big picture" indicators of what the market is expected to do next is inflation. Simply put, since 1962, when the model indicates that inflationary pressures are strong, stocks have lost ground. Yet, when inflationary pressures are low, the S&P 500 has gained ground at a rate in excess of 13%. The bottom line is inflation is one of the primary drivers of stock market returns.
Valuation Model Explained: If you want to get analysts really riled up, you need only to begin a discussion of market valuation. While the question of whether stocks are overvalued or undervalued appears to be a simple one, the subject is actually extremely complex. To simplify the subject dramatically, investors must first determine if they should focus on relative valuation (which include the current level of interest rates) or absolute valuation measures (the more traditional readings of Price/Earnings, Price/Dividend, and Price/Book Value). We believe that it is important to recognize that environments change. And as such, the market's focus and corresponding view of valuations are likely to change as well. Thus, we depend on our Valuation Models to help us keep our eye on the ball.
Disclosures
NOT INVESTMENT ADVICE. The opinions and forecasts expressed herein are those of Mr. David Moenning and Heritage Capital Research and may not actually come to pass. The opinions and viewpoints regarding the future of the markets should not be construed as recommendations. The analysis and information in this report is for informational purposes only. No part of the material presented in this report is intended as an investment recommendation or investment advice. Neither the information nor any opinion expressed constitutes a solicitation to purchase or sell securities or any investment program.
Any investment decisions must in all cases be made by the reader or by his or her investment adviser. Do NOT ever purchase any security without doing sufficient research. There is no guarantee that the investment objectives outlined will actually come to pass. All opinions expressed herein are subject to change without notice. Neither the editor, employees, nor any of their affiliates shall have any liability for any loss sustained by anyone who has relied on the information provided.
Mr. Moenning of Heritage Capital Research is an investment adviser representative of Eastsound Capital Advisors, LLC, a registered investment advisor. The adviser may not transact business in states where it is not appropriately registered, excluded or exempted from registration. Individualized responses to persons that involve either the effecting of transaction in securities, or the rendering of personalized investment advice for compensation, will not be made without registration or exemption.
Mr. Moenning and Heritage Capital Research may at times have positions in the securities referred to and may make purchases or sales of these securities while publications are in circulation. Positions may change at any time.
The analysis provided is based on both technical and fundamental research and is provided "as is" without warranty of any kind, either expressed or implied. Although the information contained is derived from sources which are believed to be reliable, they cannot be guaranteed.
The author neither endorses nor warrants the content of this site, any embedded advertisement, or any linked resource. The author or his managed funds may hold either long or short positions in the referenced securities. Republication rights must be expressly granted by author in writing.
Investments in equities carry an inherent element of risk including the potential for significant loss of principal. Past performance is not an indication of future results.