While I Hate To Sound Like a Broken Record...
Good Monday morning and welcome back. While the bears contend that the market is ripe for a spill, so far at least, sideways appears to be the new down. For example, the S&P 500 has been moving sideways since mid-February and closed Friday just 1.68% off the March 1 all-time high. However, with questions about the Fed's next move, valuations at lofty levels, and some of my favorite long-term indicators waving yellow flags, some caution appears to be warranted. My apologies for sounding like a broken record here, but keep in mind that weakness in the indicators is often a precursor to meaningful corrections. Yet, at the same time, it is important to note that these types of warning signs can often be very early.
But before we get ahead of ourselves, let's start the week with an objective review the key market models and indicators. To review, the primary goal of this exercise (something I do on a daily basis) is to remove any preconceived, subjective notions about the markets and ensure that I stay in line what "is" really happening in the market. So, let's get started...
The State of the Trend
We start each week with a look at the "state of the trend." These indicators are designed to give us a feel for the overall health of the current short- and intermediate-term trend models.
Executive Summary:
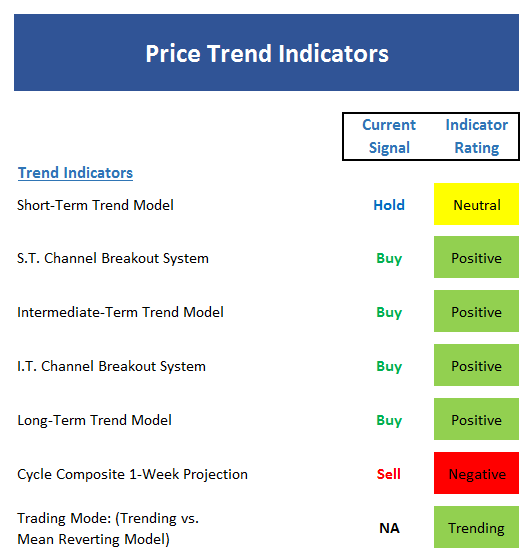
- With stocks having moved sideways since mid-February and the 5-, 10-, 18-, and 39-day smoothings all within 2 points of each other at the present time, this is the definition of neutral.
- While the bands employed by the short-term Channel Breakout System are tightening, the buy signal is still in effect
- The intermediate-term Trend Model has technically moved to the negative zone. A "lower low" on the weekly chart would confirm a negative trend.
- The intermediate-term Channel Breakout System also remains on a buy signal. A close below 2322 would trigger a sell signal.
- The long-term Trend Model remains positive
- The Cycle Composite remains negative for one more week then turns positive
- Our Trading Mode models are currently conflicted, which suggests the market is on the cusp of returning to a mean-reverting mode.
The State of Internal Momentum
Next up are the momentum indicators, which are designed to tell us whether there is any "oomph" behind the current trend...
Executive Summary:
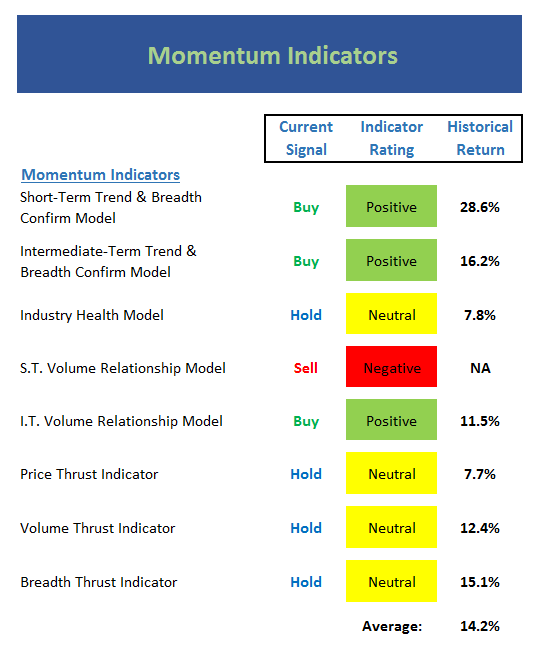
- Our short-term Trend and Breadth Confirm model is currently neutral. However, stocks tend to advance at a decent clip in this mode.
- Our intermediate-term Trend and Breadth Confirm has slipped to negative. Albeit by the smallest of margins.
- No change in our Industry Health Model as the reading remains in the middle of the neutral range.
- The short-term Volume Relationship remains negative and is heading in the wrong direction.
- The intermediate-term Volume Relationship model is positive but the trend of both Demand and Supply Volume are testing important technical levels.
- After recently improving to neutral, the Price Thrust Indicator has slopped back into the negative zone
- The Volume Thrust Indicator remains neutral
- The Breadth Thrust Indicator is also neutral
The State of the "Trade"
We also focus each week on the "early warning" board, which is designed to indicate when traders may start to "go the other way" -- for a trade.
Executive Summary:
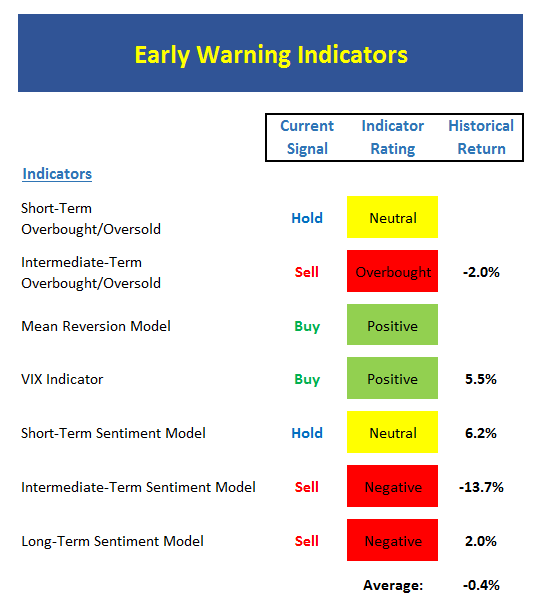
- The market is neither overbought nor oversold at the present time and has worked off the recent oversold condition
- The market has worked off the recent extreme overbought condition and is now rated neutral. However, note that stocks tend to advance at an above average rate in this mode.
- The Mean Reversion Model has struggled with the lack of volatility but remains on the recent buy signal
- The VIX Indicator could also be described as "confused" here. However, the most recent signals from both short- and intermediate-term models were buys
- From a short-term perspective, market sentiment has now moved into a very positive mode for stock prices
- The intermediate-term Sentiment Model has moved from an extreme optimism to neutral - also a plus for prices
- While longer-term Sentiment readings remain a negative, sentiment overall has improved
The State of the Macro Picture
Now let's move on to the market's "external factors" - the indicators designed to tell us the state of the big-picture market drivers including monetary conditions, the economy, inflation, and valuations.
Executive Summary:
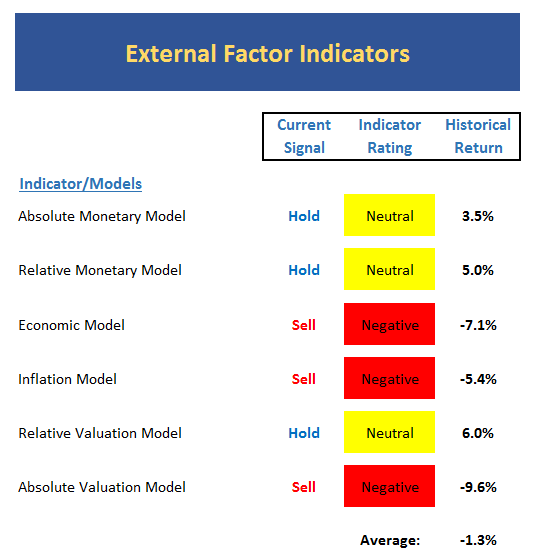
- Absolute Monetary conditions continue to weaken within the model's neutral zone
- But from a relative basis, our Monetary Model is actually improving as rates probe the lower end of the recent trading range
- Our Economic Model (designed to call the stock market) continues to be on the wrong side but is negative
- The Inflation Model is still negative, but is currently flirting with the neutral zone.
- Our Relative Valuation Model continues to weaken as earnings are not rising to the level that rates have risen.
- The Absolute Valuation Model is solidly negative
- Overall, the External Factors board continues to suggest that risk is elevated and some caution is warranted.
The State of the Big-Picture Market Models
Finally, let's review our favorite big-picture market models, which are designed to tell us which team is in control of the prevailing major trend.
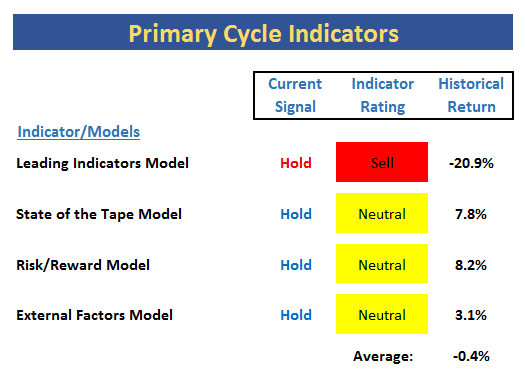
Executive Summary:
- The Leading Indicators model, which did a fine job during the last bear phase remains on a sell signal. This is disconcerting.
- The Tape Model remains neutral at this time
- The Risk/Reward model remains stuck in neutral
- The External Factors model remains on the low end of neutral but has continued to improve in the last few weeks
The Takeaway...
From a purely price trend perspective, it is clear that the stock market is stuck in neutral at this time. This is confirmed by our momentum board. And unfortunately for the bulls, the early warning board does not sport a lot of green at the present time. In addition, our bigger-picture and external factor boards are not encouraging. Thus, the primary message from this week's review is that risk is elevated and caution remains warranted.
Thought For The Day:
Courage is grace under pressure. -Ernest Hemingway
Publishing Note: I am traveling the rest of the week. Thus, reports will be published as my schedule permits.
Current Market Drivers
We strive to identify the driving forces behind the market action on a daily basis. The thinking is that if we can both identify and understand why stocks are doing what they are doing on a short-term basis; we are not likely to be surprised/blind-sided by a big move. Listed below are what we believe to be the driving forces of the current market (Listed in order of importance).
1. The State of the U.S. Economy
2. The State of Trump Administration Policies
3. The State of Global Central Bank Policies
Wishing you green screens and all the best for a great day,

David D. Moenning
Chief Investment Officer
Sowell Management Services
Looking for a "Modern" approach to Asset Allocation and Portfolio Design?
Looking for More on the State of the Markets?
Investment Pros: Looking to modernize your asset allocations, add risk management to client portfolios, or outsource portfolio Management? Contact Eric@SowellManagement.com
Disclosures
The opinions and forecasts expressed herein are those of Mr. David Moenning and may not actually come to pass. Mr. Moenning's opinions and viewpoints regarding the future of the markets should not be construed as recommendations. The analysis and information in this report is for informational purposes only. No part of the material presented in this report is intended as an investment recommendation or investment advice. Neither the information nor any opinion expressed constitutes a solicitation to purchase or sell securities or any investment program.
Any investment decisions must in all cases be made by the reader or by his or her investment adviser. Do NOT ever purchase any security without doing sufficient research. There is no guarantee that the investment objectives outlined will actually come to pass. All opinions expressed herein are subject to change without notice. Neither the editor, employees, nor any of their affiliates shall have any liability for any loss sustained by anyone who has relied on the information provided.
The analysis provided is based on both technical and fundamental research and is provided "as is" without warranty of any kind, either expressed or implied. Although the information contained is derived from sources which are believed to be reliable, they cannot be guaranteed.
David D. Moenning is an investment adviser representative of Sowell Management Services, a registered investment advisor. For a complete description of investment risks, fees and services, review the firm brochure (ADV Part 2) which is available by contacting Sowell. Sowell is not registered as a broker-dealer.
Employees and affiliates of Sowell may at times have positions in the securities referred to and may make purchases or sales of these securities while publications are in circulation. Positions may change at any time.
Investments in equities carry an inherent element of risk including the potential for significant loss of principal. Past performance is not an indication of future results.
Advisory services are offered through Sowell Management Services.