A "Good" Overbought Condition?
Good Morning. Since it's Wednesday, it's time to review our Early Warning indicator boards, which are designed to suggest when "the table might be set" for the trend to "go the other way" for a while.
Our Review Process: We start each week by identifying the state of the big-picture environment. We then review the current trend and the degree of momentum behind the move. Next, we look at the potential for a countertrend move to develop.
My Current Take...
For the past couple weeks, I've noted that the Early Warning board was a mixed bag that didn't provide either team with much of an edge from a near-term perspective. Although I wouldn't call the current weight of the evidence "table pounding," I do believe the board is edging its way toward the bear camp.
If you look closely at the indicator rating gauges, the point becomes clear. While the indicators are not universally negative, they are certainly within spitting distance of their respective red zones. As such, I would not be surprised to see the bears try to make a run in the coming days. From my seat, this is especially true given that (a) we are now in the heat of earnings season and (b) the megacap COVID leaders (think FANMAG and friends) could certainly use a rest.
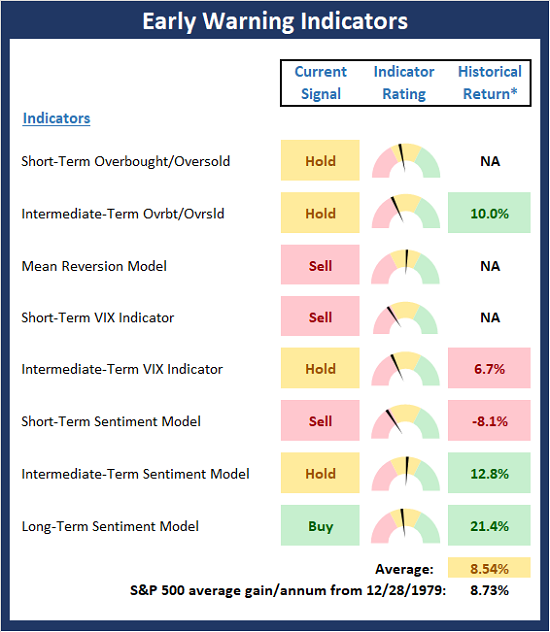
* Source: Ned Davis Research (NDR) as of the date of publication. Historical returns are hypothetical average annual performances calculated by NDR. Past performances do not guarantee future results or profitability - NOT INDIVIDUAL INVESTMENT ADVICE.
View Early Warning Indicator Board Online
Stochastic Review
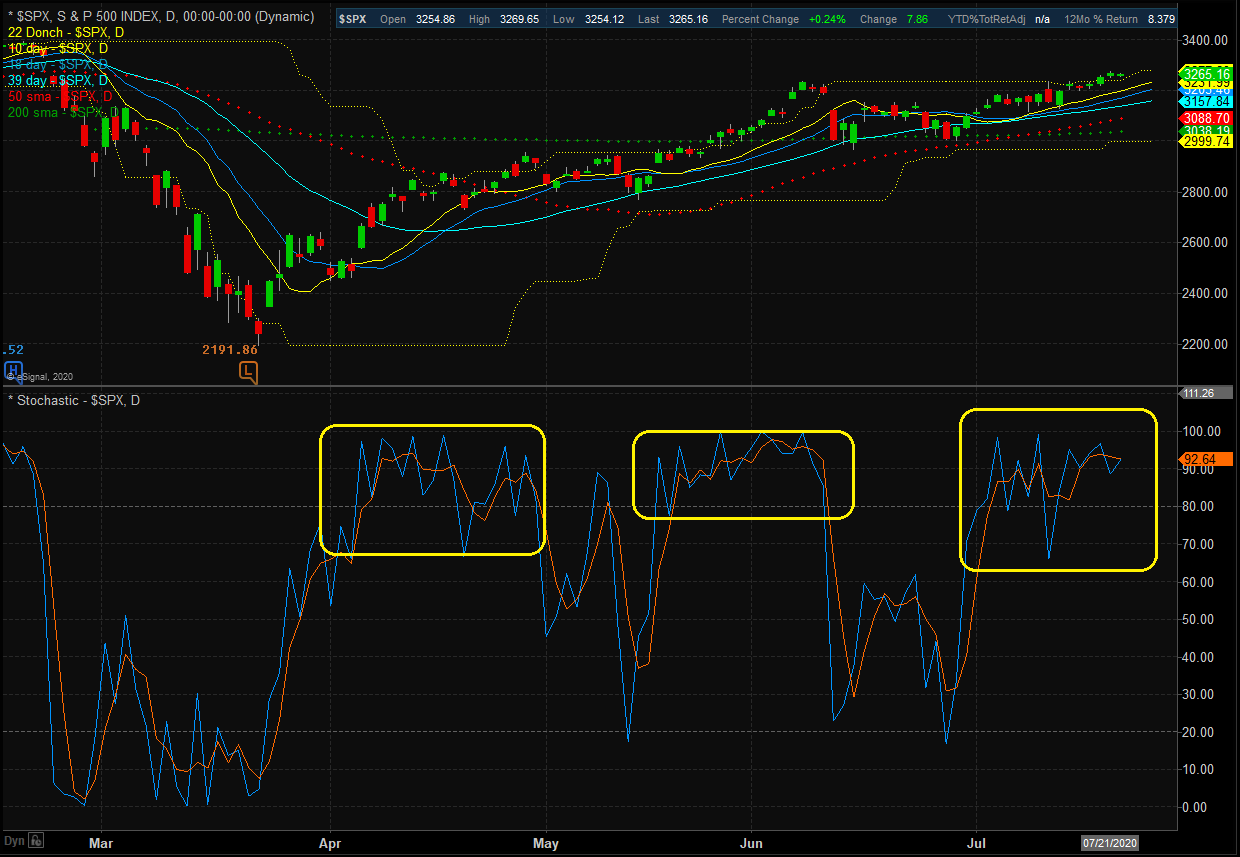
Over the years, I have found that reviewing the basic stochastics is a solid way to determine when an index or security may be ripe to "go the other way" for a while. I like to keep it simple here by using a 14 day %K (with 1-day smoothing) and a 3 day %D. It's not fancy, but it tends to be an effective tool for an oftentimes complex subject.
S&P 500 - Daily
View Larger Chart
As I wrote last week, it is clear the stochastics remain in overbought territory. Yet at the same time, I'll continue to argue that we've likely got a "good overbought" condition on our hands.
To review, while a traditional overbought condition tends to lead to countertrend moves down, a "good overbought" condition occurs when a market "gets overbought and stays overbought." Another key to this condition is when the stochastics mean revert, they don't stay oversold for long. This tells us that dip buyers are active and are using any/all pullbacks to acquire equities.
So, what I believe am seeing here is a "rally continuation" sign, which tells me to #BuyTheDips when weakness develops.
Thought For The Day:
To others, being wrong is a source of shame; to me, recognizing my mistakes is a source of pride. -George Soros
Publishing Note: My wife and I will be road tripping cross country for the next week to help out with family. As such, I will not publish reports until we return.
Wishing you green screens and all the best for a great day,

David D. Moenning
Founder, Chief Investment Officer
Heritage Capital Research

Disclosures
At the time of publication, Mr. Moenning held long positions in the following securities mentioned: None - Note that positions may change at any time.
Early Warning Models Explained
Short-Term Overbought/sold Indicator: This indicator is the current reading of the 14,1,3 stochastic oscillator. When the oscillator is above 80 and the %K is above the %D, the indicator gives an overbought reading. Conversely, when the oscillator is below 20 and %K is below its %D, the indicator is oversold.
Intermediate-Term Overbought/sold Indicator: This indicator is a 40-day RSI reading. When above 57.5, the indicator is considered overbought and wnen below 45 it is oversold.
Mean Reversion Model: This is a diffusion model consisting of five indicators that can produce buy and sell signals based on overbought/sold conditions.
VIX Indicator: This indicators looks at the current reading of the VIX relative to a series of Donchian Channel bands. When the indicator reaches an extreme reading in either direction, it is an indication that a market trend could reverse in the near-term.
Short-Term Sentiment Indicator: This is a model-of-models composed of 18 independent sentiment indicators designed to indicate when market sentiment has reached an extreme from a short-term perspective. Historical analysis indicates that the stock market's best gains come after an environment has become extremely negative from a sentiment standpoint. Conversely, when sentiment becomes extremely positive, market returns have been subpar.
Intermediate-Term Sentiment Indicator: This is a model-of-models composed of 7 independent sentiment indicators designed to indicate when market sentiment has reached an extreme from a intermediate-term perspective. Historical analysis indicates that the stock market's best gains come after an environment has become extremely negative from a sentiment standpoint. Conversely, when sentiment becomes extremely positive, market returns have been subpar.
Long-Term Sentiment Indicator: This is a model-of-models composed of 6 independent sentiment indicators designed to indicate when market sentiment has reached an extreme from a long-term perspective. Historical analysis indicates that the stock market's best gains come after an environment has become extremely negative from a sentiment standpoint. Conversely, when sentiment becomes extremely positive, market returns have been subpar.
NOT INVESTMENT ADVICE. The opinions and forecasts expressed herein are those of Mr. David Moenning and Heritage Capital Research and may not actually come to pass. The opinions and viewpoints regarding the future of the markets should not be construed as recommendations. The analysis and information in this report is for informational purposes only. No part of the material presented in this report is intended as an investment recommendation or investment advice. Neither the information nor any opinion expressed constitutes a solicitation to purchase or sell securities or any investment program.
Any investment decisions must in all cases be made by the reader or by his or her investment adviser. Do NOT ever purchase any security without doing sufficient research. There is no guarantee that the investment objectives outlined will actually come to pass. All opinions expressed herein are subject to change without notice. Neither the editor, employees, nor any of their affiliates shall have any liability for any loss sustained by anyone who has relied on the information provided.
Mr. Moenning of Heritage Capital Research is an investment adviser representative of Eastsound Capital Advisors, LLC, a registered investment advisor. The adviser may not transact business in states where it is not appropriately registered, excluded or exempted from registration. Individualized responses to persons that involve either the effecting of transaction in securities, or the rendering of personalized investment advice for compensation, will not be made without registration or exemption.
Mr. Moenning and Heritage Capital Research may at times have positions in the securities referred to and may make purchases or sales of these securities while publications are in circulation. Positions may change at any time.
The analysis provided is based on both technical and fundamental research and is provided "as is" without warranty of any kind, either expressed or implied. Although the information contained is derived from sources which are believed to be reliable, they cannot be guaranteed.
The author neither endorses nor warrants the content of this site, any embedded advertisement, or any linked resource. The author or his managed funds may hold either long or short positions in the referenced securities. Republication rights must be expressly granted by author in writing.
Investments in equities carry an inherent element of risk including the potential for significant loss of principal. Past performance is not an indication of future results.