A Reason To Favor The Bulls
Although the S&P 500 remains 8.4% higher than the post-BREXIT panic low seen on June 27, there can be little arguing the fact that the rally has stalled out over the last week or so. After blasting 8.2% in just 12 trading session, both the Dow and S&P have moved mostly sideways since July 26.
The reasons for the pause are certainly understandable. There is the fact that the indices have become overbought from both a short- and intermediate-term time frame. There is the fact the Japanese appear to be backing off the coordinated the degree of stimulus markets had been hoping for. There is the fact that the latest data on the British economy isn't pretty. There is the fact that oil is moving the wrong direction again (the USO ETF has lost -18.5% since June 8). There is the earnings season. And then there is this week's meetings of the FOMC to consider.
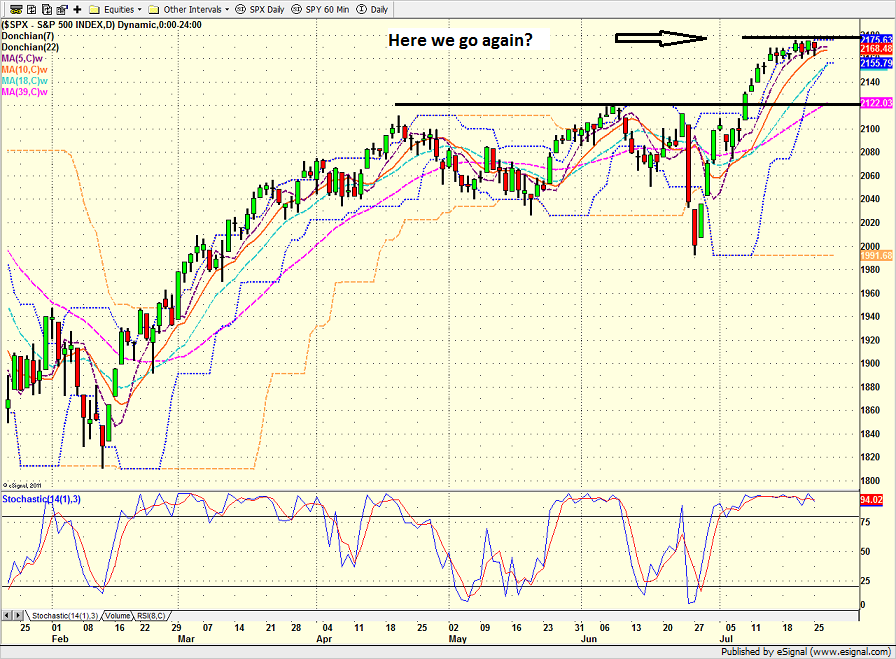
When taken collectively, these issues are clearly enough for traders to press pause - at least for a while. As the chart below shows, it appears that a new ceiling might be developing from a short-term perspective.
S&P 500 - Daily 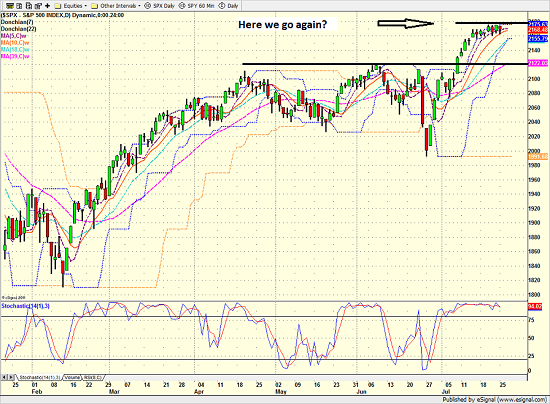
View Larger Image
However, none of the above appears to be a reason for energetic selling at this time as the Dow closed Monday just 102 - or 0.55% - off the most recent all-time high.
So, should we be worried? Is it time for traders to start using their trading range strategies again? Will the bears quickly resume control and turn the breakout into the latest fake-out?
Cutting to the chase, I don't think so.
Focus on the Big Picture
Last week, I had the honor of speaking to a group of CEOs in Beaver Creek, CO. The topic of my talk was the current "state" of the economy and the markets. During my time with the group, I opined that today's stock market is largely driven by computer algorithms and that intraday volatility is higher than in times past. As such, I encouraged the group to simply ignore the shorter-term machinations in the stock market and to pay attention to the big picture.
I said that for me, this means we should be focusing not on the anticipated pullback in stocks, but rather on the fact that stocks have entered a new bull market. I explained that moves to new all-time highs after a long period of sideways consolidation tended to be very bullish and reviewed the history of bull markets in the U.S. stock market.
I suggested that investors should recognize that while anything can happen in the weeks following an overbought condition, history clearly favors the bulls here.
Specifically, I pointed to a study of the S&P 500 results after a long sideways consolidation period. I said that after the S&P had moved to a new all-time high following a consolidation phase lasting at least 300 calendar days, the odds of making money in the stock market was quite strong.
According to the computers at Ned Davis Research, the odds of the S&P 500 being higher one month after the new all-time high have been 70% since 1933 and that the average gain one month later was 1.75% (which is significantly higher than the average one-month gain of 0.63%). The odds of a gain three months later have been 74% (with average gains of 3.86% vs. 2.25% for all three-month periods). The odds of a gain six months later have been 83% (with average gains of 8.20% vs. 3.795% for all six-month periods). And the odds of a gain twelve months later have been 91% (with average gains of 15.87% vs. 8.68% for all twelve-month periods).
I also noted that since 1949, the odds of stocks being higher six and twelve months after breaking out of a long, sideways consolidation phase have been 94% and 100% respectively and that the losing periods occurred during secular bear markets.
So, I opined, if one believes that stocks are currently in a secular bull market, it is hard to be overly negative on the intermediate- and/or long-term view.
Sure, anything can happen in the near-term. And yes, the bears could certainly use the decline in oil, any given earnings report, or a central bank headline as a signal to sell stocks here. However, given the historic breadth thrusts seen and the history behind moves such as we're seeing now, I believe this is a time to give the bulls the benefit of any doubt for a while.
Current Market Drivers
We strive to identify the driving forces behind the market action on a daily basis. The thinking is that if we can both identify and understand why stocks are doing what they are doing on a short-term basis; we are not likely to be surprised/blind-sided by a big move. Listed below are what we believe to be the driving forces of the current market (Listed in order of importance).
1. The State of Global Central Bank Policies
2. The State of the Earnings Season
3. The State of U.S. Economic Growth
4. The State of Oil Prices
Thought For The Day:
"Your character is what you really are; your reputation is merely what people think you are." --John Wooden
Here's wishing you green screens and all the best for a great day,

David D. Moenning
Founder: Heritage Capital Research
Chief Investment Officer: Sowell Management Services
Looking for More on the State of the Markets?
Disclosures
The opinions and forecasts expressed herein are those of Mr. David Moenning and may not actually come to pass. Mr. Moenning's opinions and viewpoints regarding the future of the markets should not be construed as recommendations. The analysis and information in this report is for informational purposes only. No part of the material presented in this report is intended as an investment recommendation or investment advice. Neither the information nor any opinion expressed constitutes a solicitation to purchase or sell securities or any investment program.
Any investment decisions must in all cases be made by the reader or by his or her investment adviser. Do NOT ever purchase any security without doing sufficient research. There is no guarantee that the investment objectives outlined will actually come to pass. All opinions expressed herein are subject to change without notice. Neither the editor, employees, nor any of their affiliates shall have any liability for any loss sustained by anyone who has relied on the information provided.
The analysis provided is based on both technical and fundamental research and is provided "as is" without warranty of any kind, either expressed or implied. Although the information contained is derived from sources which are believed to be reliable, they cannot be guaranteed.
David D. Moenning is an investment adviser representative of Sowell Management Services, a registered investment advisor. For a complete description of investment risks, fees and services, review the firm brochure (ADV Part 2) which is available by contacting Sowell. Sowell is not registered as a broker-dealer.
Employees and affiliates of Sowell may at times have positions in the securities referred to and may make purchases or sales of these securities while publications are in circulation. Positions may change at any time.
Investments in equities carry an inherent element of risk including the potential for significant loss of principal. Past performance is not an indication of future results.
Advisory services are offered through Sowell Management Services.