Assuming Away The Can And...
There is an old joke which pokes fun at economists that I think applies to the current state of the stock market. It goes something like this...
An economist, a chemist, and a physicist are stranded on an island with nothing to eat but a can of beans.
The chemist says, "Hey, there's a small tide pool of salt water over there. If we set the can in it the salinity will cause the can to rust/disintegrate and we can eat the beans."
The physicist laughed and said, "You moron, by the time the salt eats through the can, we will have died of hunger. We must make a fire with that dried grass and wood over there. We can heat the can until the pressure builds and it will explode, allowing us to eat the beans."
At this, the economist laughed, "You're a moron too, if the can explodes, the beans will shoot everywhere and we'll have none to eat." So, the physicist and the chemist, both tired and hungry asked, "Ok, if you know what to do, please tell us."
To which the economist replied, "It's simple really, we assume away the can and eat the beans."
Putting this into context, I feel like the stock market is assuming away the virus, the likely protracted damage to the economy and industries, and simply looking ahead to better days. You know, when things get back to normal.
How else can we "esplain" the fact that the S&P 500 was down less than 10% on the year at the end of April? Or that the QQQ actually sported a GAIN of +3% in 2020 as of the end of last month.
This despite the reality that until a vaccine/drug therapy is widely distributed to the populations of the world, consumers are simply NOT going back to what had been considered normal a few short months ago.
Expectations V. Reality (Again)
Yes, I know that stocks look ahead. And that typically the stock market tends to "discount" expectations of what will transpire six to nine months ahead. And yes, I agree that science is likely to come up with a solution in that time frame. And that stocks tend to "sniff out" a turn in these situations before the news is actually out. Which in this case would be the vaccine/drug therapy solution. And we definitely got some good news on the science front this week from Oxford, Pfizer (PFE), Gilead (GILD), and others. Thus, I must agree that a rally in stocks makes sense here.
But the question is, how long will it take for the economy to "re-open" and more importantly, get back to normal? While this can likely be placed in the "duh" category, my thought is it will be much longer than six or nine months before the majority of the 7.5 billion people who call planet Earth home will be vaccinated.
There is also the narrative that the current joyride to upside is being driven by the hope related to the economies of the world beginning to re-open. To be sure, this is good news. News that will put a floor under the amount of economic damage that will be done. Couple this with the "floor" that the Fed and Congress have pledged to provide and the idea that some semblance of normalcy is about to return is good news indeed.
Yet, a pesky little detail in the current re-opening scheme is that social distancing rules must remain in place until that vaccine is widely distributed in order to try and keep as many people safe as possible. And it is important to remember that restaurants and shops will have limited capacity. For example, with restaurants, this means 25% of "normal."
But how does 25% capacity work for a restaurant's bottom line? Some will be creative and move to an online ordering/delivery model in an attempt to move back toward the old normal revenue streams. Others will be lucky enough to move tables/sales racks outside.
And if there is anything that Corporate America is good at, it's finding creative ways to make money. As Warren Buffett noted this weekend, "nothing can basically stop America."
So, as a card-carrying member of the-glass-is-at-least-half-full club (a club whose membership roles have also been dropping lately), I "get" why stocks deserved to rally. However, I don't really "get" how stocks can rally much further from here. Can the outlook for the companies that make up the QQQ really be better than they were on January 1st?
I also see some serious divergences between the "messages" coming from the NASDAQ/S&P 500, small caps, and the bond market.
A Tale of Two (or Three) Markets
In my humble opinion, the message from the bond market is currently wildly divergent from the stock market. While the S&P 500 and the Q's are looking hopeful, the yield on the U.S. 10-Year remains near its panic-induced nadir seen in early March.
US 10-Year T-Note Yield - Weekly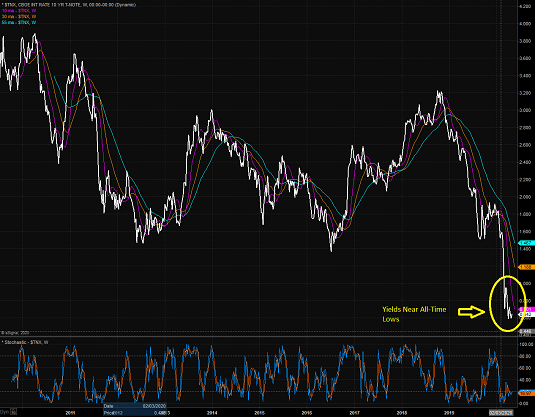
View Larger Chart
And from my seat, the messaging from bond market tends to be a lot less emotional than that of the stock market, and again, from my point of view, more closely correlates to the state of the economy.
In short, bond traders are not looking at growth and/or inflation ANY TIME soon. And with rates near all-time lows, one can argue that the bonds remain worried.
The message from small caps also appears to diverge greatly from that of the winners in the stock market (aka the QQQ). The two charts below make the point abundantly clear.
Invesco QQQ Trust (QQQ) - Weekly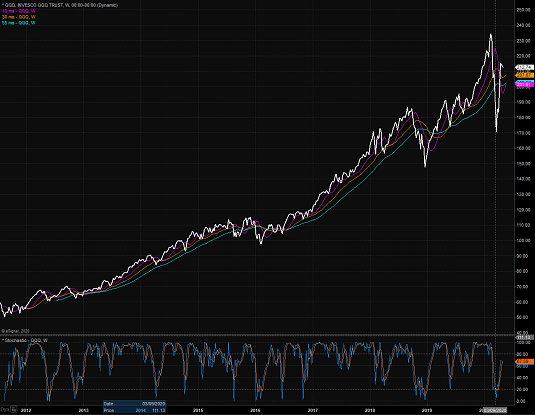
View Larger Chart
iShares S&P Small-Cap Fund (IJR) - Weekly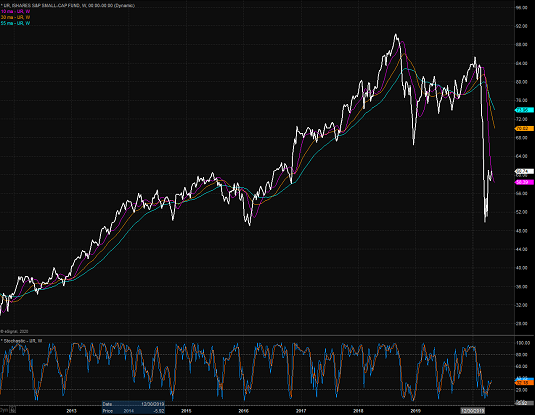
View Larger Chart
While the QQQ is lucky enough to house the COVID darlings such as AMZN, MSFT, NFLX, ADBE, NVDA, AAPL, GILD, CTXS, SHOP, and AKAM, the small-caps are dominated by companies such as banks and oils, whose futures are, well, less rosy. As such, the "messages" from these two charts are quite different.
When a ginormous divergence such as we're seeing here exists, one of two things tends to happen. Either the areas beaten down and lagging experience a reversion to the mean and improve, or the areas that are leading stall out.
But in this case, it is hard to see how this divergence is going to correct itself in the near term. For example, I own a bunch of COVID darlings. And no, I don't plan on selling any of them anytime soon in favor of energy stocks, airlines, hotels or banks! (Although I did start nibbling at Bank America - BAC - last week.)
In closing, I guess my point is that while I understand that there are many strong reasons for hope and that America WILL win out, I also believe the win (i.e. a return to pre-COVID growth) is going to take a while (many respected analysts are talking a couple years). As such, I'm not sure just assuming away the recovery process is appropriate in the near-term.
However, I'd love to be wrong and see the stock market in the black by the end of the year!
Weekly Market Model Review
Each week we do a disciplined, deep dive into our key market indicators and models. The overall goal of this exercise is to (a) remove emotion from the investment process, (b) stay "in tune" with the primary market cycles, and (c) remain cognizant of the risk/reward environment.
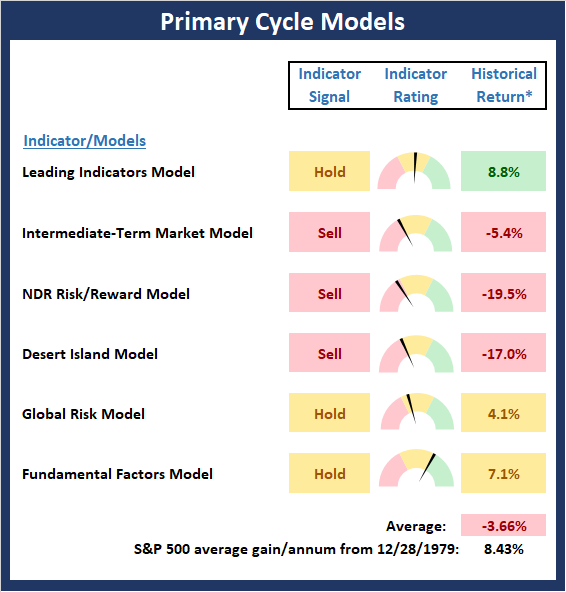
The Major Market Models
We start with six of our favorite long-term market models. These models are designed to help determine the "state" of the overall market.
There are three changes to report on the Primary Cycle board this week. But first, it is worth noting that there are no longer any buy signals on the board and that the historical return of the S&P 500 when the models are in their current states has is now negative at -3.66%. The first change was the NDR Risk/Reward Model moving from neutral to negative. On the other side of the coin, the Global Risk Model upticked into the neutral zone. And finally, our Fundamental model slipped from positive to neutral. So, unless there is a medical breakthrough in the near-term, it is probably best to curb one's enthusiasm about the upside potential of the stock market.
* Source: Ned Davis Research (NDR) as of the date of publication. Historical returns are hypothetical average annual performances calculated by NDR. Past performances do not guarantee future results or profitability - NOT INDIVIDUAL INVESTMENT ADVICE.
View My Favorite Market Models Online
The State of the Fundamental Backdrop
Next, we review the market's fundamental factors in the areas of interest rates, the economy, inflation, and valuations.
There are no changes to the Fundamental Factors board this week. Overall, the board remains on the high side of neutral with an historical average return below the market's mean. But, as I've been saying, the Economic Composite is clearly out of sync with reality as most of the indicators are longer-term and only updated monthly and/or quarterly. The same can be said for the Earning Composite. So, I think it is safe to say that the fundamentals suggest that risk remains elevated.
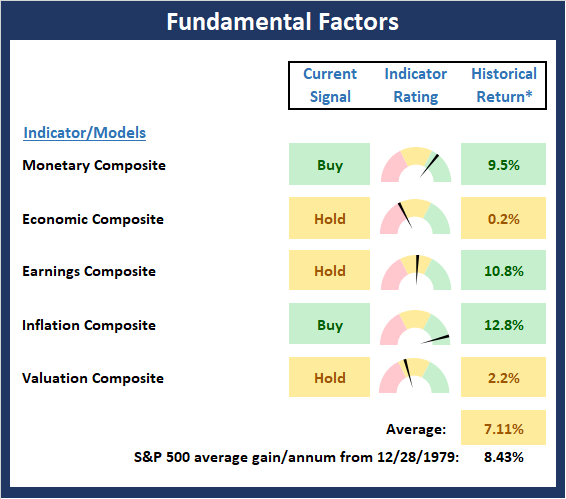
* Source: Ned Davis Research (NDR) as of the date of publication. Historical returns are hypothetical average annual performances calculated by NDR. Past performances do not guarantee future results or profitability - NOT INDIVIDUAL INVESTMENT ADVICE.
View Fundamental Indicator Board Online
The State of the Trend
After looking at the big-picture models and the fundamental backdrop, I like to look at the state of the trend. This board of indicators is designed to tell us about the overall technical health of the current trend.
There are no changes to the Trend board this week. And while the market enjoyed serious joyride to the upside in April, the trend indicators suggest that all is not well. This would appear to support the theme that stocks have decoupled from economic reality at this stage and may have a little too much "hope" priced into the indices.

NOT INDIVIDUAL INVESTMENT ADVICE.
View Trend Indicator Board Online
The State of Internal Momentum
Next, we analyze the "oomph" behind the current trend via our group of market momentum indicators/models.
When compared to last week's readings, it appears that there was some slippage on the Momentum Board. While the Short-Term Trend & Breadth Confirm model upticked to a buy, both the Volume and Breadth Thrust indicators fell from positive to neutral. The good news for the bull camp is that the market still has some "mo" behind it. So, if our heroes in horns can stave off the current bear attack, momentum could carry stocks higher - especially in the small- and mid-cap areas.
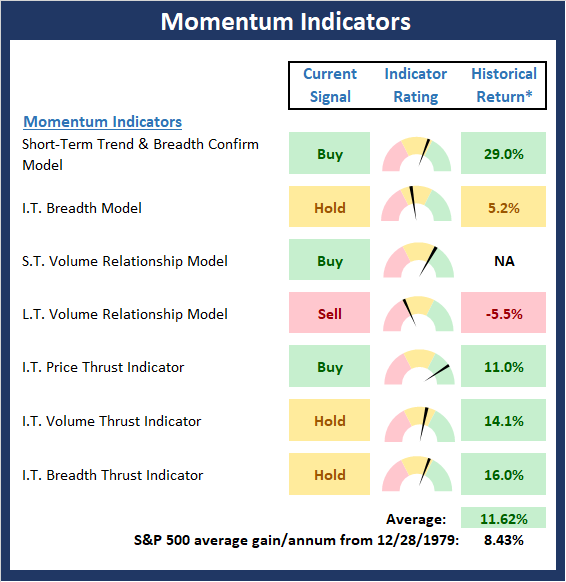
* Source: Ned Davis Research (NDR) as of the date of publication. Historical returns are hypothetical average annual performances calculated by NDR. Past performances do not guarantee future results or profitability - NOT INDIVIDUAL INVESTMENT ADVICE.
View Momentum Indicator Board Online
Early Warning Signals
Once we have identified the current environment, the state of the trend, and the degree of momentum behind the move, we then review the potential for a counter-trend move to begin. This batch of indicators is designed to suggest when the table is set for the trend to "go the other way."
The bad news is the Early Warning board is now lining up for the bears. While two of the three sentiment models continue to suggest that there is still too much negativity in the market, the rest of the board argues that the table is now set nicely for a reversal. As such, some downside testing would not be surprising in the near-term.
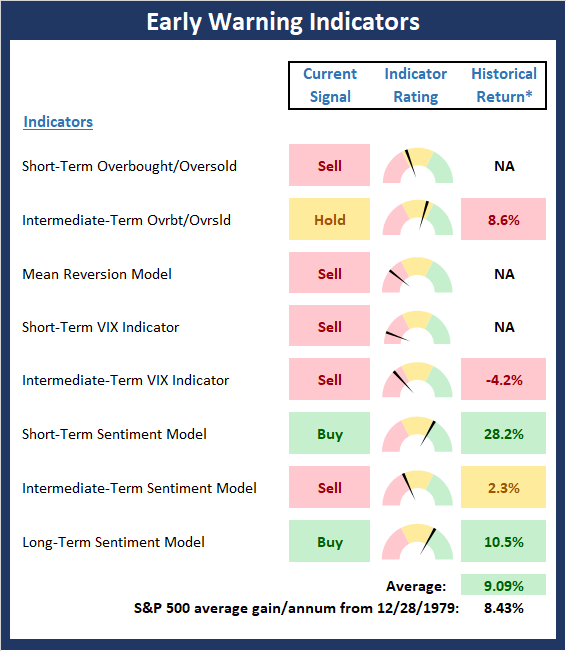
* Source: Ned Davis Research (NDR) as of the date of publication. Historical returns are hypothetical average annual performances calculated by NDR. Past performances do not guarantee future results or profitability - NOT INDIVIDUAL INVESTMENT ADVICE.
View Early Warning Indicator Board Online
Thought For The Day:
Character is much easier kept than recovered. -Thomas Paine
Wishing you green screens and all the best for a great day,

David D. Moenning
Founder, Chief Investment Officer
Heritage Capital Research

Disclosures
At the time of publication, Mr. Moenning held long positions in the following securities mentioned: AMZN, MSFT, NFLX, ADBE, NVDA, AAPL, QQQ, IJR, PFE - Note that positions may change at any time.
Leading Indicators Model: A group of indicators that have historically shown tendencies to lead the market at major turning points.
Intermediate-Term Market Model: A composite model (model of models) focused on trend and momentum indicators which has been designed to provide identify intermediate-term trading opportunities.
Risk/Reward Model: A model-of-models intended to provide an overall view of the state of the risk/reward environment. The model includes tape, monetary, and sentiment indicators as well as 7 big-picture market model readings.
Desert Island Model: If I was stranded on a desert island with access to only one market model to manage money with, this would be the model. The model is a comprehensive model-of-models comprised of trend, momentum, mean reversion, economic, monetary, sentiment, and factor-based indicators/models.
External Factors Model: A model-of-models designed to provide a reading on the "macro state" of the market environment. The model is comprised of indicators/models in the areas of various index yields, industrial production, investors sentiment, and historic volatility.
Short-Term Trend-and-Breadth Signal Explained: History shows the most reliable market moves tend to occur when the breadth indices are in gear with the major market averages. When the breadth measures diverge, investors should take note that a trend reversal may be at hand. This indicator incorporates NDR's All-Cap Dollar Weighted Equity Series and A/D Line. From 1998, when the A/D line is above its 5-day smoothing and the All-Cap Equal Weighted Equity Series is above its 25-day smoothing, the equity index has gained at a rate of +32.5% per year. When one of the indicators is above its smoothing, the equity index has gained at a rate of +13.3% per year. And when both are below, the equity index has lost +23.6% per year.
Channel Breakout System Explained: The short-term and intermediate-term Channel Breakout Systems are modified versions of the Donchian Channel indicator. According to Wikipedia, "The Donchian channel is an indicator used in market trading developed by Richard Donchian. It is formed by taking the highest high and the lowest low of the last n periods. The area between the high and the low is the channel for the period chosen."
Intermediate-Term Trend-and-Breadth Signal Explained: This indicator incorporates NDR's All-Cap Dollar Weighted Equity Series and A/D Line. From 1998, when the A/D line is above its 45-day smoothing and the All-Cap Equal Weighted Equity Series is above its 45-day smoothing, the equity index has gained at a rate of +17.6% per year. When one of the indicators is above its smoothing, the equity index has gained at a rate of +6.5% per year. And when both are below, the equity index has lost -1.3% per year.
Cycle Composite Projections: The cycle composite combines the 1-year Seasonal, 4-year Presidential, and 10-year Decennial cycles. The indicator reading shown uses the cycle projection for the upcoming week.
Trading Mode Indicator: This indicator attempts to identify whether the current trading environment is "trending" or "mean reverting." The indicator takes the composite reading of the Efficiency Ratio, the Average Correlation Coefficient, and Trend Strength models.
Volume Relationship Models: These models review the relationship between "supply" and "demand" volume over the short- and intermediate-term time frames.
Price Thrust Model Explained: This indicator measures the 3-day rate of change of the Value Line Composite relative to the standard deviation of the 30-day average. When the Value Line's 3-day rate of change have moved above 0.5 standard deviation of the 30-day average ROC, a "thrust" occurs and since 2000, the Value Line Composite has gained ground at a rate of +20.6% per year. When the indicator is below 0.5 standard deviation of the 30-day, the Value Line has lost ground at a rate of -10.0% per year. And when neutral, the Value Line has gained at a rate of +5.9% per year.
Volume Thrust Model Explained: This indicator uses NASDAQ volume data to indicate bullish and bearish conditions for the NASDAQ Composite Index. The indicator plots the ratio of the 10-day total of NASDAQ daily advancing volume (i.e., the total volume traded in stocks which rose in price each day) to the 10-day total of daily declining volume (volume traded in stocks which fell each day). This ratio indicates when advancing stocks are attracting the majority of the volume (readings above 1.0) and when declining stocks are seeing the heaviest trading (readings below 1.0). This indicator thus supports the case that a rising market supported by heavier volume in the advancing issues tends to be the most bullish condition, while a declining market with downside volume dominating confirms bearish conditions. When in a positive mode, the NASDAQ Composite has gained at a rate of +38.3% per year, When neutral, the NASDAQ has gained at a rate of +13.3% per year. And when negative, the NASDAQ has lost at a rate of -15.49% per year.
Breadth Thrust Model Explained: This indicator uses the number of NASDAQ-listed stocks advancing and declining to indicate bullish or bearish breadth conditions for the NASDAQ Composite. The indicator plots the ratio of the 10-day total of the number of stocks rising on the NASDAQ each day to the 10-day total of the number of stocks declining each day. Using 10-day totals smooths the random daily fluctuations and gives indications on an intermediate-term basis. As expected, the NASDAQ Composite performs much better when the 10-day A/D ratio is high (strong breadth) and worse when the indicator is in its lower mode (weak breadth). The most bullish conditions for the NASDAQ when the 10-day A/D indicator is not only high, but has recently posted an extreme high reading and thus indicated a thrust of upside momentum. Bearish conditions are confirmed when the indicator is low and has recently signaled a downside breadth thrust. In positive mode, the NASDAQ has gained at a rate of +22.1% per year since 1981. In a neutral mode, the NASDAQ has gained at a rate of +14.5% per year. And when in a negative mode, the NASDAQ has lost at a rate of -6.4% per year.
Short-Term Overbought/sold Indicator: This indicator is the current reading of the 14,1,3 stochastic oscillator. When the oscillator is above 80 and the %K is above the %D, the indicator gives an overbought reading. Conversely, when the oscillator is below 20 and %K is below its %D, the indicator is oversold.
Intermediate-Term Overbought/sold Indicator: This indicator is a 40-day RSI reading. When above 57.5, the indicator is considered overbought and wnen below 45 it is oversold.
Mean Reversion Model: This is a diffusion model consisting of five indicators that can produce buy and sell signals based on overbought/sold conditions.
VIX Indicator: This indicators looks at the current reading of the VIX relative to standard deviation bands. When the indicator reaches an extreme reading in either direction, it is an indication that a market trend could reverse in the near-term.
Short-Term Sentiment Indicator: This is a model-of-models composed of 18 independent sentiment indicators designed to indicate when market sentiment has reached an extreme from a short-term perspective. Historical analysis indicates that the stock market's best gains come after an environment has become extremely negative from a sentiment standpoint. Conversely, when sentiment becomes extremely positive, market returns have been subpar.
Intermediate-Term Sentiment Indicator: This is a model-of-models composed of 7 independent sentiment indicators designed to indicate when market sentiment has reached an extreme from a intermediate-term perspective. Historical analysis indicates that the stock market's best gains come after an environment has become extremely negative from a sentiment standpoint. Conversely, when sentiment becomes extremely positive, market returns have been subpar.
Long-Term Sentiment Indicator: This is a model-of-models composed of 6 independent sentiment indicators designed to indicate when market sentiment has reached an extreme from a long-term perspective. Historical analysis indicates that the stock market's best gains come after an environment has become extremely negative from a sentiment standpoint. Conversely, when sentiment becomes extremely positive, market returns have been subpar.
Absolute Monetary Model Explained: The popular cliche, "Don't fight the Fed" is really a testament to the profound impact that interest rates and Fed policy have on the market. It is a proven fact that monetary conditions are one of the most powerful influences on the direction of stock prices. The Absolute Monetary Model looks at the current level of interest rates relative to historical levels and Fed policy.
Relative Monetary Model Explained: The "relative" monetary model looks at monetary indicators relative to recent levels as well as rates of change and Fed Policy.
Economic Model Explained: During the middle of bull and bear markets, understanding the overall health of the economy and how it impacts the stock market is one of the few truly logical aspects of the stock market. When our Economic model sports a "positive" reading, history (beginning in 1965) shows that stocks enjoy returns in excess of 21% per year. Yet, when the model's reading falls into the "negative" zone, the S&P has lost nearly -25% per year. However, it is vital to understand that there are times when good economic news is actually bad for stocks and vice versa. Thus, the Economic model can help investors stay in tune with where we are in the overall economic cycle.
Inflation Model Explained: They say that "the tape tells all." However, one of the best "big picture" indicators of what the market is expected to do next is inflation. Simply put, since 1962, when the model indicates that inflationary pressures are strong, stocks have lost ground. Yet, when inflationary pressures are low, the S&P 500 has gained ground at a rate in excess of 13%. The bottom line is inflation is one of the primary drivers of stock market returns.
Valuation Model Explained: If you want to get analysts really riled up, you need only to begin a discussion of market valuation. While the question of whether stocks are overvalued or undervalued appears to be a simple one, the subject is actually extremely complex. To simplify the subject dramatically, investors must first determine if they should focus on relative valuation (which include the current level of interest rates) or absolute valuation measures (the more traditional readings of Price/Earnings, Price/Dividend, and Price/Book Value). We believe that it is important to recognize that environments change. And as such, the market's focus and corresponding view of valuations are likely to change as well. Thus, we depend on our Valuation Models to help us keep our eye on the ball.
Disclosures
NOT INVESTMENT ADVICE. The opinions and forecasts expressed herein are those of Mr. David Moenning and Heritage Capital Research and may not actually come to pass. The opinions and viewpoints regarding the future of the markets should not be construed as recommendations. The analysis and information in this report is for informational purposes only. No part of the material presented in this report is intended as an investment recommendation or investment advice. Neither the information nor any opinion expressed constitutes a solicitation to purchase or sell securities or any investment program.
Any investment decisions must in all cases be made by the reader or by his or her investment adviser. Do NOT ever purchase any security without doing sufficient research. There is no guarantee that the investment objectives outlined will actually come to pass. All opinions expressed herein are subject to change without notice. Neither the editor, employees, nor any of their affiliates shall have any liability for any loss sustained by anyone who has relied on the information provided.
Mr. Moenning of Heritage Capital Research is an investment adviser representative of Eastsound Capital Advisors, LLC, a registered investment advisor. The adviser may not transact business in states where it is not appropriately registered, excluded or exempted from registration. Individualized responses to persons that involve either the effecting of transaction in securities, or the rendering of personalized investment advice for compensation, will not be made without registration or exemption.
Mr. Moenning and Heritage Capital Research may at times have positions in the securities referred to and may make purchases or sales of these securities while publications are in circulation. Positions may change at any time.
The analysis provided is based on both technical and fundamental research and is provided "as is" without warranty of any kind, either expressed or implied. Although the information contained is derived from sources which are believed to be reliable, they cannot be guaranteed.
The author neither endorses nor warrants the content of this site, any embedded advertisement, or any linked resource. The author or his managed funds may hold either long or short positions in the referenced securities. Republication rights must be expressly granted by author in writing.
Investments in equities carry an inherent element of risk including the potential for significant loss of principal. Past performance is not an indication of future results.