Bear Camp Can't Be Happy
Happy Monday and welcome back to the game; a game that must be a bit befuddling for the bears at this time.
Think about it. Our furry friends would seem to have an abundance of firepower at their disposal. For example, there is the ongoing trade spat, which seemingly improving with China (or not, depending on the day, of course!), is just getting started with the folks across the pond. There is #GlobalGrowthSlowing, which can't really be disputed, even by the most ardent bulls. There is the punk manufacturing data here at home. There is the third straight quarterly decline in earnings. There is the threat of recession. There is record negativity seen among investing pro's in Barron's most recent Big Money Poll. And now an official impeachment procedure of sorts, which is likely to create some fireworks in Washington as it plays out.
And yet, the S&P, the NASDAQ, and the total market indices all finished the week at all-time highs, with the DJIA not far behind. And don't look now fans, but the smallcaps, midcaps, banks and industrials are all starting to move up in earnest. If everything is so bad, how can this be happening, a bewildered bear might ask.
I know that I've said this a time or twenty over the years, but the key to understanding the current market action, which, again, appears to be simply insane to many, is to remember three key points.
First, stocks look forward, not backward. Second, the stock market can "handle" just about anything once the situation is out in the open. And finally, surprises and uncertainty are what really rocks Wall Street's boat.
Look Ahead, Not Back
Repeat after me. "The stock market is a discounting mechanism for future expectations." And from my perch, the bottom line here is that investors are looking ahead to better days. Days when recession isn't on the table, when economic growth rebounds, when the recent rate cuts work their way through the economy, when the removal of a President isn't a concern, and when the Fed isn't cutting rates.
Sure, the bear camp will argue that stocks are currently looking at the future through rose-colored glasses. Yes, the U.S. consumer, which has singlehandedly kept the U.S. economy moving forward, could stop spending on a dime if something bad actually happens. And I will agree that if Europe, China, et al continue to slump that the U.S. might not be immune forever.
But for now, at least, stocks appear to be looking at strong employment, solid consumer stats, decent earnings growth, good-enough GDP numbers, and maybe, just maybe, a turn in the #GrowthSlowing data.
So, given that a lot of stocks have made no progress for nearly two years now (take a peek at the weekly charts of the midcap and smallcap indices for confirmation) while earnings have been rising, I can argue that there is definitely room for advancement.
There's Nothing New Here
If you think the trade war with China is going to kill the U.S. stock market, think again. The trade spat has been with us for going on two years now. And the bottom line is that investors are moving on.
Wall Street now knows what the impact of the trade war will be as the data geeks have been crunching and re-crunching for some time now. And while the trade war is definitely impacting the economy (sorry Mr. President, the Fed isn't the enemy here), it does not appear to be enough to send us into recession. And it is the threat of recession that scares the market.
Oh, and with no end in sight to the spat, manufacturers have been busy making other plans. Corporate America is all about making money. So, if changes are needed, changes are made. It's called moving on.
Are There Any New Surprises?
One might have argued that the impeachment proceedings might bring new surprises and uncertainty to the corner of Broad and Wall. However, the assumptions are that (a) the President will go to trial in the Senate for his less-than becoming behavior and (b) he will not be convicted due to the state of partisan politics.
Next up, Powell & Co. appear to have finally learned how to communicate with Wall Street. And so far, at least, traders like the idea that the Fed is effectively on hold. This means that the Fed doesn't see big problems lurking and yet took enough action to help the economy get through the trade war.
So, unless/until something changes, there doesn't appear to be anything causing a great deal of uncertainty. And this is just the way Wall Street likes it - from a big-picture perspective, anyway.
But since it's the start of a new week, it's now time to put aside my subjective view of the action and to review the "state" of our indicator boards.
Have a great week!
Weekly Market Model Review
Each week we do a disciplined, deep dive into our key market indicators and models. The overall goal of this exercise is to (a) remove emotion from the investment process, (b) stay "in tune" with the primary market cycles, and (c) remain cognizant of the risk/reward environment.
The Major Market Models
We start with six of our favorite long-term market models. These models are designed to help determine the "state" of the overall market. Put another way, these models indicate which team is in control of the primary trend.
There were no changes to the Primary Cycle board this week. From my seat, the message from these big-picture, market models is that investors should be positioned either at or above the high end of their equity allocation levels. What if you are currently underinvested, you ask? My plan would be to put money to work into weakness - especially at this time of year. Remember, we have now entered the strongest 6-month period for stocks (according to the Stock Trader's Almanac) where the vast majority of history's stock market gains have been generated.
This week's mean percentage score of my 6 favorite models improved to pulled back to 75.6% from 81.7% last week while the median also slipped to 80.0% from 81.7%.
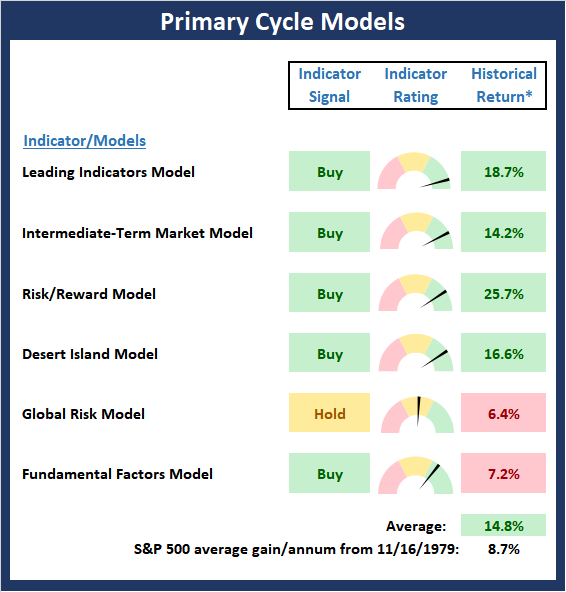
* Source: Ned Davis Research (NDR) as of the date of publication. Historical returns are hypothetical average annual performances calculated by NDR. Past performances do not guarantee future results or profitability - NOT INDIVIDUAL INVESTMENT ADVICE.
View My Favorite Market Models Online
The State of the Fundamental Backdrop
Next, we review the market's fundamental factors in the areas of interest rates, the economy, inflation, and valuations.
There was no obvious change to the Fundamental Factor board this week. However, I would like to point out that we have expanded our Earnings Composite, which now includes 4 separate models designed to measure the state of the earnings. In sum, as I've been saying, I believe the Fundamentals continue to support the idea of keeping your offense on the field.
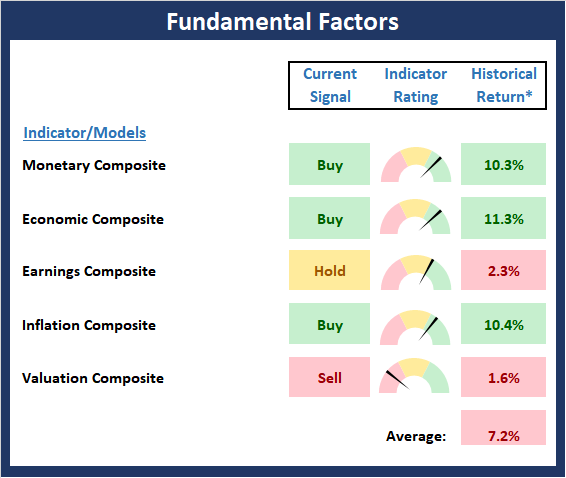
* Source: Ned Davis Research (NDR) as of the date of publication. Historical returns are hypothetical average annual performances calculated by NDR. Past performances do not guarantee future results or profitability - NOT INDIVIDUAL INVESTMENT ADVICE.
View Fundamental Indicator Board Online
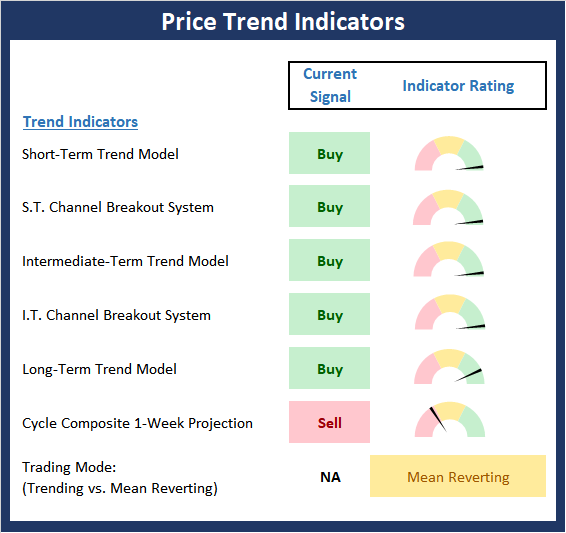
The State of the Trend
From there, we look at the state of the current trend. This board of indicators is designed to tell us about the overall technical health of the current trend.
The Price Trend board continues to sport a healthy amount of green. Given that the S&P 500, NASDAQ, and total market indices all scored all-time highs on Friday (with the Dow just a whisker away), the "state" of the trend board isn't surprising.
However, there a couple items of note here. First, there is still a gap on the daily chart of the S&P down at 2948.46. Remember, gaps on the S&P are almost always "closed" at some point. Also note that a pullback on the S&P of -3.86% would be required to fill that gap. Second, the Cycle Composite suggest weakness this week and some additional sloppiness through the middle of the month. Thus, investors looking to put money to work may want to be patient for a while yet.
NOT INDIVIDUAL INVESTMENT ADVICE.
View Trend Indicator Board Online
The State of Internal Momentum
Next, we analyze the "oomph" behind the current trend via our group of market momentum indicators/models.
The Momentum board continued to show improvement last week and remains in good shape. As expected, the S.T. Volume model did indeed flip to positive last week. The only fly in the ointment is the volume thrust indicator, which is based on the NASDAQ. But overall, I think the market's "mo" is strong enough to continue to support the bulls from an intermediate-term perspective.
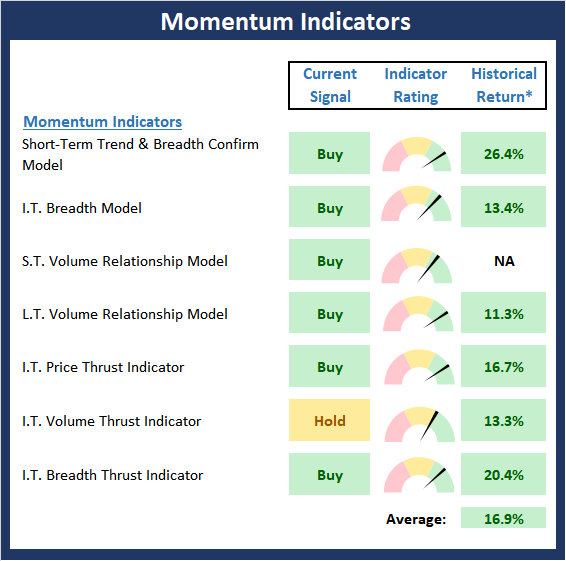
* Source: Ned Davis Research (NDR) as of the date of publication. Historical returns are hypothetical average annual performances calculated by NDR. Past performances do not guarantee future results or profitability - NOT INDIVIDUAL INVESTMENT ADVICE.
View Momentum Indicator Board Online
Early Warning Signals
Once we have identified the current environment, the state of the trend, and the degree of momentum behind the move, we review the potential for a counter-trend move to begin. This batch of indicators is designed to suggest when the table is set for the trend to "go the other way."
The message from the Early Warning board is becoming clearer. While I do think we are beginning to see a "good overbought" condition (where the market gets overbought and stays overbought while it trends higher), the board appears to be telling us that it might be time for the bulls to take a breather at some point soon. At the same time, we must remember that breaks to new highs have been met with selling in rather short order this year. So, with the rest of the boards telling me to give the bulls the benefit of the doubt, it is probably best to buy the next dip - especially one that fills the gap on the chart of the S&P. But investors looking to put money to work may want to be cautious here.

* Source: Ned Davis Research (NDR) as of the date of publication. Historical returns are hypothetical average annual performances calculated by NDR. Past performances do not guarantee future results or profitability - NOT INDIVIDUAL INVESTMENT ADVICE.
View Early Warning Indicator Board Online
Thought For The Day:
The Gods cannot help those who do not seize opportunities. -Confucius
Wishing you green screens and all the best for a great day,

David D. Moenning
Founder, Chief Investment Officer
Heritage Capital Research

Disclosures
At the time of publication, Mr. Moenning held long positions in the following securities mentioned: None - Note that positions may change at any time.
Leading Indicators Model: A group of indicators that have historically shown tendencies to lead the market at major turning points.
Intermediate-Term Market Model: A composite model (model of models) focused on trend and momentum indicators which has been designed to provide identify intermediate-term trading opportunities.
Risk/Reward Model: A model-of-models intended to provide an overall view of the state of the risk/reward environment. The model includes tape, monetary, and sentiment indicators as well as 7 big-picture market model readings.
Desert Island Model: If I was stranded on a desert island with access to only one market model to manage money with, this would be the model. The model is a comprehensive model-of-models comprised of trend, momentum, mean reversion, economic, monetary, sentiment, and factor-based indicators/models.
External Factors Model: A model-of-models designed to provide a reading on the "macro state" of the market environment. The model is comprised of indicators/models in the areas of various index yields, industrial production, investors sentiment, and historic volatility.
Short-Term Trend-and-Breadth Signal Explained: History shows the most reliable market moves tend to occur when the breadth indices are in gear with the major market averages. When the breadth measures diverge, investors should take note that a trend reversal may be at hand. This indicator incorporates NDR's All-Cap Dollar Weighted Equity Series and A/D Line. From 1998, when the A/D line is above its 5-day smoothing and the All-Cap Equal Weighted Equity Series is above its 25-day smoothing, the equity index has gained at a rate of +32.5% per year. When one of the indicators is above its smoothing, the equity index has gained at a rate of +13.3% per year. And when both are below, the equity index has lost +23.6% per year.
Channel Breakout System Explained: The short-term and intermediate-term Channel Breakout Systems are modified versions of the Donchian Channel indicator. According to Wikipedia, "The Donchian channel is an indicator used in market trading developed by Richard Donchian. It is formed by taking the highest high and the lowest low of the last n periods. The area between the high and the low is the channel for the period chosen."
Intermediate-Term Trend-and-Breadth Signal Explained: This indicator incorporates NDR's All-Cap Dollar Weighted Equity Series and A/D Line. From 1998, when the A/D line is above its 45-day smoothing and the All-Cap Equal Weighted Equity Series is above its 45-day smoothing, the equity index has gained at a rate of +17.6% per year. When one of the indicators is above its smoothing, the equity index has gained at a rate of +6.5% per year. And when both are below, the equity index has lost -1.3% per year.
Cycle Composite Projections: The cycle composite combines the 1-year Seasonal, 4-year Presidential, and 10-year Decennial cycles. The indicator reading shown uses the cycle projection for the upcoming week.
Trading Mode Indicator: This indicator attempts to identify whether the current trading environment is "trending" or "mean reverting." The indicator takes the composite reading of the Efficiency Ratio, the Average Correlation Coefficient, and Trend Strength models.
Volume Relationship Models: These models review the relationship between "supply" and "demand" volume over the short- and intermediate-term time frames.
Price Thrust Model Explained: This indicator measures the 3-day rate of change of the Value Line Composite relative to the standard deviation of the 30-day average. When the Value Line's 3-day rate of change have moved above 0.5 standard deviation of the 30-day average ROC, a "thrust" occurs and since 2000, the Value Line Composite has gained ground at a rate of +20.6% per year. When the indicator is below 0.5 standard deviation of the 30-day, the Value Line has lost ground at a rate of -10.0% per year. And when neutral, the Value Line has gained at a rate of +5.9% per year.
Volume Thrust Model Explained: This indicator uses NASDAQ volume data to indicate bullish and bearish conditions for the NASDAQ Composite Index. The indicator plots the ratio of the 10-day total of NASDAQ daily advancing volume (i.e., the total volume traded in stocks which rose in price each day) to the 10-day total of daily declining volume (volume traded in stocks which fell each day). This ratio indicates when advancing stocks are attracting the majority of the volume (readings above 1.0) and when declining stocks are seeing the heaviest trading (readings below 1.0). This indicator thus supports the case that a rising market supported by heavier volume in the advancing issues tends to be the most bullish condition, while a declining market with downside volume dominating confirms bearish conditions. When in a positive mode, the NASDAQ Composite has gained at a rate of +38.3% per year, When neutral, the NASDAQ has gained at a rate of +13.3% per year. And when negative, the NASDAQ has lost at a rate of -14.279% per year.
Breadth Thrust Model Explained: This indicator uses the number of NASDAQ-listed stocks advancing and declining to indicate bullish or bearish breadth conditions for the NASDAQ Composite. The indicator plots the ratio of the 10-day total of the number of stocks rising on the NASDAQ each day to the 10-day total of the number of stocks declining each day. Using 10-day totals smooths the random daily fluctuations and gives indications on an intermediate-term basis. As expected, the NASDAQ Composite performs much better when the 10-day A/D ratio is high (strong breadth) and worse when the indicator is in its lower mode (weak breadth). The most bullish conditions for the NASDAQ when the 10-day A/D indicator is not only high, but has recently posted an extreme high reading and thus indicated a thrust of upside momentum. Bearish conditions are confirmed when the indicator is low and has recently signaled a downside breadth thrust. In positive mode, the NASDAQ has gained at a rate of +22.1% per year since 1981. In a neutral mode, the NASDAQ has gained at a rate of +14.5% per year. And when in a negative mode, the NASDAQ has lost at a rate of -6.4% per year.
Short-Term Overbought/sold Indicator: This indicator is the current reading of the 14,1,3 stochastic oscillator. When the oscillator is above 80 and the %K is above the %D, the indicator gives an overbought reading. Conversely, when the oscillator is below 20 and %K is below its %D, the indicator is oversold.
Intermediate-Term Overbought/sold Indicator: This indicator is a 40-day RSI reading. When above 57.5, the indicator is considered overbought and wnen below 45 it is oversold.
Mean Reversion Model: This is a diffusion model consisting of five indicators that can produce buy and sell signals based on overbought/sold conditions.
VIX Indicator: This indicators looks at the current reading of the VIX relative to standard deviation bands. When the indicator reaches an extreme reading in either direction, it is an indication that a market trend could reverse in the near-term.
Short-Term Sentiment Indicator: This is a model-of-models composed of 18 independent sentiment indicators designed to indicate when market sentiment has reached an extreme from a short-term perspective. Historical analysis indicates that the stock market's best gains come after an environment has become extremely negative from a sentiment standpoint. Conversely, when sentiment becomes extremely positive, market returns have been subpar.
Intermediate-Term Sentiment Indicator: This is a model-of-models composed of 7 independent sentiment indicators designed to indicate when market sentiment has reached an extreme from a intermediate-term perspective. Historical analysis indicates that the stock market's best gains come after an environment has become extremely negative from a sentiment standpoint. Conversely, when sentiment becomes extremely positive, market returns have been subpar.
Long-Term Sentiment Indicator: This is a model-of-models composed of 6 independent sentiment indicators designed to indicate when market sentiment has reached an extreme from a long-term perspective. Historical analysis indicates that the stock market's best gains come after an environment has become extremely negative from a sentiment standpoint. Conversely, when sentiment becomes extremely positive, market returns have been subpar.
Absolute Monetary Model Explained: The popular cliche, "Don't fight the Fed" is really a testament to the profound impact that interest rates and Fed policy have on the market. It is a proven fact that monetary conditions are one of the most powerful influences on the direction of stock prices. The Absolute Monetary Model looks at the current level of interest rates relative to historical levels and Fed policy.
Relative Monetary Model Explained: The "relative" monetary model looks at monetary indicators relative to recent levels as well as rates of change and Fed Policy.
Economic Model Explained: During the middle of bull and bear markets, understanding the overall health of the economy and how it impacts the stock market is one of the few truly logical aspects of the stock market. When our Economic model sports a "positive" reading, history (beginning in 1965) shows that stocks enjoy returns in excess of 21% per year. Yet, when the model's reading falls into the "negative" zone, the S&P has lost nearly -25% per year. However, it is vital to understand that there are times when good economic news is actually bad for stocks and vice versa. Thus, the Economic model can help investors stay in tune with where we are in the overall economic cycle.
Inflation Model Explained: They say that "the tape tells all." However, one of the best "big picture" indicators of what the market is expected to do next is inflation. Simply put, since 1962, when the model indicates that inflationary pressures are strong, stocks have lost ground. Yet, when inflationary pressures are low, the S&P 500 has gained ground at a rate in excess of 13%. The bottom line is inflation is one of the primary drivers of stock market returns.
Valuation Model Explained: If you want to get analysts really riled up, you need only to begin a discussion of market valuation. While the question of whether stocks are overvalued or undervalued appears to be a simple one, the subject is actually extremely complex. To simplify the subject dramatically, investors must first determine if they should focus on relative valuation (which include the current level of interest rates) or absolute valuation measures (the more traditional readings of Price/Earnings, Price/Dividend, and Price/Book Value). We believe that it is important to recognize that environments change. And as such, the market's focus and corresponding view of valuations are likely to change as well. Thus, we depend on our Valuation Models to help us keep our eye on the ball.
Disclosures
NOT INVESTMENT ADVICE. The opinions and forecasts expressed herein are those of Mr. David Moenning and Heritage Capital Research and may not actually come to pass. The opinions and viewpoints regarding the future of the markets should not be construed as recommendations. The analysis and information in this report is for informational purposes only. No part of the material presented in this report is intended as an investment recommendation or investment advice. Neither the information nor any opinion expressed constitutes a solicitation to purchase or sell securities or any investment program.
Any investment decisions must in all cases be made by the reader or by his or her investment adviser. Do NOT ever purchase any security without doing sufficient research. There is no guarantee that the investment objectives outlined will actually come to pass. All opinions expressed herein are subject to change without notice. Neither the editor, employees, nor any of their affiliates shall have any liability for any loss sustained by anyone who has relied on the information provided.
Mr. Moenning of Heritage Capital Research is an investment adviser representative of Eastsound Capital Advisors, LLC, a registered investment advisor. The adviser may not transact business in states where it is not appropriately registered, excluded or exempted from registration. Individualized responses to persons that involve either the effecting of transaction in securities, or the rendering of personalized investment advice for compensation, will not be made without registration or exemption.
Mr. Moenning and Heritage Capital Research may at times have positions in the securities referred to and may make purchases or sales of these securities while publications are in circulation. Positions may change at any time.
The analysis provided is based on both technical and fundamental research and is provided "as is" without warranty of any kind, either expressed or implied. Although the information contained is derived from sources which are believed to be reliable, they cannot be guaranteed.
The author neither endorses nor warrants the content of this site, any embedded advertisement, or any linked resource. The author or his managed funds may hold either long or short positions in the referenced securities. Republication rights must be expressly granted by author in writing.
Investments in equities carry an inherent element of risk including the potential for significant loss of principal. Past performance is not an indication of future results.