Checking The Playbook
My guess is that after Wednesday's action, everyone is feeling a little better about the state of the stock market. While the bears and their algos mounted another series of attacks yesterday, good prevailed over evil and stocks managed to avoid getting hammered for a second consecutive day. Feels like progress, right?
But... Given that the S&P 500 recently tanked 6.7% over seven trading days and wound up scaring the bejeebers out of just about investors in the process, the question of the day is if the recent dance to the downside is over. To which I will reply (with tongue firmly implanted in cheek), maybe yes, maybe no.
Before you hit delete in disgust over the my response, please allow me a chance to "esplain." You see, what we've got going here is termed a "waterfall decline." And the good news is that these types of declines tend to follow a script or pattern - something I like to call the "Crash Playbook."
I've written on this subject a time or two over the years. As such, long-time readers that can recite the six stages of a waterfall decline may be dismissed. For the rest, keep reading as you may find some of this stuff useful both now and in the future. In short, professional traders all have the "crash playbook" memorized. And thus, the patterns tend to repeat. So, let's review...
Stage 1: The Initial Dive
The initial move of a waterfall decline is easy to identify. It's the gut-wrenching selling where the indices shed points at a rate that boggles the mind. The 838-point decline on the Dow Jones Industrial Average on October 10 qualifies here. As does the more than 500-point dive seen the following day. All anybody could say at the close on October 11 was, "ouch!" Thus, I think we can put a check mark on this one.
Stage 2: The Emotional Low
Typically, waterfall declines, which are also referred to as "crashes" when things get really nutty, create a lot of emotion. And not the good kind. As the move unfolds, traders look for a "flush" or a "washout" where everyone in the game throws up their hands and gives up. This creates the "emotional low" as everybody that needed so sell (or was forced to sell - think margin calls and fund liquidations) likely did so - at the same time - during this stage.
Currently, there is a contingent who believe that the "emotional low" occurred on 10/11. After all, the Dow had fallen nearly 1400 points in a matter of hours and the market internals were nothing short of u-g-l-y. But frankly, I'm not so sure. And this is where the game gets interesting.
Stage 3: The Dead Cat Bounce
As the saying goes, if you drop it from a high enough point, even a dead cat is going to bounce. (My apologies to all the cat lovers out there, but I'm sorry to say, this is a market term, and not something I have invented.) As such, after some wild and woolly selling, a bounce tends to ensue. The move up is usually fueled by short-covering (it is said that ALL bottoms begin with short-covering) and as such, is explosive to the upside. Stocks appear to "melt up" as everyone betting on a bigger decline bails - again, all at the same time. Fibonacci retracement levels are met - and everybody starts to feel better.
There are a lot of folks who believe we are currently watching the "dead cat bounce" unfold here. Look at the chart below and you can see what they mean.
S&P 500 - Daily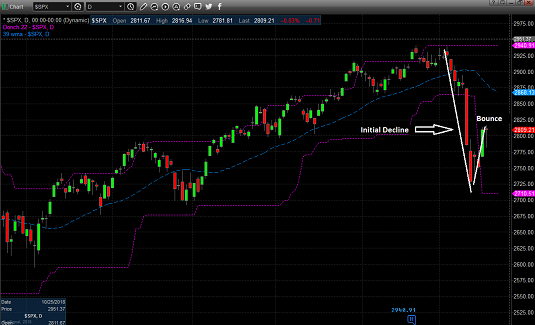
View Larger Chart
Stage 4: The Retest
Next comes the "retest" phase. It is generally accepted amongst the technical analysis community that the lows of waterfall declines are almost always "tested" in some fashion before the next rally can begin. However, the "retest" phase can be tricky because the market doesn't have to necessarily test the exact level of the initial lows. No, stocks can merely head back down toward the lows - or - emotions can take over again and the initial lows can be actually exceeded. But as long as some sort of decline follows the bounce, it can be labeled a "test" of the lows.
The "retest" phase is rooted in emotion. After the big bounce allows for a collective sigh of relief, the reason for the initial decline tends to resurface. And then, BAM, panic sets in again and WHOOSH - down they go. Only this time, the intensity of the decline is less. This time, buyers step in. And this time, something good usually happens to change the mindset.
Stage 5: The Basing Phase
The idea that "something good" can occur (such as Jamie Dimon stepping to the microphone on March 9, 2009 to tell reporters that his bank was still making money and definitely not on the brink of collapse) reminds investors that "this too shall pass" and the world may not be coming to an end after all.
This is when the value players and the bargain hunters start to get busy. This is when there is a market again as both buyers and sellers are back in the game. And in short, this creates a back-and-forth "basing" phase where sellers eventually become exhausted.
Stage 6: The Resumption of the Trend
Once everybody figures out the end is not nigh, buyers and sellers battle it out for a while, creating a basing phase in the process. This phase is highlighted by the market moving two steps forward and one step back. The period of sideways action can last anywhere from a few days to a few months. And over time, breakouts occur and the uptrend resumes.
Where Are We Now?
Lots of folks believe that we have completed stages 1 and 2. There are even those who believe that Wednesday's action represented a retest of sorts. As such, after some waffling, it'll be up, up, and away soon.
Here's the rub. Oftentimes, stage 1 includes a bounce - and then the selling resumes and the "real" emotional low hits. This is where the true "give up" tends to occur as folks just can't take it anymore. "Get me out at any price" is the battle cry of the day. And the action looks downright nasty.
My primary concern is that we are still in stage 1. I won't bore with the reasons why I think this is possible. But the good news is that we should know soon. You see, if the initial decline is going to resume, it ought do so in short order.
So, if the bulls can hold on here for a few days and can avoid another round of pummeling, then the retest or basing phase could begin relatively soon. Those who prefer this scenario suggest that the "reasons" for the initial decline were pretty thin (I agree completely with this analysis) and that the selling was overdone (which could equate to an "emotional low" having been achieved).
To be clear, I'm not suggesting that I know exactly where we are in the playbook. However, I think it helps to know that markets like this one tend to follow a script. And now you have a copy of your very own to reference from time to time. It is my sincere hope that there some small part of this missive can be seen as helpful in deciphering Ms. Market's current game.
Thought For The Day:
Truth at last cannot be hidden. -Leonardo da Vinci
Wishing you green screens and all the best for a great day,

David D. Moenning
Founder, Chief Investment Officer
Heritage Capital Research
HCR Focuses on a Risk-Managed Approach to Investing
What Risk Management Can and Cannot Do

ANNOUNCEMENT:
HCR Awarded Top Honors in 2018 NAAIM Shark Tank Portfolio Strategy Competition
Each year, NAAIM (National Association of Active Investment Managers) hosts a competition to identify the best actively managed investment strategies. In April, HCR's Dave Moenning took home first place for his flagship risk management strategy.
Disclosures
At the time of publication, Mr. Moenning held long positions in the following securities mentioned: None - Note that positions may change at any time.
The opinions and forecasts expressed herein are those of Mr. David Moenning and may not actually come to pass. Mr. Moenning's opinions and viewpoints regarding the future of the markets should not be construed as recommendations. The analysis and information in this report is for informational purposes only. No part of the material presented in this report is intended as an investment recommendation or investment advice. Neither the information nor any opinion expressed constitutes a solicitation to purchase or sell securities or any investment program.
Any investment decisions must in all cases be made by the reader or by his or her investment adviser. Do NOT ever purchase any security without doing sufficient research. There is no guarantee that the investment objectives outlined will actually come to pass. All opinions expressed herein are subject to change without notice. Neither the editor, employees, nor any of their affiliates shall have any liability for any loss sustained by anyone who has relied on the information provided.
Mr. Moenning may at times have positions in the securities referred to and may make purchases or sales of these securities while publications are in circulation. Positions may change at any time.
The analysis provided is based on both technical and fundamental research and is provided "as is" without warranty of any kind, either expressed or implied. Although the information contained is derived from sources which are believed to be reliable, they cannot be guaranteed.
Investments in equities carry an inherent element of risk including the potential for significant loss of principal. Past performance is not an indication of future results.