Four Key Points For This Market

I hope you and yours had a wonderful Fourth. It was a busy holiday weekend here in Colorado. My wife and I hit the golf course, the hiking trails, the bike path, and the doggie trail, finished the season's planting, and enjoyed a couple social distanced happy hours with friends. Frankly, I could use some rest!
The key is that I didn't spend much time in front of the computer this weekend. So as the screens begin to blink on this fine Monday morning, I thought I'd review the key points running through my head as I reengage with the markets and ponder the state of economy and the COVID crisis.
Cutting to the chase, there are four points I'd like to make this morning.
1. For Most, It's a Consolidation Phase
Let's start with the blinking screens and the overall state of the stock market. While I am likely to get tagged with a "Captain Obvious" label here, I think the most important thing to note about the current trend of the major indices is that with one exception, they are all stuck in a sideways consolidation phase.
So, for the S&P 500, Dow Jones Industrial Average, Russell 2000 Smallcaps, and the Midcaps, we're dealing with a range bound market. The range is fairly obvious for the S&P, with the high end up at 3230 and the low end down around the 2965 zone.
My take is that the major indices have been digesting the massive run that began on March 24, 2020 and will likely continue to do so for a while.
This sideways action can be seen everywhere except NASDAQ and NASDAQ 100, which, of course are dominated by the megacap tech names that are #winning in the COVID world. A quick glance at a chart of these two indices tells the story here. While the rest of the indices are going nowhere fast, the NDX is trending up nicely.
And from my seat, unless the trend in new cases of COVID starts to decline in a meaningful fashion and the economy successfully reopens (and stays open), our bet is that investors will continue to favor those COVID winners such as AMZN, NFLX, MSFT, FB, AAPL, GOOGL, PYPL, NVDA, ADBE, SHOP, W, DOCU, ZM, etc.
Why? Because this is where predictable/dependable growth can be found during a time of great uncertainty.
Sure, these names have been on a tear for quite some time (no, let's make that, a VERY long time). And yes, it can be argued that this trend may be overdone and that these names are over-owned. But as the manager of a discretionary stock portfolio, I am planning on sticking with these winners until the environment changes.
Remember, investors want to go where the growth is. And while I want to believe that the hotels names such as HLT and MAR will continue to recover and that folks will start to board planes again en masse soon, I'm much more comfortable sitting with a big slug of my portfolio in the big, dependable growth names. Well, for now at least.
2. About That Recovery Trade
Next, I'm of the mind that the mean reversion/recovery trade may have run its course for now. You've all heard the stories of retail traders bombing into the names that have been beaten down the most. This is a classic rebound play after a waterfall decline. However, while the cruise ships have bounced a bit, I'm just not sure how much more upside there can be in this "trade" in the near-term.
The bottom line is that businesses which are negatively impacted by social distancing are unlikely to return to "normal" until/unless there is a medical solution to COVID-19. However, given enough time, I have little doubt that the airline and restaurant businesses will find ways to make money - even in the "new normal" environment we now live.
For example, a neighbor is a pilot for American and he reports that they are flying "a ton" of freight to places like Hawaii in order to get the big box stores the merchandise they need. But in the near-term, this type of "new normal" business isn't likely to make up the shortfall.
So, if you have a long-term time frame, it's probably a good time to start nibbling at the airlines. But I think you need to be able to look ahead a year or two at least.
3. Don't Fight The Fed (Especially When They Are On A Mission)
Point number three is that markets continue to be buoyed by stimulus and an ultra-easy Fed. A Fed that "isn't even thinking about thinking about raising rates." And if I've learned anything over my 33 years as a money manager it is that you don't want to fight the Fed. Ever. Especially when they are on a mission.
And make no mistake about it; this Fed is on a mission. Like Ben Bernanke during the Great Financial Crisis, Jay Powell and Company are going to do everything/anything in order to prop up the economy. End of story.
Another part of this lesson is investors must remember that we live in a global world and that "money goes to where it is treated best." The bottom line here is the U.S. remains the best place in the world to invest. And money continues to find its way into our stock and bond markets.
4. Markets Appear To B From Missouri
Missouri is known as the "show me" state. And since I feel that the markets may want to "see" more in terms of real economic progress before a true "recovery" trade can take hold, a great many investors appear to be from Missouri these days.
Stocks have enjoyed the initial bounce in the economic data and the markets. But there is a BIG difference from a bounce in the data of the dead cat variety and true economic growth. As such, I'm of the mind that investors will want to "see" the economy/earnings to actually improve before they move away from their "dependable growth" trade that is driving the NASDAQ 100 higher.
When asked about the second half of 2020, Sam Stovall, chief investment strategist at CFRA, offered up a similar view. Last week, Mr. Stovall wrote, "The second half needs to be a 'show me' period, proving that our optimism was justified. We'll need to see continued improvement in the economic data, and I think we need to see upward revisions to earnings estimates."
So, for a while, stocks can certainly move up on "expectations" for the economy and earnings to continue to rebound. But for me, the question of the day is, how long will it take for real growth to return to both areas?
If "real" growth can return within the next 6 - 9 months, then current stock prices are certainly justified and there would appear to be some upside ahead. However, if the recovery is weaker than expected or worse, delayed, there may be some "price discovery" to deal with. So, stick around, this ought to be interesting.
Weekly Market Model Review
Each week we do a disciplined, deep dive into our key market indicators and models. The overall goal of this exercise is to (a) remove emotion from the investment process, (b) stay "in tune" with the primary market cycles, and (c) remain cognizant of the risk/reward environment.
The Major Market Models
We start with six of our favorite long-term market models. These models are designed to help determine the "state" of the overall market.
There are no changes to report on the Primary Cycle board this week. Overall, I continue to believe the board supports the idea that stocks are currently in the midst of a cyclical bull market and suggests that the bulls should be given the benefit of any doubt. However, it is important to keep in mind that there will be bumps in the road ahead.
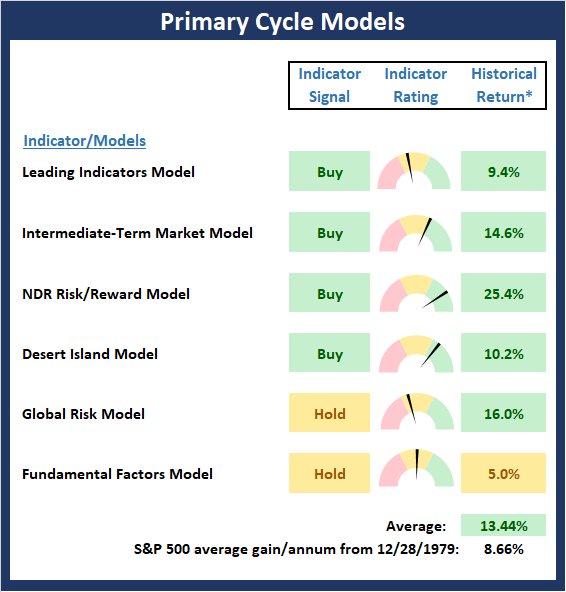
* Source: Ned Davis Research (NDR) as of the date of publication. Historical returns are hypothetical average annual performances calculated by NDR. Past performances do not guarantee future results or profitability - NOT INDIVIDUAL INVESTMENT ADVICE.
View My Favorite Market Models Online
The State of the Fundamental Backdrop
Next, we review the market's fundamental factors in the areas of interest rates, the economy, inflation, and valuations.
There are also no changes to the Fundamental Factors board to report this week. As I've mentioned a time or two this year, I continue to take the readings from the economic and earnings composite with a hefty grain of salt. The bottom line is we just don't know how far both can recover from the recent self-induced historic declines. And to make matters all the more challenging, the next important move in stocks is likely to be driven by the state of the economy/earnings. (Unless the government decides to drop more money from the sky, of course!)
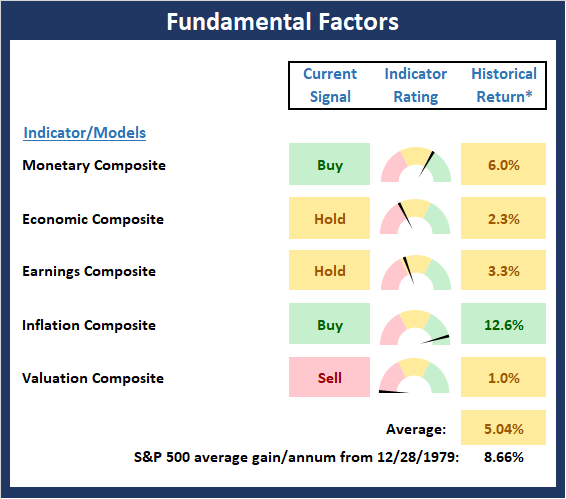
* Source: Ned Davis Research (NDR) as of the date of publication. Historical returns are hypothetical average annual performances calculated by NDR. Past performances do not guarantee future results or profitability - NOT INDIVIDUAL INVESTMENT ADVICE.
View Fundamental Indicator Board Online
The State of the Trend
After looking at the big-picture models and the fundamental backdrop, I like to look at the state of the trend. This board of indicators is designed to tell us about the overall technical health of the current trend.
The trend board improved nicely last week. But in reality, the S&P 500 remains stuck in a sideways range between 2965 on the downside and 3230 on the upside. My take is the sideways action represents a consolidation of the massive rebound that began on March 24, 2020. So, we will be watching/waiting for a breakout of this range for clues about the next meaningful move.
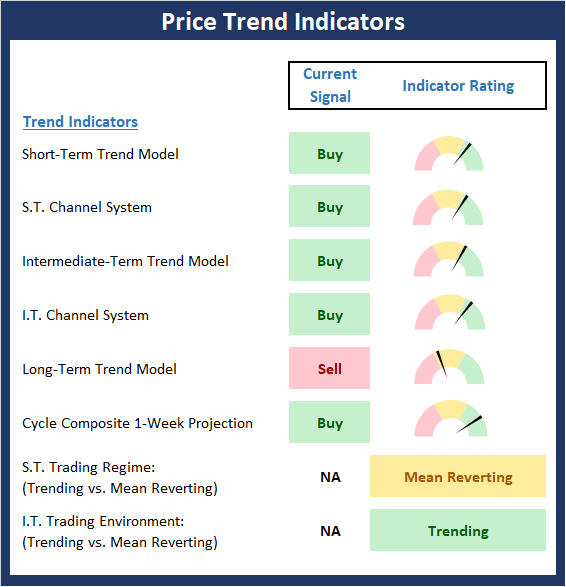
NOT INDIVIDUAL INVESTMENT ADVICE.
View Trend Indicator Board Online
The State of Internal Momentum
Next, we analyze the "oomph" behind the current trend via our group of market momentum indicators/models.
The Momentum Board saw modest improvement last week as our short-term trend and breadth confirm model flipped from negative to positive. However, this is a very sensitive indicator and thus could easily slip back into the red with a few bad days. It is also worth noting that both of our volume relationship models remain positive since volume is the lifeblood of a bullish environment.
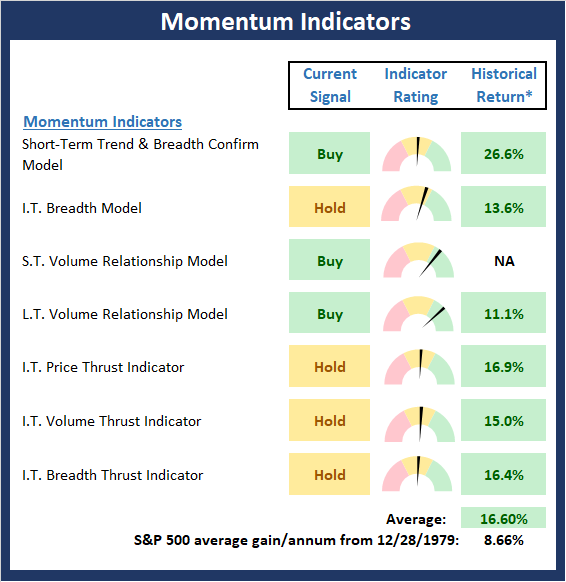
* Source: Ned Davis Research (NDR) as of the date of publication. Historical returns are hypothetical average annual performances calculated by NDR. Past performances do not guarantee future results or profitability - NOT INDIVIDUAL INVESTMENT ADVICE.
View Momentum Indicator Board Online
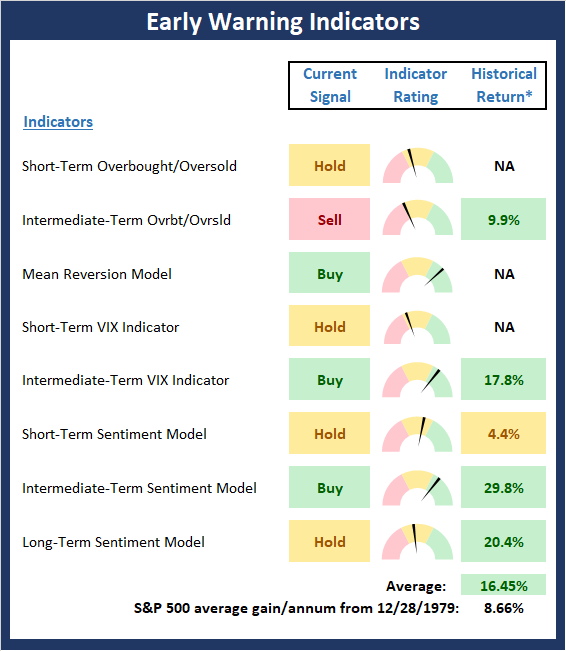
Early Warning Signals
Once we have identified the current environment, the state of the trend, and the degree of momentum behind the move, we then review the potential for a counter-trend move to begin. This batch of indicators is designed to suggest when the table is set for the trend to "go the other way."
The Early Warning board continues to be a mixed bag. I will note that both our short-term VIX and overbought/sold indicators are close to flashing sell signals, which suggests that the board is leaning a little toward the bearish side of the field. However, overbought conditions can stay in effect for long periods of time and the VIX is trending lower. Both would be considered positives. So, as I said, the board is a mixed bag here and doesn't really support either team's case.
* Source: Ned Davis Research (NDR) as of the date of publication. Historical returns are hypothetical average annual performances calculated by NDR. Past performances do not guarantee future results or profitability - NOT INDIVIDUAL INVESTMENT ADVICE.
View Early Warning Indicator Board Online
Thought For The Day:
Few can be as persuasive as those not hampered by the facts. -Anonymous
Wishing you green screens and all the best for a great day,

David D. Moenning
Founder, Chief Investment Officer
Heritage Capital Research

Disclosures
At the time of publication, Mr. Moenning held long positions in the following securities mentioned: AMZN, NFLX, MSFT, FB, AAPL, PYPL, GOOGL, NVDA, ADBE, HLT - Note that positions may change at any time.
Leading Indicators Model: A group of indicators that have historically shown tendencies to lead the market at major turning points.
Intermediate-Term Market Model: A composite model (model of models) focused on trend and momentum indicators which has been designed to provide identify intermediate-term trading opportunities.
Risk/Reward Model: A model-of-models intended to provide an overall view of the state of the risk/reward environment. The model includes tape, monetary, and sentiment indicators as well as 7 big-picture market model readings.
Desert Island Model: If I was stranded on a desert island with access to only one market model to manage money with, this would be the model. The model is a comprehensive model-of-models comprised of trend, momentum, mean reversion, economic, monetary, sentiment, and factor-based indicators/models.
External Factors Model: A model-of-models designed to provide a reading on the "macro state" of the market environment. The model is comprised of indicators/models in the areas of various index yields, industrial production, investors sentiment, and historic volatility.
Short-Term Trend-and-Breadth Signal Explained: History shows the most reliable market moves tend to occur when the breadth indices are in gear with the major market averages. When the breadth measures diverge, investors should take note that a trend reversal may be at hand. This indicator incorporates NDR's All-Cap Dollar Weighted Equity Series and A/D Line. From 1998, when the A/D line is above its 5-day smoothing and the All-Cap Equal Weighted Equity Series is above its 25-day smoothing, the equity index has gained at a rate of +32.5% per year. When one of the indicators is above its smoothing, the equity index has gained at a rate of +13.3% per year. And when both are below, the equity index has lost +23.6% per year.
Channel Breakout System Explained: The short-term and intermediate-term Channel Breakout Systems are modified versions of the Donchian Channel indicator. According to Wikipedia, "The Donchian channel is an indicator used in market trading developed by Richard Donchian. It is formed by taking the highest high and the lowest low of the last n periods. The area between the high and the low is the channel for the period chosen."
Intermediate-Term Trend-and-Breadth Signal Explained: This indicator incorporates NDR's All-Cap Dollar Weighted Equity Series and A/D Line. From 1998, when the A/D line is above its 45-day smoothing and the All-Cap Equal Weighted Equity Series is above its 45-day smoothing, the equity index has gained at a rate of +17.6% per year. When one of the indicators is above its smoothing, the equity index has gained at a rate of +6.5% per year. And when both are below, the equity index has lost -1.3% per year.
Cycle Composite Projections: The cycle composite combines the 1-year Seasonal, 4-year Presidential, and 10-year Decennial cycles. The indicator reading shown uses the cycle projection for the upcoming week.
Trading Mode Indicator: This indicator attempts to identify whether the current trading environment is "trending" or "mean reverting." The indicator takes the composite reading of the Efficiency Ratio, the Average Correlation Coefficient, and Trend Strength models.
Volume Relationship Models: These models review the relationship between "supply" and "demand" volume over the short- and intermediate-term time frames.
Price Thrust Model Explained: This indicator measures the 3-day rate of change of the Value Line Composite relative to the standard deviation of the 30-day average. When the Value Line's 3-day rate of change have moved above 0.5 standard deviation of the 30-day average ROC, a "thrust" occurs and since 2000, the Value Line Composite has gained ground at a rate of +20.6% per year. When the indicator is below 0.5 standard deviation of the 30-day, the Value Line has lost ground at a rate of -10.0% per year. And when neutral, the Value Line has gained at a rate of +5.26% per year.
Volume Thrust Model Explained: This indicator uses NASDAQ volume data to indicate bullish and bearish conditions for the NASDAQ Composite Index. The indicator plots the ratio of the 10-day total of NASDAQ daily advancing volume (i.e., the total volume traded in stocks which rose in price each day) to the 10-day total of daily declining volume (volume traded in stocks which fell each day). This ratio indicates when advancing stocks are attracting the majority of the volume (readings above 1.0) and when declining stocks are seeing the heaviest trading (readings below 1.0). This indicator thus supports the case that a rising market supported by heavier volume in the advancing issues tends to be the most bullish condition, while a declining market with downside volume dominating confirms bearish conditions. When in a positive mode, the NASDAQ Composite has gained at a rate of +38.3% per year, When neutral, the NASDAQ has gained at a rate of +13.3% per year. And when negative, the NASDAQ has lost at a rate of -15.269% per year.
Breadth Thrust Model Explained: This indicator uses the number of NASDAQ-listed stocks advancing and declining to indicate bullish or bearish breadth conditions for the NASDAQ Composite. The indicator plots the ratio of the 10-day total of the number of stocks rising on the NASDAQ each day to the 10-day total of the number of stocks declining each day. Using 10-day totals smooths the random daily fluctuations and gives indications on an intermediate-term basis. As expected, the NASDAQ Composite performs much better when the 10-day A/D ratio is high (strong breadth) and worse when the indicator is in its lower mode (weak breadth). The most bullish conditions for the NASDAQ when the 10-day A/D indicator is not only high, but has recently posted an extreme high reading and thus indicated a thrust of upside momentum. Bearish conditions are confirmed when the indicator is low and has recently signaled a downside breadth thrust. In positive mode, the NASDAQ has gained at a rate of +22.1% per year since 1981. In a neutral mode, the NASDAQ has gained at a rate of +14.5% per year. And when in a negative mode, the NASDAQ has lost at a rate of -6.4% per year.
Short-Term Overbought/sold Indicator: This indicator is the current reading of the 14,1,3 stochastic oscillator. When the oscillator is above 80 and the %K is above the %D, the indicator gives an overbought reading. Conversely, when the oscillator is below 20 and %K is below its %D, the indicator is oversold.
Intermediate-Term Overbought/sold Indicator: This indicator is a 40-day RSI reading. When above 57.5, the indicator is considered overbought and wnen below 45 it is oversold.
Mean Reversion Model: This is a diffusion model consisting of five indicators that can produce buy and sell signals based on overbought/sold conditions.
VIX Indicator: This indicators looks at the current reading of the VIX relative to standard deviation bands. When the indicator reaches an extreme reading in either direction, it is an indication that a market trend could reverse in the near-term.
Short-Term Sentiment Indicator: This is a model-of-models composed of 18 independent sentiment indicators designed to indicate when market sentiment has reached an extreme from a short-term perspective. Historical analysis indicates that the stock market's best gains come after an environment has become extremely negative from a sentiment standpoint. Conversely, when sentiment becomes extremely positive, market returns have been subpar.
Intermediate-Term Sentiment Indicator: This is a model-of-models composed of 7 independent sentiment indicators designed to indicate when market sentiment has reached an extreme from a intermediate-term perspective. Historical analysis indicates that the stock market's best gains come after an environment has become extremely negative from a sentiment standpoint. Conversely, when sentiment becomes extremely positive, market returns have been subpar.
Long-Term Sentiment Indicator: This is a model-of-models composed of 6 independent sentiment indicators designed to indicate when market sentiment has reached an extreme from a long-term perspective. Historical analysis indicates that the stock market's best gains come after an environment has become extremely negative from a sentiment standpoint. Conversely, when sentiment becomes extremely positive, market returns have been subpar.
Absolute Monetary Model Explained: The popular cliche, "Don't fight the Fed" is really a testament to the profound impact that interest rates and Fed policy have on the market. It is a proven fact that monetary conditions are one of the most powerful influences on the direction of stock prices. The Absolute Monetary Model looks at the current level of interest rates relative to historical levels and Fed policy.
Relative Monetary Model Explained: The "relative" monetary model looks at monetary indicators relative to recent levels as well as rates of change and Fed Policy.
Economic Model Explained: During the middle of bull and bear markets, understanding the overall health of the economy and how it impacts the stock market is one of the few truly logical aspects of the stock market. When our Economic model sports a "positive" reading, history (beginning in 1965) shows that stocks enjoy returns in excess of 21% per year. Yet, when the model's reading falls into the "negative" zone, the S&P has lost nearly -25% per year. However, it is vital to understand that there are times when good economic news is actually bad for stocks and vice versa. Thus, the Economic model can help investors stay in tune with where we are in the overall economic cycle.
Inflation Model Explained: They say that "the tape tells all." However, one of the best "big picture" indicators of what the market is expected to do next is inflation. Simply put, since 1962, when the model indicates that inflationary pressures are strong, stocks have lost ground. Yet, when inflationary pressures are low, the S&P 500 has gained ground at a rate in excess of 13%. The bottom line is inflation is one of the primary drivers of stock market returns.
Valuation Model Explained: If you want to get analysts really riled up, you need only to begin a discussion of market valuation. While the question of whether stocks are overvalued or undervalued appears to be a simple one, the subject is actually extremely complex. To simplify the subject dramatically, investors must first determine if they should focus on relative valuation (which include the current level of interest rates) or absolute valuation measures (the more traditional readings of Price/Earnings, Price/Dividend, and Price/Book Value). We believe that it is important to recognize that environments change. And as such, the market's focus and corresponding view of valuations are likely to change as well. Thus, we depend on our Valuation Models to help us keep our eye on the ball.
Disclosures
NOT INVESTMENT ADVICE. The opinions and forecasts expressed herein are those of Mr. David Moenning and Heritage Capital Research and may not actually come to pass. The opinions and viewpoints regarding the future of the markets should not be construed as recommendations. The analysis and information in this report is for informational purposes only. No part of the material presented in this report is intended as an investment recommendation or investment advice. Neither the information nor any opinion expressed constitutes a solicitation to purchase or sell securities or any investment program.
Any investment decisions must in all cases be made by the reader or by his or her investment adviser. Do NOT ever purchase any security without doing sufficient research. There is no guarantee that the investment objectives outlined will actually come to pass. All opinions expressed herein are subject to change without notice. Neither the editor, employees, nor any of their affiliates shall have any liability for any loss sustained by anyone who has relied on the information provided.
Mr. Moenning of Heritage Capital Research is an investment adviser representative of Eastsound Capital Advisors, LLC, a registered investment advisor. The adviser may not transact business in states where it is not appropriately registered, excluded or exempted from registration. Individualized responses to persons that involve either the effecting of transaction in securities, or the rendering of personalized investment advice for compensation, will not be made without registration or exemption.
Mr. Moenning and Heritage Capital Research may at times have positions in the securities referred to and may make purchases or sales of these securities while publications are in circulation. Positions may change at any time.
The analysis provided is based on both technical and fundamental research and is provided "as is" without warranty of any kind, either expressed or implied. Although the information contained is derived from sources which are believed to be reliable, they cannot be guaranteed.
The author neither endorses nor warrants the content of this site, any embedded advertisement, or any linked resource. The author or his managed funds may hold either long or short positions in the referenced securities. Republication rights must be expressly granted by author in writing.
Investments in equities carry an inherent element of risk including the potential for significant loss of principal. Past performance is not an indication of future results.