Has Anything Really Changed?
Greetings from London. My wife and I are spending a couple weeks exploring England and Scotland, which so far has been, as the Brits like to say, "quite lovely." Our visits to Westminster, Big Ben, Parliament, Buckingham, Kensington, Leeds Castle, Canterbury, Dover Castle and the local pubs, restaurants and taverns have been simply, "brilliant!" (P.S. My wife plans a mean trip and there is LOTS more to come including Edinburgh, St. Andrews and lost of other fun stops in Scotland.)
As I have mentioned a time or two over the years, one of the great things about traveling abroad from a business perspective is it gives me time to step back from the blinking screens and think about the big-picture. (Markets open 7-9 hours later than they do in Denver, so I can be a tourist during the day and then watch the markets over a glass of wine!) And then when markets get dicey - as they certainly have been recently - keeping the big-picture in mind can be very helpful when trying to stay in tune with the market's primary cycle.
So, let's take a moment on this fine Monday afternoon and review what we've got going on here. Please understand that I'm not talking about the daily tweets, headlines and/or market machinations. To be sure, the action has become volatile of late as prices have been driven to and fro by algos and the news flow. No, I'm talking about making sure I have a good grasp on the drivers of the action. And from my seat in a quaint little Airbnb "cottage" in Sloan Square, I conclude that there are four primary drivers here: the state of the trade war, the global central bankers, the economic data (both domestic and foreign) and perhaps most importantly, sentiment.
The Table Was Set
But first, it is important to recognize that prior to the recent dance to the downside, the table had already been "set" for our furry friends in the bear camp. Stocks had become extended to the upside. Folks were looking ahead to a series of rate cuts by all kinds of central bankers due to slowing economic data. The historical seasonal cycles were calling for a pause/pullback phase. And investor sentiment had become overly optimistic.
So, given that the market was overbought and over-believed, the bad news from the trade war acted as a trigger for some downside action. The key point here is that the pullback itself shouldn't have come as a big surprise. Remember, typically, this is a two-steps-forward, one-step-back game.
Has Anything Changed?
The next point is that when there is a sudden change in trend, it is important to try and determine if anything has changed from a macro perspective. For me the answer to this question is, not really.
Yes, the President took everyone by surprise when he ignored his advisors and decided to pile on additional tariffs on Chinese goods. And yes, the inversion of the 2/10 yield curve did become official. And yes, I also recognize that the last week's big down day was accompanied by some pretty crummy economic data out of both Germany (GDP came in at -0.1% for the quarter) and China. But the idea that stocks should suddenly tank on the technical inversion of the yield curve is borderline comical and smacks of algos gone wild.
But in reality, NONE of this is new! We all know the President likes to fly by the seat of his pants and negotiate through the press. We know that "Tariff Man" thinks his base likes his actions. We know the central banks are all trying to offset the negative impacts of the U.S./China trade war and to keep their respective economies out of a Japanese-style deflationary spiral. And to anybody that has been paying attention, #GrowthSlowing isn't exactly newsworthy at this point in time.
Hence, my position is that despite the sometimes-alarming declines in the major stock market indices, the backdrop hasn't really changed.
But...
But (you knew that was coming, right?)... This does NOT mean that investors can simply turn a blind eye to the roller coaster ride occurring on Wall Street. You see, one of the primary lessons I learned from the financial crisis and the ensuing European debt crises is that investor/consumer confidence can turn on a dime these days. Today, everyone has a news feed on their phone. Thus, everybody on the planet knows when stocks dive 800 points of fears of recession (don't get me started on this one!). Everybody knows when Germany's economy shrinks. Everybody knows that China is retaliating and has a "nuclear option" that could strike fear in the hearts of investors everywhere. And everybody knows that the trade war is causing economic problems in a LOT of places. Problems that are likely to only get worse over time.
The important thing here is that "everyone" isn't just individual investors. No. Today's "everyone" includes directors on corporate boards. CFO's. Bankers. And CEO's.
Bad News Travels Fast
Here's the problem in a nutshell. Bad news travels fast. As the saying goes, bad news travels seven times as fast as good news. And what happens when CEO's, bankers, CFO's, and individual investors get a raft of bad news? Bad news that causes the term recession to be used on an hourly basis on Wall Street? The short answer is, nothing.
No new discretionary spending. No new hiring. No new lending. And this, dear readers, is the problem. IF (note the use of capital letters) Mom & Pop get scared enough to start canceling/postponing purchases, and IF bankers become worried enough about their capital requirements that they pull in the reins on lending, and IF CEO's/CFO's start to fear a recession, the bottom line is that all of our players could stop spending those discretionary dollars. They delay the opening of that new plant. They put off hiring for a quarter or three. Oh, and that vacation home in Colorado? Fahgettaboudit.
The key point is that if you put a dent in marginal spending in a global economic expansion that is, well, marginable at best, you are left with... wait for it... the "R-Word."
Wanna see all those discretionary dollars - the dollars that mean the difference between positive and negative GDP - stop on a dime? That's right, start a trade and currency war. Flush the benefits of your tax cut right down the drain. Scare the bejeebers out of the consumer because their 401K's just dropped 15%. Yea, that's the ticket.
Yes, I can be accused of being flip here. Yea, I'm not at all happy with the fiscal/economic games being played. And yes, there is more than a hint of sarcasm being used in my meandering market missive.
But the point is that "sentiment" is a crucial part of the economic growth game here. And when you scare your players, they will simply sit on their hands. And from my seat, this is all really all it takes to create the next recession. Ughh.
The Good News
Now for the good news. This is the type of recession/scenario that can be cured quickly. Yep, that's right. Those frowns can be turned upside down in an economic heartbeat. Wanna get things going in the right direction again? No problem. Try reversing the news flow and see what happens to investor/CFO/CEO sentiment. My bet is if you "fix" the trade war (and no, I don't care what "winning" looks like here from a political standpoint - I'm just talking about the effects on the markets) and put a stop to the gloomy economic headlines, that things just might turn around.
So, let Mr. Powell knock rates down a couple more notches. Let Super Mario press play on the next round of QE. And let the administration find a way to "win" their trade war. After that, my bet is happy days will return at the corner of Broad and Wall. But until then, we should expect to see more volatility within a trading range environment, which in the big picture, isn't all that bad.
Weekly Market Model Review
Now let's turn to the weekly review of my favorite indicators and market models...
The State of My Favorite Big-Picture Market Models
It was yet another wild ride on Wall Street last week as the news flow continued to drive the action. The Primary Cycle models saw some slippage as the Risk/Reward model fell into the neutral zone and my Desert Island model lost some ground. However, I think the model remains in decent shape and we continue to believe that the readings of the Primary Cycle and Fundamental boards supports the idea that investors should treat this pullback as a buying opportunity.
This week's mean percentage score of my 6 favorite models fell to 62.8% from 71.1%% last week (Prior readings: 70.3%, 84.1%, 79%, 83.9%, 81.1%, 73.5%) while the median also dropped to 63.4% versus 70.0% last week (Prior readings: 68.4%, 86.5%, 80%, 86.7%, 82.5%, 68.5%, 66.3%).
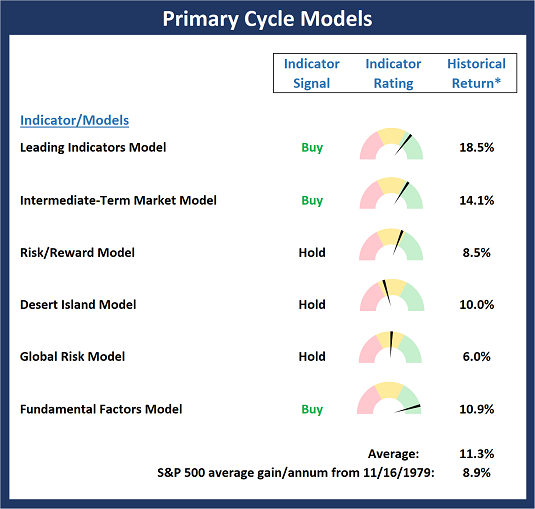
* Source: Ned Davis Research (NDR) as of the date of publication. Historical returns are hypothetical average annual performances calculated by NDR. Past performances do not guarantee future results or profitability - NOT INDIVIDUAL INVESTMENT ADVICE.
View My Favorite Market Models Online
The State of the Fundamental Backdrop
Global central bankers are all moving to ease monetary policy in an effort to fight the global slowdown made worse by the trade war - so the monetary backdrop is positive. The Economic model is still positive but is starting to show signs of wear. Earnings remain solid but are a lagging indicatory. Next, and probably most importantly this week, the Inflation model upticked but remains solidly positive. However, this remains something to watch closely.
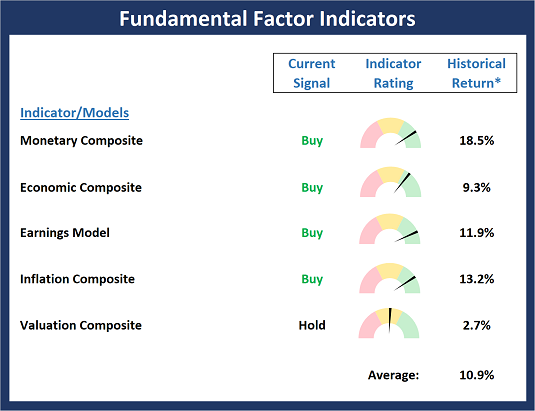
* Source: Ned Davis Research (NDR) as of the date of publication. Historical returns are hypothetical average annual performances calculated by NDR. Past performances do not guarantee future results or profitability - NOT INDIVIDUAL INVESTMENT ADVICE.
View Fundamental Indicator Board Online
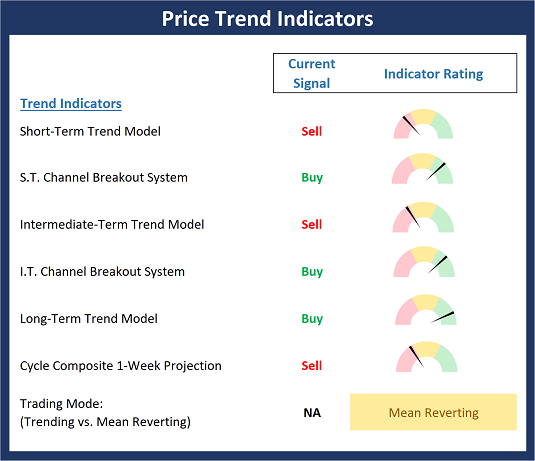
The State of the Trend
Last week, we were looking for some additional weakness and that's exactly what we got. The good news is the important support zones seen in the channel breakout systems held. As such, the bulls can continue to argue their case at this time. But with the news flow clearly driving the action on a daily basis, I for one am putting less stock on precise price levels and trends due to the fact that algo trading tends to exaggerate intraday movements.
NOT INDIVIDUAL INVESTMENT ADVICE.
View Trend Indicator Board Online
The State of Internal Momentum
The Momentum board continues to be a source of consternation as we lost a key intermediate-term indicator last week - the I.T. Breadth Model. In addition, the L.T. Volume Relationship model is positive by the skinniest of margins. As such, the message from the board is that some caution is warranted.
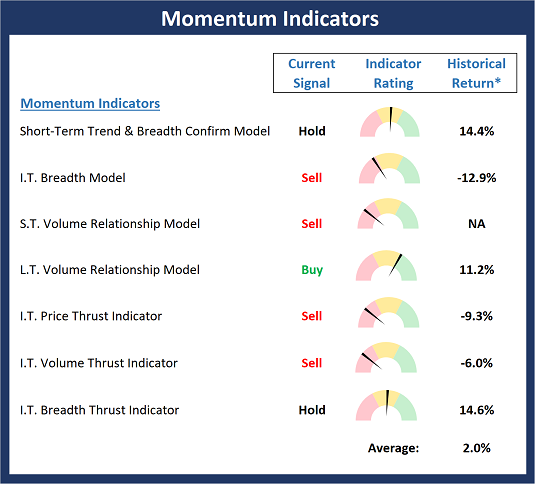
* Source: Ned Davis Research (NDR) as of the date of publication. Historical returns are hypothetical average annual performances calculated by NDR. Past performances do not guarantee future results or profitability - NOT INDIVIDUAL INVESTMENT ADVICE.
View Momentum Indicator Board Online
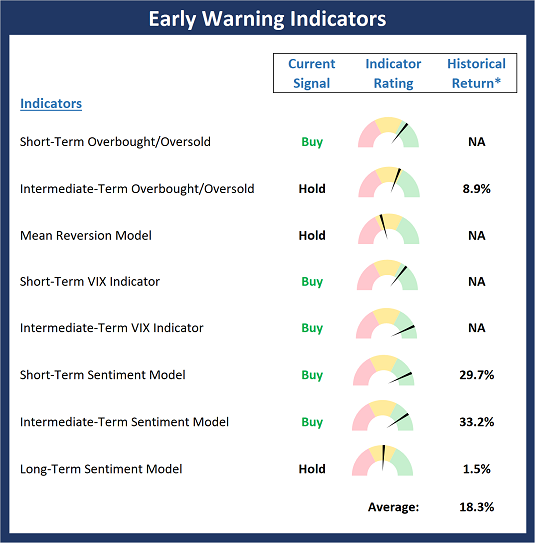
The State of the "Trade"
For the past couple weeks, I've been saying that I would not classify the current state of the Early Warning Board as a "table pounding" setup. And while this is technically still the case, the table is beginning to lean heavily toward the bull camp. However, in a perfect world, I'd like to see some additional time go by and perhaps another scary down day or two in order to reach a "table pounding" type of extreme.
* Source: Ned Davis Research (NDR) as of the date of publication. Historical returns are hypothetical average annual performances calculated by NDR. Past performances do not guarantee future results or profitability - NOT INDIVIDUAL INVESTMENT ADVICE.
View Early Warning Indicator Board Online
Thought For The Day:
There are no traffic jams along the extra mile. – Roger Staubach
Wishing you green screens and all the best for a great day,

David D. Moenning
Founder, Chief Investment Officer
Heritage Capital Research

HCR Focuses on a Risk-Managed Approach to Investing
What Risk Management Can and Cannot Do
Disclosures
At the time of publication, Mr. Moenning held long positions in the following securities mentioned: None - Note that positions may change at any time.
Leading Indicators Model: A group of indicators that have historically shown tendencies to lead the market at major turning points.
Intermediate-Term Market Model: A composite model (model of models) focused on trend and momentum indicators which has been designed to provide identify intermediate-term trading opportunities.
Risk/Reward Model: A model-of-models intended to provide an overall view of the state of the risk/reward environment. The model includes tape, monetary, and sentiment indicators as well as 7 big-picture market model readings.
Desert Island Model: If I was stranded on a desert island with access to only one market model to manage money with, this would be the model. The model is a comprehensive model-of-models comprised of trend, momentum, mean reversion, economic, monetary, sentiment, and factor-based indicators/models.
External Factors Model: A model-of-models designed to provide a reading on the "macro state" of the market environment. The model is comprised of indicators/models in the areas of various index yields, industrial production, investors sentiment, and historic volatility.
Short-Term Trend-and-Breadth Signal Explained: History shows the most reliable market moves tend to occur when the breadth indices are in gear with the major market averages. When the breadth measures diverge, investors should take note that a trend reversal may be at hand. This indicator incorporates NDR's All-Cap Dollar Weighted Equity Series and A/D Line. From 1998, when the A/D line is above its 5-day smoothing and the All-Cap Equal Weighted Equity Series is above its 25-day smoothing, the equity index has gained at a rate of +32.5% per year. When one of the indicators is above its smoothing, the equity index has gained at a rate of +13.3% per year. And when both are below, the equity index has lost +23.6% per year.
Channel Breakout System Explained: The short-term and intermediate-term Channel Breakout Systems are modified versions of the Donchian Channel indicator. According to Wikipedia, "The Donchian channel is an indicator used in market trading developed by Richard Donchian. It is formed by taking the highest high and the lowest low of the last n periods. The area between the high and the low is the channel for the period chosen."
Intermediate-Term Trend-and-Breadth Signal Explained: This indicator incorporates NDR's All-Cap Dollar Weighted Equity Series and A/D Line. From 1998, when the A/D line is above its 45-day smoothing and the All-Cap Equal Weighted Equity Series is above its 45-day smoothing, the equity index has gained at a rate of +17.6% per year. When one of the indicators is above its smoothing, the equity index has gained at a rate of +6.5% per year. And when both are below, the equity index has lost -1.3% per year.
Cycle Composite Projections: The cycle composite combines the 1-year Seasonal, 4-year Presidential, and 10-year Decennial cycles. The indicator reading shown uses the cycle projection for the upcoming week.
Trading Mode Indicator: This indicator attempts to identify whether the current trading environment is "trending" or "mean reverting." The indicator takes the composite reading of the Efficiency Ratio, the Average Correlation Coefficient, and Trend Strength models.
Volume Relationship Models: These models review the relationship between "supply" and "demand" volume over the short- and intermediate-term time frames.
Price Thrust Model Explained: This indicator measures the 3-day rate of change of the Value Line Composite relative to the standard deviation of the 30-day average. When the Value Line's 3-day rate of change have moved above 0.5 standard deviation of the 30-day average ROC, a "thrust" occurs and since 2000, the Value Line Composite has gained ground at a rate of +20.6% per year. When the indicator is below 0.5 standard deviation of the 30-day, the Value Line has lost ground at a rate of -10.0% per year. And when neutral, the Value Line has gained at a rate of +5.9% per year.
Volume Thrust Model Explained: This indicator uses NASDAQ volume data to indicate bullish and bearish conditions for the NASDAQ Composite Index. The indicator plots the ratio of the 10-day total of NASDAQ daily advancing volume (i.e., the total volume traded in stocks which rose in price each day) to the 10-day total of daily declining volume (volume traded in stocks which fell each day). This ratio indicates when advancing stocks are attracting the majority of the volume (readings above 1.0) and when declining stocks are seeing the heaviest trading (readings below 1.0). This indicator thus supports the case that a rising market supported by heavier volume in the advancing issues tends to be the most bullish condition, while a declining market with downside volume dominating confirms bearish conditions. When in a positive mode, the NASDAQ Composite has gained at a rate of +38.3% per year, When neutral, the NASDAQ has gained at a rate of +13.3% per year. And when negative, the NASDAQ has lost at a rate of -14.279% per year.
Breadth Thrust Model Explained: This indicator uses the number of NASDAQ-listed stocks advancing and declining to indicate bullish or bearish breadth conditions for the NASDAQ Composite. The indicator plots the ratio of the 10-day total of the number of stocks rising on the NASDAQ each day to the 10-day total of the number of stocks declining each day. Using 10-day totals smooths the random daily fluctuations and gives indications on an intermediate-term basis. As expected, the NASDAQ Composite performs much better when the 10-day A/D ratio is high (strong breadth) and worse when the indicator is in its lower mode (weak breadth). The most bullish conditions for the NASDAQ when the 10-day A/D indicator is not only high, but has recently posted an extreme high reading and thus indicated a thrust of upside momentum. Bearish conditions are confirmed when the indicator is low and has recently signaled a downside breadth thrust. In positive mode, the NASDAQ has gained at a rate of +22.1% per year since 1981. In a neutral mode, the NASDAQ has gained at a rate of +14.5% per year. And when in a negative mode, the NASDAQ has lost at a rate of -6.4% per year.
Short-Term Overbought/sold Indicator: This indicator is the current reading of the 14,1,3 stochastic oscillator. When the oscillator is above 80 and the %K is above the %D, the indicator gives an overbought reading. Conversely, when the oscillator is below 20 and %K is below its %D, the indicator is oversold.
Intermediate-Term Overbought/sold Indicator: This indicator is a 40-day RSI reading. When above 57.5, the indicator is considered overbought and wnen below 45 it is oversold.
Mean Reversion Model: This is a diffusion model consisting of five indicators that can produce buy and sell signals based on overbought/sold conditions.
VIX Indicator: This indicators looks at the current reading of the VIX relative to standard deviation bands. When the indicator reaches an extreme reading in either direction, it is an indication that a market trend could reverse in the near-term.
Short-Term Sentiment Indicator: This is a model-of-models composed of 18 independent sentiment indicators designed to indicate when market sentiment has reached an extreme from a short-term perspective. Historical analysis indicates that the stock market's best gains come after an environment has become extremely negative from a sentiment standpoint. Conversely, when sentiment becomes extremely positive, market returns have been subpar.
Intermediate-Term Sentiment Indicator: This is a model-of-models composed of 7 independent sentiment indicators designed to indicate when market sentiment has reached an extreme from a intermediate-term perspective. Historical analysis indicates that the stock market's best gains come after an environment has become extremely negative from a sentiment standpoint. Conversely, when sentiment becomes extremely positive, market returns have been subpar.
Long-Term Sentiment Indicator: This is a model-of-models composed of 6 independent sentiment indicators designed to indicate when market sentiment has reached an extreme from a long-term perspective. Historical analysis indicates that the stock market's best gains come after an environment has become extremely negative from a sentiment standpoint. Conversely, when sentiment becomes extremely positive, market returns have been subpar.
Absolute Monetary Model Explained: The popular cliche, "Don't fight the Fed" is really a testament to the profound impact that interest rates and Fed policy have on the market. It is a proven fact that monetary conditions are one of the most powerful influences on the direction of stock prices. The Absolute Monetary Model looks at the current level of interest rates relative to historical levels and Fed policy.
Relative Monetary Model Explained: The "relative" monetary model looks at monetary indicators relative to recent levels as well as rates of change and Fed Policy.
Economic Model Explained: During the middle of bull and bear markets, understanding the overall health of the economy and how it impacts the stock market is one of the few truly logical aspects of the stock market. When our Economic model sports a "positive" reading, history (beginning in 1965) shows that stocks enjoy returns in excess of 21% per year. Yet, when the model's reading falls into the "negative" zone, the S&P has lost nearly -25% per year. However, it is vital to understand that there are times when good economic news is actually bad for stocks and vice versa. Thus, the Economic model can help investors stay in tune with where we are in the overall economic cycle.
Inflation Model Explained: They say that "the tape tells all." However, one of the best "big picture" indicators of what the market is expected to do next is inflation. Simply put, since 1962, when the model indicates that inflationary pressures are strong, stocks have lost ground. Yet, when inflationary pressures are low, the S&P 500 has gained ground at a rate in excess of 13%. The bottom line is inflation is one of the primary drivers of stock market returns.
Valuation Model Explained: If you want to get analysts really riled up, you need only to begin a discussion of market valuation. While the question of whether stocks are overvalued or undervalued appears to be a simple one, the subject is actually extremely complex. To simplify the subject dramatically, investors must first determine if they should focus on relative valuation (which include the current level of interest rates) or absolute valuation measures (the more traditional readings of Price/Earnings, Price/Dividend, and Price/Book Value). We believe that it is important to recognize that environments change. And as such, the market's focus and corresponding view of valuations are likely to change as well. Thus, we depend on our Valuation Models to help us keep our eye on the ball.
Disclosures
NOT INVESTMENT ADVICE. The opinions and forecasts expressed herein are those of Mr. David Moenning and Heritage Capital Research and may not actually come to pass. The opinions and viewpoints regarding the future of the markets should not be construed as recommendations. The analysis and information in this report is for informational purposes only. No part of the material presented in this report is intended as an investment recommendation or investment advice. Neither the information nor any opinion expressed constitutes a solicitation to purchase or sell securities or any investment program.
Any investment decisions must in all cases be made by the reader or by his or her investment adviser. Do NOT ever purchase any security without doing sufficient research. There is no guarantee that the investment objectives outlined will actually come to pass. All opinions expressed herein are subject to change without notice. Neither the editor, employees, nor any of their affiliates shall have any liability for any loss sustained by anyone who has relied on the information provided.
Mr. Moenning of Heritage Capital Research is an investment adviser representative of Eastsound Capital Advisors, LLC, a registered investment advisor. The adviser may not transact business in states where it is not appropriately registered, excluded or exempted from registration. Individualized responses to persons that involve either the effecting of transaction in securities, or the rendering of personalized investment advice for compensation, will not be made without registration or exemption.
Mr. Moenning and Heritage Capital Research may at times have positions in the securities referred to and may make purchases or sales of these securities while publications are in circulation. Positions may change at any time.
The analysis provided is based on both technical and fundamental research and is provided "as is" without warranty of any kind, either expressed or implied. Although the information contained is derived from sources which are believed to be reliable, they cannot be guaranteed.
The author neither endorses nor warrants the content of this site, any embedded advertisement, or any linked resource. The author or his managed funds may hold either long or short positions in the referenced securities. Republication rights must be expressly granted by author in writing.
Investments in equities carry an inherent element of risk including the potential for significant loss of principal. Past performance is not an indication of future results.