Hope Springs Eternal
After the fastest decline of 30% off the top in stock market history, which presumably represented the "discounting" of the worst hit to the U.S. economy since, well, ever, stocks have since rebounded sharply. As of Friday's close, the S&P 500 has gained +32.1% since the March 23rd low. The Dow has risen +31.6%. The Midcaps (MDY) are up +39.9%. Smallcaps (IWM) have gained +35%. The NASDAQ 100 has advanced +34.6%. And don't look now fans, but the QQQ ETF is up +8.2% on the year. Yowza!
This despite the horrific unemployment numbers. The predictions for US Q2 GDP to fall in the vicinity of -30% to -40%, or more. The bankruptcies. The trillions in bailouts needed. And the mind-boggling moves Jay Powell's bunch at the Federal Reserve have made to stave off another credit crisis.
Yep, that's right folks. Despite the ongoing Coronavirus pandemic, stocks are on the rise and the consensus narrative is to look on the bright side. Be optimistic. Look ahead. It's all good!
To be sure, there are reasons to be optimistic. The new cases curve has clearly flattened in places like Italy, Spain, Germany, France, the UK, Belgium, Netherlands, Switzerland and Ireland. The curve looks to be improving in the U.S. There is very encouraging stuff happening on the vaccine front. And Jay Powell assured the nation that there is no limit to the amount of assistance the Fed can provide. Oh, and Coronavirus poster children Amazon.com (AMZN) and Facebook (FB) hit fresh all-time highs on Wednesday. Good stuff, indeed.
Optimism Knows No Bounds
The Wall Street Journal summed up the current mood nicely last week: "As has been the theme lately, stocks’ rise seems predicated on an expectation that efforts to contain the novel coronavirus will soon prove successful, allowing more businesses to open and giving people the confidence to go back doing all the things they did before the pandemic hit. It is easy to imagine ways that might not happen, but until proven otherwise investors may remain optimistic."
Optimism was clearly on display last week as analysts and pundits alike appeared to fall all over themselves trying to be more upbeat than the next guy.
For example, Tom Lee, co-founder of Fundstrat Global Advisors, told CNBC he believes the S&P 500 will hit a new high of 3,450 this year and suggested that Corporate America will bounce back. "Companies in the midst of the shutdown aren't standing still," Lee said. "They're reengineering their operations, learning how to be more digital, and run with fewer employees and less real estate. So in 2021 they're going to generate higher earnings on a lower level of sales."
CNBC's Kelly Evans joined the club by writing the following on Thursday. "The V-shaped rebound isn't a pipe dream. It's a real possibility. It may not be perfectly symmetrical--the right-hand side will be flatter, and it may not spring all the way back up--but it's a brighter prospect than anyone would have thought a few weeks ago. The market's rebound off the lows has been telling you as much. Internet stocks are already breaking out to new highs. The broader S&P is only about 12% below its previous highs. Mortgage applications are basically back (down just 1.5%) to last year's levels.
Brian Wesbury, Chief Economist at First Trust was equally upbeat. "How can the stock market rise while the economy remains down? We can think of at least four reasons: 1) Publicly listed companies didn't get there by accident. Many provide the technology it takes for us to operate in this shutdown environment, others have the resources and clout to stay open and take market share from those forced to close. 2) States are reopening and "greens shoots" of economic growth are appearing. 3) The overall US market remains undervalued. And, 4) The money supply is exploding... We think investors should stay optimistic on US equities.
Then there's Savita Subramanian, who is Head of US Equity and Quantitative Strategy at BofA. "As the economy enters what our economists forecast as the worst recession in the post war era, the market is telling us not to worry. And it is dangerous to ignore the market," Subramanian said in a note to clients. "The extreme attractiveness of stocks over bonds, particularly as rates have plummeted back to near zero, can be the catalyst for the rotation into stocks, driving the market higher."
Even the medical professionals we've come to know and trust are sounding more upbeat. Dr. Fauci said he was cautiously optimistic about the progress on a vaccine and suggested that extended "Stay Home" orders could cause irreparable damage. And Dr. Scott Gottlieb said Friday that Americans could have "some semblance of normalcy" this summer. Nice.
Where's The Beef? (er, Growth?)
As a card-carrying member of the-glass-is-at-least-half-full club, I understand that some celebration is in order over the ideas that (a) things are definitely improving and (b) the Fed appears to have taken the worst case scenario off the table. Thus, a rebound from the scary dive makes sense.
My problem lies in the outlook for growth going forward. I'm on record as suggesting that the economic recovery, which could begin quickly now that states are re-opening, isn't likely to take GDP growth rates back to pre-crisis levels any time soon. Put another way, while the shape of the recovery may start off looking like a V, I fear that slow, uncertain growth will limit how far the right side of the V can advance.
Think about it. How is anything related to travel going to get back to where it was given (a) social distancing requirements and (b) dampened demand due to health fears? The same question can be asked about the restaurant industry. And sports. And movies, etc.
In addition, I have a hunch that John Q Public and his family might just think about saving up some money. You know, for a rainy day. Or the next time a virus from nowhere hits.
All of the above represent a loss of demand for certain items. Sure, everybody wants to get back to their favorite restaurants and go on vacation. But the question is will consumers spend the same amount on these areas as they did before they knew how to spell Hydroxychloroquine, Remdesivir, and mRNA? And should we expect expenditures on these discretionary areas to see growth in the near future?
Then There's China (Again)
And finally, there is the ongoing spat with China. The cynic in me recognizes that fighting with China is politically expedient for the current administration. As such, I'm not going to be surprised if the rhetoric and threats escalate again. And we all know how much the market enjoys these little tiffs.
The Point
My point this morning is that from my seat, a lot of the good news appears to be getting priced in rapidly and well in advance of the actual news (hence the cliche, buy the rumor, sell the news). Therefore, I'm of the mind that the upside to the current joyride would appear to be limited.
No, I don't know how high is too high and we all know that market rallies such as this one can continue for some time. But I do know that Wall Street tends to overdo most things. As such, I wouldn't be surprised to see this rally become overdone at some point in the not-too distant future.
While I'd like nothing more than to be wrong here, my guess is the bears might have something to say about growth expectations at some point - and that some form of correction might ensue. We shall see.
Weekly Market Model Review
Each week we do a disciplined, deep dive into our key market indicators and models. The overall goal of this exercise is to (a) remove emotion from the investment process, (b) stay "in tune" with the primary market cycles, and (c) remain cognizant of the risk/reward environment.
The Major Market Models
We start with six of our favorite long-term market models. These models are designed to help determine the "state" of the overall market.
There are two changes to report on the Primary Cycle board this week. First, the Leading Indicators Model, which is a composite of 10 markets that tend to "lead" the coming trends over time, fell into the negative zone and produced a sell signal. To be sure, not all of this model's sell signals have been perfect, but many have been very timely. So, I'll continue to watch this model carefully. Next, the Global Risk Model upticked to neutral, which is encouraging. However, as I said last week, with no green on the board, I am forced to maintain a cautious view of the intermediate-term outlook.

* Source: Ned Davis Research (NDR) as of the date of publication. Historical returns are hypothetical average annual performances calculated by NDR. Past performances do not guarantee future results or profitability - NOT INDIVIDUAL INVESTMENT ADVICE.
View My Favorite Market Models Online
The State of the Fundamental Backdrop
Next, we review the market's fundamental factors in the areas of interest rates, the economy, inflation, and valuations.
Once again, there are also no changes to the Fundamental Factors board this week. However, I'm going to repeat what I said here last week because I believe the following point is important. I believe the efforts of the Fed and Congress amount to another green box on the Fundamental picture. In short, the stimulative measures being taken are unprecedented and assuming there is a medical solution on the horizon, these efforts will wind up limiting the damage during the decline as well as provide significant aid to the economic recovery.
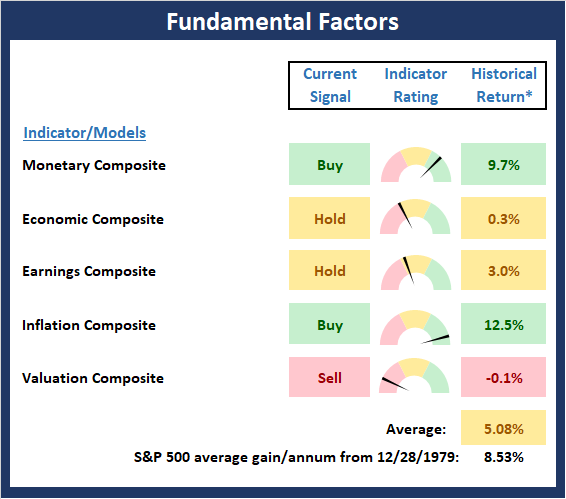
* Source: Ned Davis Research (NDR) as of the date of publication. Historical returns are hypothetical average annual performances calculated by NDR. Past performances do not guarantee future results or profitability - NOT INDIVIDUAL INVESTMENT ADVICE.
View Fundamental Indicator Board Online
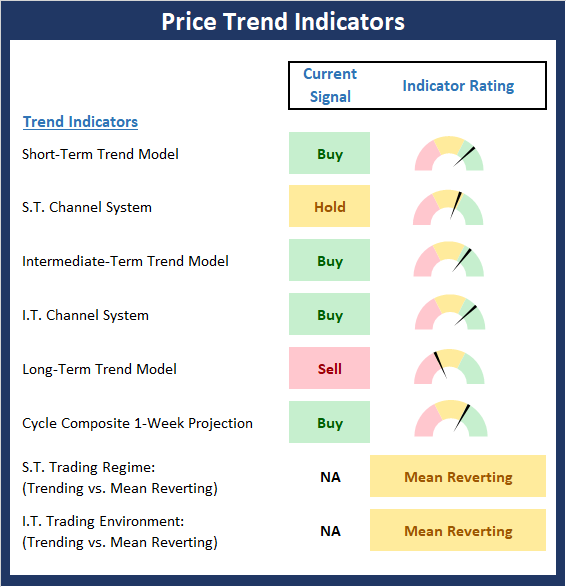
The State of the Trend
After looking at the big-picture models and the fundamental backdrop, I like to look at the state of the trend. This board of indicators is designed to tell us about the overall technical health of the current trend.
Although stocks posted a strong week, in reality, stocks were basically flat after the Moderna-induced surge that occurred at the open on Monday. The good news is that the Price Trend board is looking better these days as the bears have been unable to get anything going.
NOT INDIVIDUAL INVESTMENT ADVICE.
View Trend Indicator Board Online
The State of Internal Momentum
Next, we analyze the "oomph" behind the current trend via our group of market momentum indicators/models.
The Momentum Board experienced some indicator shuffling last week as three indicators improved and one fell. Overall, I will continue to rate the market momentum board as somewhere between high neutral and moderately positive.
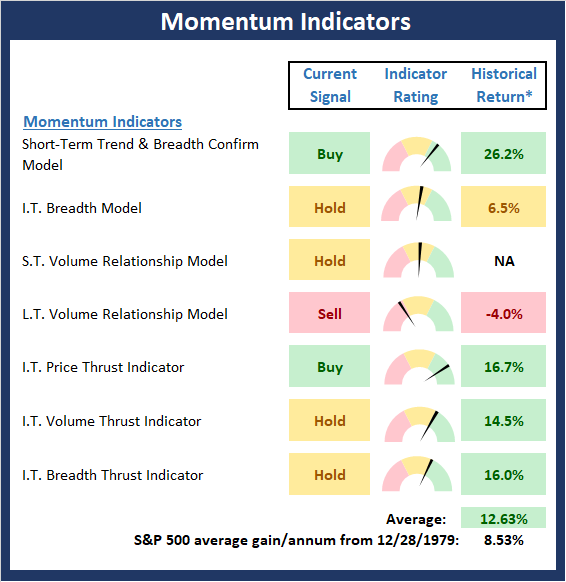
* Source: Ned Davis Research (NDR) as of the date of publication. Historical returns are hypothetical average annual performances calculated by NDR. Past performances do not guarantee future results or profitability - NOT INDIVIDUAL INVESTMENT ADVICE.
View Momentum Indicator Board Online
Early Warning Signals
Once we have identified the current environment, the state of the trend, and the degree of momentum behind the move, we then review the potential for a counter-trend move to begin. This batch of indicators is designed to suggest when the table is set for the trend to "go the other way."
A quick glance at the Early Warning board suggests that things are currently in no-man's land. However, if you look closely at the Indicator Ratings, you will see that the vast majority of the indicators are much closer to the red zone than green. Thus, I will argue that the odds still favor a counter-trend move in the near-term. However, it is also important to recognize that this has been the case for a while now and the bears have done little with the tailwind and stocks closed Friday at the top of the current trading range. Stay tuned.

* Source: Ned Davis Research (NDR) as of the date of publication. Historical returns are hypothetical average annual performances calculated by NDR. Past performances do not guarantee future results or profitability - NOT INDIVIDUAL INVESTMENT ADVICE.
View Early Warning Indicator Board Online
Thought For The Day:
Don't find fault. Find a remedy. -Henry Ford
Wishing you green screens and all the best for a great day,

David D. Moenning
Founder, Chief Investment Officer
Heritage Capital Research

Disclosures
At the time of publication, Mr. Moenning held long positions in the following securities mentioned: AMZN, FB, QQQ, MDY - Note that positions may change at any time.
Leading Indicators Model: A group of indicators that have historically shown tendencies to lead the market at major turning points.
Intermediate-Term Market Model: A composite model (model of models) focused on trend and momentum indicators which has been designed to provide identify intermediate-term trading opportunities.
Risk/Reward Model: A model-of-models intended to provide an overall view of the state of the risk/reward environment. The model includes tape, monetary, and sentiment indicators as well as 7 big-picture market model readings.
Desert Island Model: If I was stranded on a desert island with access to only one market model to manage money with, this would be the model. The model is a comprehensive model-of-models comprised of trend, momentum, mean reversion, economic, monetary, sentiment, and factor-based indicators/models.
External Factors Model: A model-of-models designed to provide a reading on the "macro state" of the market environment. The model is comprised of indicators/models in the areas of various index yields, industrial production, investors sentiment, and historic volatility.
Short-Term Trend-and-Breadth Signal Explained: History shows the most reliable market moves tend to occur when the breadth indices are in gear with the major market averages. When the breadth measures diverge, investors should take note that a trend reversal may be at hand. This indicator incorporates NDR's All-Cap Dollar Weighted Equity Series and A/D Line. From 1998, when the A/D line is above its 5-day smoothing and the All-Cap Equal Weighted Equity Series is above its 25-day smoothing, the equity index has gained at a rate of +32.5% per year. When one of the indicators is above its smoothing, the equity index has gained at a rate of +13.3% per year. And when both are below, the equity index has lost +23.6% per year.
Channel Breakout System Explained: The short-term and intermediate-term Channel Breakout Systems are modified versions of the Donchian Channel indicator. According to Wikipedia, "The Donchian channel is an indicator used in market trading developed by Richard Donchian. It is formed by taking the highest high and the lowest low of the last n periods. The area between the high and the low is the channel for the period chosen."
Intermediate-Term Trend-and-Breadth Signal Explained: This indicator incorporates NDR's All-Cap Dollar Weighted Equity Series and A/D Line. From 1998, when the A/D line is above its 45-day smoothing and the All-Cap Equal Weighted Equity Series is above its 45-day smoothing, the equity index has gained at a rate of +17.6% per year. When one of the indicators is above its smoothing, the equity index has gained at a rate of +6.5% per year. And when both are below, the equity index has lost -1.3% per year.
Cycle Composite Projections: The cycle composite combines the 1-year Seasonal, 4-year Presidential, and 10-year Decennial cycles. The indicator reading shown uses the cycle projection for the upcoming week.
Trading Mode Indicator: This indicator attempts to identify whether the current trading environment is "trending" or "mean reverting." The indicator takes the composite reading of the Efficiency Ratio, the Average Correlation Coefficient, and Trend Strength models.
Volume Relationship Models: These models review the relationship between "supply" and "demand" volume over the short- and intermediate-term time frames.
Price Thrust Model Explained: This indicator measures the 3-day rate of change of the Value Line Composite relative to the standard deviation of the 30-day average. When the Value Line's 3-day rate of change have moved above 0.5 standard deviation of the 30-day average ROC, a "thrust" occurs and since 2000, the Value Line Composite has gained ground at a rate of +20.6% per year. When the indicator is below 0.5 standard deviation of the 30-day, the Value Line has lost ground at a rate of -10.0% per year. And when neutral, the Value Line has gained at a rate of +5.26% per year.
Volume Thrust Model Explained: This indicator uses NASDAQ volume data to indicate bullish and bearish conditions for the NASDAQ Composite Index. The indicator plots the ratio of the 10-day total of NASDAQ daily advancing volume (i.e., the total volume traded in stocks which rose in price each day) to the 10-day total of daily declining volume (volume traded in stocks which fell each day). This ratio indicates when advancing stocks are attracting the majority of the volume (readings above 1.0) and when declining stocks are seeing the heaviest trading (readings below 1.0). This indicator thus supports the case that a rising market supported by heavier volume in the advancing issues tends to be the most bullish condition, while a declining market with downside volume dominating confirms bearish conditions. When in a positive mode, the NASDAQ Composite has gained at a rate of +38.3% per year, When neutral, the NASDAQ has gained at a rate of +13.3% per year. And when negative, the NASDAQ has lost at a rate of -15.269% per year.
Breadth Thrust Model Explained: This indicator uses the number of NASDAQ-listed stocks advancing and declining to indicate bullish or bearish breadth conditions for the NASDAQ Composite. The indicator plots the ratio of the 10-day total of the number of stocks rising on the NASDAQ each day to the 10-day total of the number of stocks declining each day. Using 10-day totals smooths the random daily fluctuations and gives indications on an intermediate-term basis. As expected, the NASDAQ Composite performs much better when the 10-day A/D ratio is high (strong breadth) and worse when the indicator is in its lower mode (weak breadth). The most bullish conditions for the NASDAQ when the 10-day A/D indicator is not only high, but has recently posted an extreme high reading and thus indicated a thrust of upside momentum. Bearish conditions are confirmed when the indicator is low and has recently signaled a downside breadth thrust. In positive mode, the NASDAQ has gained at a rate of +22.1% per year since 1981. In a neutral mode, the NASDAQ has gained at a rate of +14.5% per year. And when in a negative mode, the NASDAQ has lost at a rate of -6.4% per year.
Short-Term Overbought/sold Indicator: This indicator is the current reading of the 14,1,3 stochastic oscillator. When the oscillator is above 80 and the %K is above the %D, the indicator gives an overbought reading. Conversely, when the oscillator is below 20 and %K is below its %D, the indicator is oversold.
Intermediate-Term Overbought/sold Indicator: This indicator is a 40-day RSI reading. When above 57.5, the indicator is considered overbought and wnen below 45 it is oversold.
Mean Reversion Model: This is a diffusion model consisting of five indicators that can produce buy and sell signals based on overbought/sold conditions.
VIX Indicator: This indicators looks at the current reading of the VIX relative to standard deviation bands. When the indicator reaches an extreme reading in either direction, it is an indication that a market trend could reverse in the near-term.
Short-Term Sentiment Indicator: This is a model-of-models composed of 18 independent sentiment indicators designed to indicate when market sentiment has reached an extreme from a short-term perspective. Historical analysis indicates that the stock market's best gains come after an environment has become extremely negative from a sentiment standpoint. Conversely, when sentiment becomes extremely positive, market returns have been subpar.
Intermediate-Term Sentiment Indicator: This is a model-of-models composed of 7 independent sentiment indicators designed to indicate when market sentiment has reached an extreme from a intermediate-term perspective. Historical analysis indicates that the stock market's best gains come after an environment has become extremely negative from a sentiment standpoint. Conversely, when sentiment becomes extremely positive, market returns have been subpar.
Long-Term Sentiment Indicator: This is a model-of-models composed of 6 independent sentiment indicators designed to indicate when market sentiment has reached an extreme from a long-term perspective. Historical analysis indicates that the stock market's best gains come after an environment has become extremely negative from a sentiment standpoint. Conversely, when sentiment becomes extremely positive, market returns have been subpar.
Absolute Monetary Model Explained: The popular cliche, "Don't fight the Fed" is really a testament to the profound impact that interest rates and Fed policy have on the market. It is a proven fact that monetary conditions are one of the most powerful influences on the direction of stock prices. The Absolute Monetary Model looks at the current level of interest rates relative to historical levels and Fed policy.
Relative Monetary Model Explained: The "relative" monetary model looks at monetary indicators relative to recent levels as well as rates of change and Fed Policy.
Economic Model Explained: During the middle of bull and bear markets, understanding the overall health of the economy and how it impacts the stock market is one of the few truly logical aspects of the stock market. When our Economic model sports a "positive" reading, history (beginning in 1965) shows that stocks enjoy returns in excess of 21% per year. Yet, when the model's reading falls into the "negative" zone, the S&P has lost nearly -25% per year. However, it is vital to understand that there are times when good economic news is actually bad for stocks and vice versa. Thus, the Economic model can help investors stay in tune with where we are in the overall economic cycle.
Inflation Model Explained: They say that "the tape tells all." However, one of the best "big picture" indicators of what the market is expected to do next is inflation. Simply put, since 1962, when the model indicates that inflationary pressures are strong, stocks have lost ground. Yet, when inflationary pressures are low, the S&P 500 has gained ground at a rate in excess of 13%. The bottom line is inflation is one of the primary drivers of stock market returns.
Valuation Model Explained: If you want to get analysts really riled up, you need only to begin a discussion of market valuation. While the question of whether stocks are overvalued or undervalued appears to be a simple one, the subject is actually extremely complex. To simplify the subject dramatically, investors must first determine if they should focus on relative valuation (which include the current level of interest rates) or absolute valuation measures (the more traditional readings of Price/Earnings, Price/Dividend, and Price/Book Value). We believe that it is important to recognize that environments change. And as such, the market's focus and corresponding view of valuations are likely to change as well. Thus, we depend on our Valuation Models to help us keep our eye on the ball.
Disclosures
NOT INVESTMENT ADVICE. The opinions and forecasts expressed herein are those of Mr. David Moenning and Heritage Capital Research and may not actually come to pass. The opinions and viewpoints regarding the future of the markets should not be construed as recommendations. The analysis and information in this report is for informational purposes only. No part of the material presented in this report is intended as an investment recommendation or investment advice. Neither the information nor any opinion expressed constitutes a solicitation to purchase or sell securities or any investment program.
Any investment decisions must in all cases be made by the reader or by his or her investment adviser. Do NOT ever purchase any security without doing sufficient research. There is no guarantee that the investment objectives outlined will actually come to pass. All opinions expressed herein are subject to change without notice. Neither the editor, employees, nor any of their affiliates shall have any liability for any loss sustained by anyone who has relied on the information provided.
Mr. Moenning of Heritage Capital Research is an investment adviser representative of Eastsound Capital Advisors, LLC, a registered investment advisor. The adviser may not transact business in states where it is not appropriately registered, excluded or exempted from registration. Individualized responses to persons that involve either the effecting of transaction in securities, or the rendering of personalized investment advice for compensation, will not be made without registration or exemption.
Mr. Moenning and Heritage Capital Research may at times have positions in the securities referred to and may make purchases or sales of these securities while publications are in circulation. Positions may change at any time.
The analysis provided is based on both technical and fundamental research and is provided "as is" without warranty of any kind, either expressed or implied. Although the information contained is derived from sources which are believed to be reliable, they cannot be guaranteed.
The author neither endorses nor warrants the content of this site, any embedded advertisement, or any linked resource. The author or his managed funds may hold either long or short positions in the referenced securities. Republication rights must be expressly granted by author in writing.
Investments in equities carry an inherent element of risk including the potential for significant loss of principal. Past performance is not an indication of future results.