Is it Time to Worry or Look Ahead?
Happy Monday and welcome to the final month of 2019, where the bulls will be hoping to avoid a repeat of last year's epic December collapse and the bears are looking to capitalize on an overbought condition.
From a short-term perspective, it looks as if the much-anticipated pullback, correction, or pause is officially underway. The culprit for the current 240-point dance to the downside looks to be two-fold this morning. First there is the President's apparent waffling on a trade deal. Trump said that while China still wants to make a deal on trade, "we'll see what happens."
Second, and likely more importantly, the most recent update on the economy came in on the punk side this morning. The Institute for Supply Management reported that the ISM Manufacturing PMI in the U.S. slipped to 48.1 in November. The report is problematic for a few reasons. First, the reading was well below consensus expectations of 49.4. Second, the reading was below last month's 48.3. Third, recall that readings below the all-important 50-line indicate contraction in the manufacturing sector. Next, it is worth noting that New Orders component index slumped to 47.2 from 49.1. And finally, November's PMI was the fourth consecutive reading below the 50-level.
Although everybody knows that it's a struggle out there in manufacturing-land and that the American consumer is the real star of the show - being responsible for something like 70% to 80% of US GDP - the size of the PMI miss looks to have taken traders by surprise. As such, the "bad news" appears to have provided traders a catalyst to do some selling in a market that had become very overbought and sentiment was overly optimistic.
So, is this it? Has the top for the cyclical bull that began nearly a year ago on 12/26/18 been put in? Will we start discounting a full-blown recession from here?
Or... Is this simply a pullback within an established uptrend? A pause that refreshes, if you will.
The bears argue that with the manufacturing sector in a mild recession and many parts of the world also struggling mightily from an economic perspective, the rest of the U.S. economy will likely follow suit and begin to slide. Thus, our furry friends suggest that it won't be long before we are all talking about the "R Word" again.
On the other sideline, the bulls are quick to point out that there are several reasons to remain hopeful. Our heroes in horns remind us it rarely pays to fight the Fed - or the rest of the central bankers that are currently in "easy money" mode. That the global slowdown could be bottoming out. That the earnings slowdown is temporary. That the American consumer is doing just fine, thank you. And that a trade deal, when it gets done, is likely to remove the negative overhang in terms of CEO sentiment and could easily release a fair amount of pent up economic activity. As such, those seeing the glass as at least half full contend that growth should re-accelerate once a deal is signed.
The bulls also remind us that stocks rarely move in a straight line to the upside. Well, except for periods such as January 2018, that is, and we all know how that turned out. No, usually, stocks tend to advance in a two/three-steps-forward and one-step-back fashion. Thus, pullbacks are part of the game and to be expected.
From my seat, the real tell will be how low the bears can get the market to go here. Given the shrinking number of days left on the calendar in 2019 and the idea that a great many managers are behind their benchmarks this year due to some ill-fated risk management efforts early in the year, one can argue that any/all dips are likely to be bought here. If this is to be the case, we should expect to see those dip buyers come in early and often when things get nasty.
If the bulls are to prevail here, I would expect to see the major indices remain in an uptrend and avoid any kind of oversold condition. I'd expect to see intraday buying come in today or tomorrow. And I'd expect to see the current leadership remain intact.
However, should the dark side prevail and sentiment towards the market/economic outlook becomes dour, one could argue that a test of the breakout zone around S&P 3030 could happen. And if that fails, then I'd expect to see the gap on the chart down at 2948.46 to be filled. Both moves would surely scare the bejeebers out of investors, especially if they were to occur before year-end.
And for those looking to further the recession argument, it is interesting to note that yields are actually rising this morning. This after a fairly big miss on the PMI. Typically, one would expect to see rates falling on weak economic data, not rising. Interesting.
Gun to the head, my thinking is we are seeing a type of pause or sloppy period in the stock market as traders mark time until the December 15 tariff deadline passes. If the White House insists on more tariffs, rest assured stocks will decline. And if China gets what it wants and tariffs are rolled back as part of the Phase One deal, then stocks will likely look ahead to better days.
Weekly Market Model Review
Each week we do a disciplined, deep dive into our key market indicators and models. The overall goal of this exercise is to (a) remove emotion from the investment process, (b) stay "in tune" with the primary market cycles, and (c) remain cognizant of the risk/reward environment.
The Major Market Models
We start with six of our favorite long-term market models. These models are designed to help determine the "state" of the overall market.
With all the negative talk about the state of global economies, it might be surprising to see the Global Risk model uptick into the positive zone. From my seat, the model's move from yellow to green suggests that foreign markets are beginning to discount better days ahead. To be sure, we are seeing improvements in European markets as the now globally synchronized easy monetary policy works its way through the system. And while a pause in the action in the near-term wouldn't be surprising, the Primary Cycle board tells us that the bulls remain in control here from a big-picture perspective.
This week's mean percentage score of my 6 favorite market models improved to 75.6% from 73.3% while the median also upticked to 75.0% from 70%.

* Source: Ned Davis Research (NDR) as of the date of publication. Historical returns are hypothetical average annual performances calculated by NDR. Past performances do not guarantee future results or profitability - NOT INDIVIDUAL INVESTMENT ADVICE.
View My Favorite Market Models Online
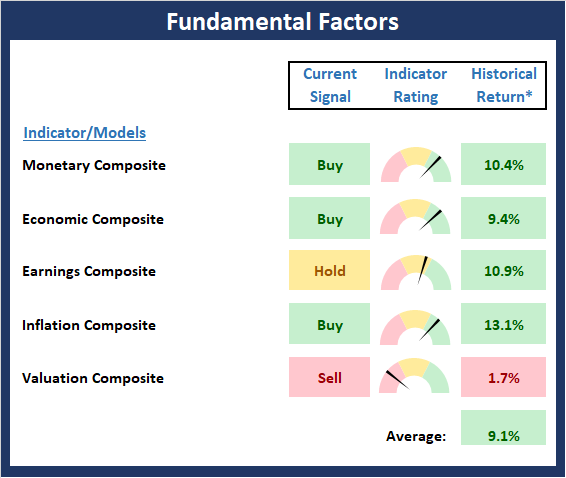
The State of the Fundamental Backdrop
Next, we review the market's fundamental factors in the areas of interest rates, the economy, inflation, and valuations.
There were no changes to Fundamental Factors board again this week. My takeaway continues to be that while valuations aren't cheap and our earnings models are slouching a bit, the bulls can take solace in the fact that the global central banks remain friendly, inflation is low, and the economy appears to be growing - albeit at a less than robust pace. But, I'm of the mind that this combination is likely to give the bulls the edge as we head into 2020.
* Source: Ned Davis Research (NDR) as of the date of publication. Historical returns are hypothetical average annual performances calculated by NDR. Past performances do not guarantee future results or profitability - NOT INDIVIDUAL INVESTMENT ADVICE.
View Fundamental Indicator Board Online
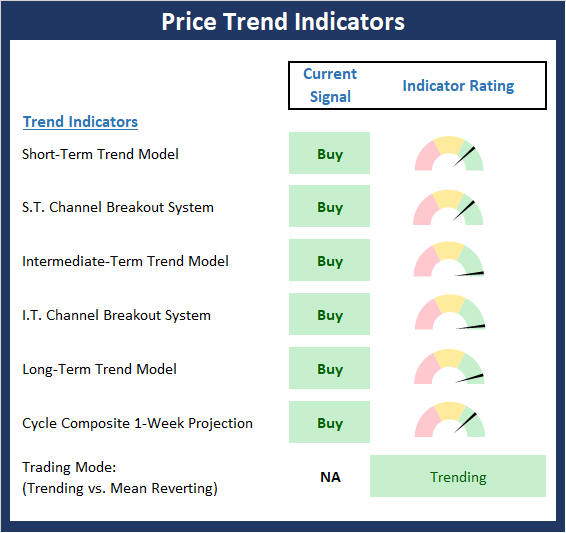
The State of the Trend
From there, we look at the state of the current trend. This board of indicators is designed to tell us about the overall technical health of the current trend.
There can be little argument that the trend appears to be a stock investor's friend here. Yet, the message from the Early Warning board is also clear: A pullback, a correction, or at the very least, a pause in the uptrend is to be expected. As such, a test of the trend (and the bulls' resolve) wouldn't surprise anyone at this stage of the game. Yet, given the state of both the Primary Cycle and Fundamental boards reminds us that any pullback would likely present an opportunity.
NOT INDIVIDUAL INVESTMENT ADVICE.
View Trend Indicator Board Online
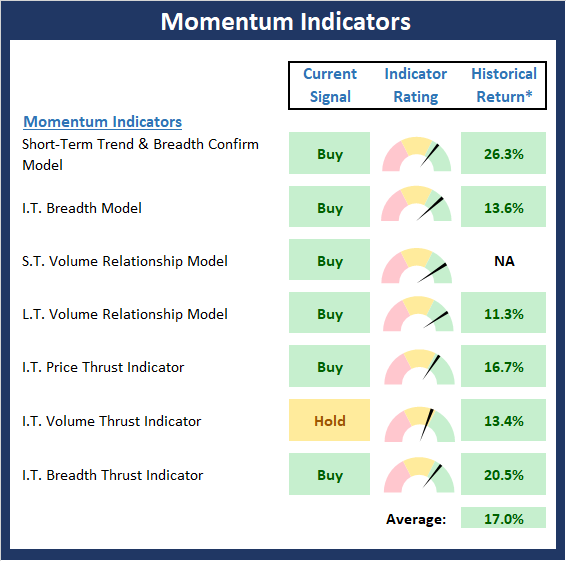
The State of Internal Momentum
Next, we analyze the "oomph" behind the current trend via our group of market momentum indicators/models.
Last week, I noted that some weakness was starting to creep into several of the Momentum Board's component indicators. This week, we should note that both the S.T. Trend & Breadth Confirm indicator and the I.T. Breadth Thrust indicator upticked into their respective positive zone, but by the skinniest of margins. As such, I will contend that momentum is not as strong as all the green on the board might suggest and that if if the bulls have eyes on further gains, they'd best find a way to get some oomph behind the move.
* Source: Ned Davis Research (NDR) as of the date of publication. Historical returns are hypothetical average annual performances calculated by NDR. Past performances do not guarantee future results or profitability - NOT INDIVIDUAL INVESTMENT ADVICE.
View Momentum Indicator Board Online
Early Warning Signals
Once we have identified the current environment, the state of the trend, and the degree of momentum behind the move, we review the potential for a counter-trend move to begin. This batch of indicators is designed to suggest when the table is set for the trend to "go the other way."
Although a couple indicators on the Early Warning board have flip-flopped, my takeaway from the board continues to be that the table is set for the bears from a short-term perspective. However, as is usually the case after a strong advance, the bears will need some sort of catalyst to get any meaningful downside activity started. And I continue to believe that any snag in the "Phase One" trade deal could easily do the trick. So, with the 12/15 deadline for additional tariffs quickly approaching, I wouldn't be surprised to see traders start to lean a little cautious.

* Source: Ned Davis Research (NDR) as of the date of publication. Historical returns are hypothetical average annual performances calculated by NDR. Past performances do not guarantee future results or profitability - NOT INDIVIDUAL INVESTMENT ADVICE.
View Early Warning Indicator Board Online
Thought For The Day:
Learning is not child's play; we cannot learn without pain. -Aristotle
Wishing you green screens and all the best for a great day,

David D. Moenning
Founder, Chief Investment Officer
Heritage Capital Research

Disclosures
At the time of publication, Mr. Moenning held long positions in the following securities mentioned: None - Note that positions may change at any time.
Leading Indicators Model: A group of indicators that have historically shown tendencies to lead the market at major turning points.
Intermediate-Term Market Model: A composite model (model of models) focused on trend and momentum indicators which has been designed to provide identify intermediate-term trading opportunities.
Risk/Reward Model: A model-of-models intended to provide an overall view of the state of the risk/reward environment. The model includes tape, monetary, and sentiment indicators as well as 7 big-picture market model readings.
Desert Island Model: If I was stranded on a desert island with access to only one market model to manage money with, this would be the model. The model is a comprehensive model-of-models comprised of trend, momentum, mean reversion, economic, monetary, sentiment, and factor-based indicators/models.
External Factors Model: A model-of-models designed to provide a reading on the "macro state" of the market environment. The model is comprised of indicators/models in the areas of various index yields, industrial production, investors sentiment, and historic volatility.
Short-Term Trend-and-Breadth Signal Explained: History shows the most reliable market moves tend to occur when the breadth indices are in gear with the major market averages. When the breadth measures diverge, investors should take note that a trend reversal may be at hand. This indicator incorporates NDR's All-Cap Dollar Weighted Equity Series and A/D Line. From 1998, when the A/D line is above its 5-day smoothing and the All-Cap Equal Weighted Equity Series is above its 25-day smoothing, the equity index has gained at a rate of +32.5% per year. When one of the indicators is above its smoothing, the equity index has gained at a rate of +13.3% per year. And when both are below, the equity index has lost +23.6% per year.
Channel Breakout System Explained: The short-term and intermediate-term Channel Breakout Systems are modified versions of the Donchian Channel indicator. According to Wikipedia, "The Donchian channel is an indicator used in market trading developed by Richard Donchian. It is formed by taking the highest high and the lowest low of the last n periods. The area between the high and the low is the channel for the period chosen."
Intermediate-Term Trend-and-Breadth Signal Explained: This indicator incorporates NDR's All-Cap Dollar Weighted Equity Series and A/D Line. From 1998, when the A/D line is above its 45-day smoothing and the All-Cap Equal Weighted Equity Series is above its 45-day smoothing, the equity index has gained at a rate of +17.6% per year. When one of the indicators is above its smoothing, the equity index has gained at a rate of +6.5% per year. And when both are below, the equity index has lost -1.3% per year.
Cycle Composite Projections: The cycle composite combines the 1-year Seasonal, 4-year Presidential, and 10-year Decennial cycles. The indicator reading shown uses the cycle projection for the upcoming week.
Trading Mode Indicator: This indicator attempts to identify whether the current trading environment is "trending" or "mean reverting." The indicator takes the composite reading of the Efficiency Ratio, the Average Correlation Coefficient, and Trend Strength models.
Volume Relationship Models: These models review the relationship between "supply" and "demand" volume over the short- and intermediate-term time frames.
Price Thrust Model Explained: This indicator measures the 3-day rate of change of the Value Line Composite relative to the standard deviation of the 30-day average. When the Value Line's 3-day rate of change have moved above 0.5 standard deviation of the 30-day average ROC, a "thrust" occurs and since 2000, the Value Line Composite has gained ground at a rate of +20.6% per year. When the indicator is below 0.5 standard deviation of the 30-day, the Value Line has lost ground at a rate of -10.0% per year. And when neutral, the Value Line has gained at a rate of +5.9% per year.
Volume Thrust Model Explained: This indicator uses NASDAQ volume data to indicate bullish and bearish conditions for the NASDAQ Composite Index. The indicator plots the ratio of the 10-day total of NASDAQ daily advancing volume (i.e., the total volume traded in stocks which rose in price each day) to the 10-day total of daily declining volume (volume traded in stocks which fell each day). This ratio indicates when advancing stocks are attracting the majority of the volume (readings above 1.0) and when declining stocks are seeing the heaviest trading (readings below 1.0). This indicator thus supports the case that a rising market supported by heavier volume in the advancing issues tends to be the most bullish condition, while a declining market with downside volume dominating confirms bearish conditions. When in a positive mode, the NASDAQ Composite has gained at a rate of +38.3% per year, When neutral, the NASDAQ has gained at a rate of +13.3% per year. And when negative, the NASDAQ has lost at a rate of -14.279% per year.
Breadth Thrust Model Explained: This indicator uses the number of NASDAQ-listed stocks advancing and declining to indicate bullish or bearish breadth conditions for the NASDAQ Composite. The indicator plots the ratio of the 10-day total of the number of stocks rising on the NASDAQ each day to the 10-day total of the number of stocks declining each day. Using 10-day totals smooths the random daily fluctuations and gives indications on an intermediate-term basis. As expected, the NASDAQ Composite performs much better when the 10-day A/D ratio is high (strong breadth) and worse when the indicator is in its lower mode (weak breadth). The most bullish conditions for the NASDAQ when the 10-day A/D indicator is not only high, but has recently posted an extreme high reading and thus indicated a thrust of upside momentum. Bearish conditions are confirmed when the indicator is low and has recently signaled a downside breadth thrust. In positive mode, the NASDAQ has gained at a rate of +22.1% per year since 1981. In a neutral mode, the NASDAQ has gained at a rate of +14.5% per year. And when in a negative mode, the NASDAQ has lost at a rate of -6.4% per year.
Short-Term Overbought/sold Indicator: This indicator is the current reading of the 14,1,3 stochastic oscillator. When the oscillator is above 80 and the %K is above the %D, the indicator gives an overbought reading. Conversely, when the oscillator is below 20 and %K is below its %D, the indicator is oversold.
Intermediate-Term Overbought/sold Indicator: This indicator is a 40-day RSI reading. When above 57.5, the indicator is considered overbought and wnen below 45 it is oversold.
Mean Reversion Model: This is a diffusion model consisting of five indicators that can produce buy and sell signals based on overbought/sold conditions.
VIX Indicator: This indicators looks at the current reading of the VIX relative to standard deviation bands. When the indicator reaches an extreme reading in either direction, it is an indication that a market trend could reverse in the near-term.
Short-Term Sentiment Indicator: This is a model-of-models composed of 18 independent sentiment indicators designed to indicate when market sentiment has reached an extreme from a short-term perspective. Historical analysis indicates that the stock market's best gains come after an environment has become extremely negative from a sentiment standpoint. Conversely, when sentiment becomes extremely positive, market returns have been subpar.
Intermediate-Term Sentiment Indicator: This is a model-of-models composed of 7 independent sentiment indicators designed to indicate when market sentiment has reached an extreme from a intermediate-term perspective. Historical analysis indicates that the stock market's best gains come after an environment has become extremely negative from a sentiment standpoint. Conversely, when sentiment becomes extremely positive, market returns have been subpar.
Long-Term Sentiment Indicator: This is a model-of-models composed of 6 independent sentiment indicators designed to indicate when market sentiment has reached an extreme from a long-term perspective. Historical analysis indicates that the stock market's best gains come after an environment has become extremely negative from a sentiment standpoint. Conversely, when sentiment becomes extremely positive, market returns have been subpar.
Absolute Monetary Model Explained: The popular cliche, "Don't fight the Fed" is really a testament to the profound impact that interest rates and Fed policy have on the market. It is a proven fact that monetary conditions are one of the most powerful influences on the direction of stock prices. The Absolute Monetary Model looks at the current level of interest rates relative to historical levels and Fed policy.
Relative Monetary Model Explained: The "relative" monetary model looks at monetary indicators relative to recent levels as well as rates of change and Fed Policy.
Economic Model Explained: During the middle of bull and bear markets, understanding the overall health of the economy and how it impacts the stock market is one of the few truly logical aspects of the stock market. When our Economic model sports a "positive" reading, history (beginning in 1965) shows that stocks enjoy returns in excess of 21% per year. Yet, when the model's reading falls into the "negative" zone, the S&P has lost nearly -25% per year. However, it is vital to understand that there are times when good economic news is actually bad for stocks and vice versa. Thus, the Economic model can help investors stay in tune with where we are in the overall economic cycle.
Inflation Model Explained: They say that "the tape tells all." However, one of the best "big picture" indicators of what the market is expected to do next is inflation. Simply put, since 1962, when the model indicates that inflationary pressures are strong, stocks have lost ground. Yet, when inflationary pressures are low, the S&P 500 has gained ground at a rate in excess of 13%. The bottom line is inflation is one of the primary drivers of stock market returns.
Valuation Model Explained: If you want to get analysts really riled up, you need only to begin a discussion of market valuation. While the question of whether stocks are overvalued or undervalued appears to be a simple one, the subject is actually extremely complex. To simplify the subject dramatically, investors must first determine if they should focus on relative valuation (which include the current level of interest rates) or absolute valuation measures (the more traditional readings of Price/Earnings, Price/Dividend, and Price/Book Value). We believe that it is important to recognize that environments change. And as such, the market's focus and corresponding view of valuations are likely to change as well. Thus, we depend on our Valuation Models to help us keep our eye on the ball.
Disclosures
NOT INVESTMENT ADVICE. The opinions and forecasts expressed herein are those of Mr. David Moenning and Heritage Capital Research and may not actually come to pass. The opinions and viewpoints regarding the future of the markets should not be construed as recommendations. The analysis and information in this report is for informational purposes only. No part of the material presented in this report is intended as an investment recommendation or investment advice. Neither the information nor any opinion expressed constitutes a solicitation to purchase or sell securities or any investment program.
Any investment decisions must in all cases be made by the reader or by his or her investment adviser. Do NOT ever purchase any security without doing sufficient research. There is no guarantee that the investment objectives outlined will actually come to pass. All opinions expressed herein are subject to change without notice. Neither the editor, employees, nor any of their affiliates shall have any liability for any loss sustained by anyone who has relied on the information provided.
Mr. Moenning of Heritage Capital Research is an investment adviser representative of Eastsound Capital Advisors, LLC, a registered investment advisor. The adviser may not transact business in states where it is not appropriately registered, excluded or exempted from registration. Individualized responses to persons that involve either the effecting of transaction in securities, or the rendering of personalized investment advice for compensation, will not be made without registration or exemption.
Mr. Moenning and Heritage Capital Research may at times have positions in the securities referred to and may make purchases or sales of these securities while publications are in circulation. Positions may change at any time.
The analysis provided is based on both technical and fundamental research and is provided "as is" without warranty of any kind, either expressed or implied. Although the information contained is derived from sources which are believed to be reliable, they cannot be guaranteed.
The author neither endorses nor warrants the content of this site, any embedded advertisement, or any linked resource. The author or his managed funds may hold either long or short positions in the referenced securities. Republication rights must be expressly granted by author in writing.
Investments in equities carry an inherent element of risk including the potential for significant loss of principal. Past performance is not an indication of future results.