Is There Any Upside From Here?
Let's review. The S&P 500 is just 5 days removed from its most recent all-time high. Central bankers around the globe are either cutting rates or getting ready to cut rates. Economic growth is slowing. Earnings in the U.S. continue to beat estimates (although the bar for the current season appears to be sitting on the ground). Inflation is nowhere to be found. And the trade war between the U.S. and China looks like it is destined to drag on (at least until election season heats up next year).
Cutting to the chase, our furry friends in the bear camp argue that the trade war will drag the global economy into recession - and the U.S. along with it. And we all know what happens to stock prices when the "R Word" starts being bandied about.
Our heroes in horns pulling the bull bandwagon tell us to never, ever "fight the Fed" and that everything will be fine.
Given that the stock market tends to be a discounting mechanism for future expectations, it looks to me like "Ms. Market" is leaning bullish these days. In short, stocks appear to be looking ahead to better days. Days when the trade war is over, interest rates are lower, and the economies of the world are improving.
Personally, I can get on board with the bulls' argument here. Since central bankers in general and the U.S. Fed specifically tend to "get what they want" when they are on a mission, it makes sense to embrace the "Don't fight the Fed" mantra and stay seated on the bull train.
The Question Is...
But (you knew that was coming, right?)... The question of the day is, can stocks go any higher from here without any of the bull camp's hopes/dreams coming true? In other words, can stocks move up in a meaningful way without any proof that things are actually getting better?
This is where the concept of the appropriate market multiple comes in. You see, there are times when investors are gaga for stocks and are willing to pay just about anything due to future expectations (think 1998/99). Then there are other times when folks are completely uncertain about the road ahead and demand lower prices for their investment in a dollar's worth of earnings (early 2009 comes to mind here).
Let's Look at Valuations
In order to try and determine if stocks are cheap or expensive and, in turn, whether the indices have any upside from here, let's take a look at the valuation picture. In this case, I'm going to focus on the Price-to-Earnings ratio of the S&P 500 using operating earnings.
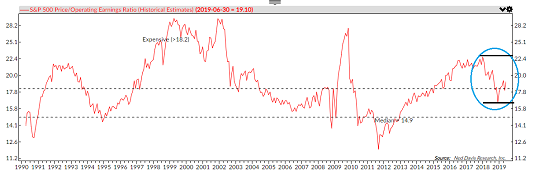
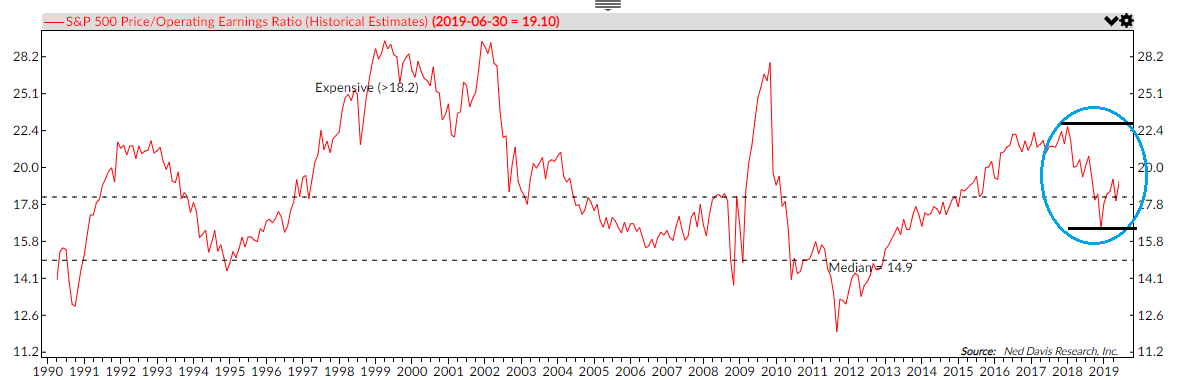
The chart below, from the folks at Ned Davis Research, is the S&P 500's P/E Ratio based on operating earnings plotted monthly back to 1990.
View Larger Chart
Source: Ned Davis Research
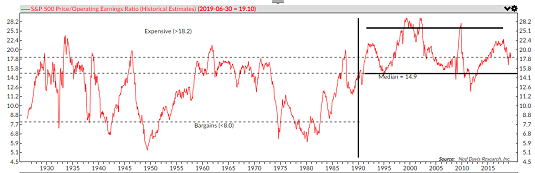
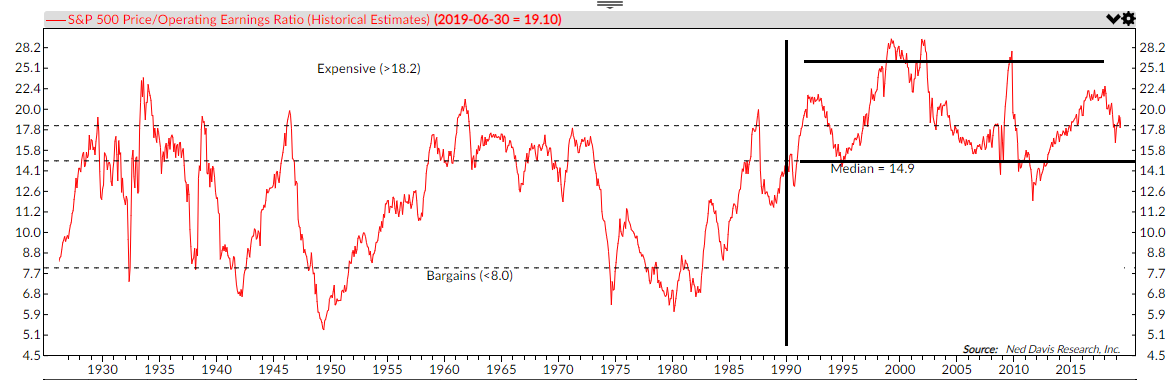
Okay, let's get to the numbers. Currently (as of 6/30), the S&P's Operating Earnings P/E stands at 19.1. According to NDR, this is in the "expensive" zone and well above the historical median of 14.9. However, it is important to recognize that NDR's assessment of the "expensive" zone as well as the median P/E goes back to 1926.
I choose to start in 1990 as I believe this is when the market's valuation range began to shift. I contend that this shift occurred due to 401K's replacing defined benefit pensions and the resulting ongoing demand for stocks. The chart below illustrates my view on the subject nicely...
View Larger Chart
Source: Ned Davis Research
So, in what I'll call the "current era" of the market's P/E ratio (since 1990), a reading of 19.1 looks to be, well, middle of the road.
Next, let's focus on the most recent range. The high-water mark seen on 1/31/2018 was 22.4 and the low level of 16.5 occurred on 12/31/2018. Again, I'll contend that the current reading is in the middle.
The point is that from a near-term perspective, my take is stocks are neither cheap nor expensive. And given the uncertainties facing investors these days in term of the trade war and economic growth, this seems about right.
Let's Look Ahead
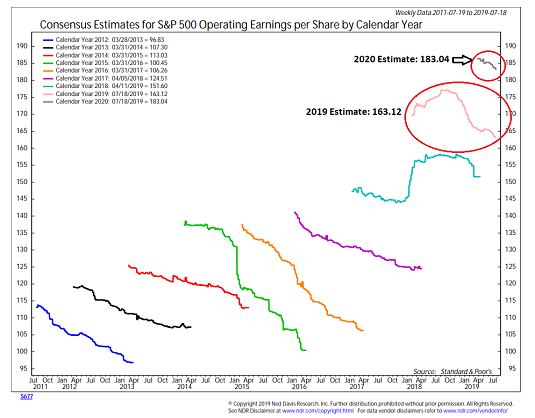
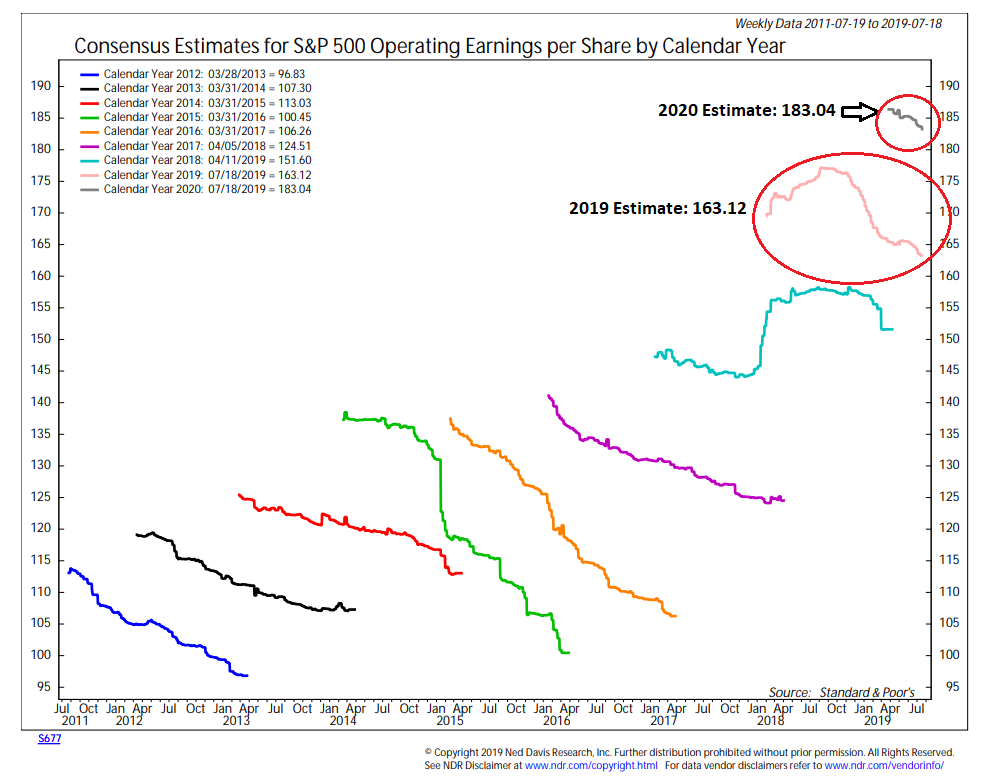
Since we're now officially in the back half of 2019, it's time to look ahead to where analysts expect earnings to be next year. Currently, the consensus estimate for earnings per share (EPS) on the S&P 500 for 2019 stands at $163.12 (Source: Standard & Poor's). It is important to note that this number has continued to drift lower throughout the year due to the impact of trade and #GrowthSlowing.
For 2020, the consensus estimate for S&P EPS stands at $183.04. Granted, it's very early in the game, but it's what we have to work with at the present time.
View Larger Chart
Source: Ned Davis Research
First, we need to recognize that as the chart above illustrates, EPS estimates tend to start out too high and are adjusted lower over time. Thus, we should probably expect EPS for next year to trend lower.
But using current numbers, if we apply a 19.1 multiple to EPS of $183.04, we get 3507, which would put the S&:P 500 17.8% higher than Friday's close.
Next, let's apply the most recent range of P/E's to the EPS estimate for 2020. At the low end is 16.5, which gives us 3030 - or just 1.8% above Friday's close.
And on the high end, $183.04 times 22 equals 4040, or 35.7% higher from current readings.
Yea, But...
I know what you're thinking. And I agree, 2020's actual EPS is likely to be below where current estimates reside. With the exception of 2018 (where analysts had to adjust EPS up throughout the year due to the tax cuts), this is usually the case.
So, if we knock the consensus of $183.04 down by 10%, we get $165.27. At 19.1 times earnings, we get 3157, which is 6.1% higher than Friday's close. And if we get to "giddy" times again in the market (where investors are willing to pony up due to improving expectations), a 22 multiple puts the S&P at 3636 - or 30% higher than here.
The Takeaway
The takeaway from this back-of-the-napkin approach is that if the economy doesn't slow meaningfully, then yes, there could be upside in the stock market from here. Perhaps substantial upside.
However, if the gaggle of central bankers can't keep the economies of the world from entering a recession, there could be problems. But, of course, we knew that already. Such is the game of multiple expansion/contraction.
Weekly Market Model Review
Now let's turn to the weekly review of my favorite indicators and market models...
The State of My Favorite Big-Picture Market Models
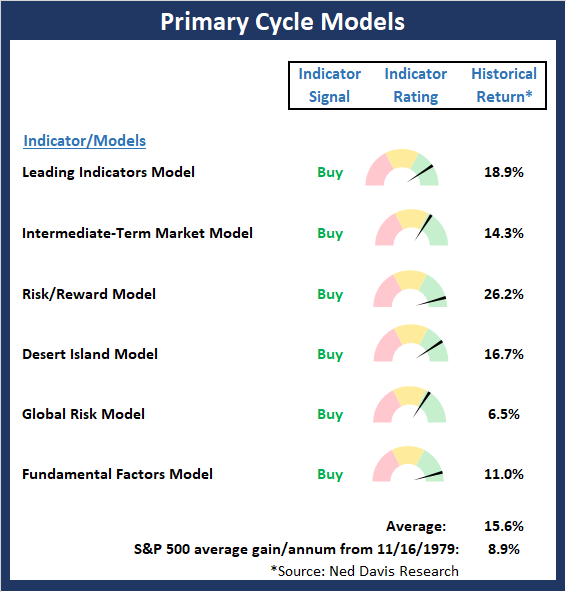
Once again, there are no changes to the Primary Cycle board this week. The models designed to indicate the state of the big-picture market cycle are in pretty good shape. And since the inevitable pullback/sloppy period we had been anticipating appears to upon us, the Primary Cycle board tells us to think about the current weakness as an opportunity to add exposure.
This week's mean percentage score of my 6 favorite models slipped to 79% from 83.9% last week (Prior readings: 81.1%, 73.5%, 62.9%, 65.4%, 62.9%, 60%) while the median also pulled back to to 80.0% versus 86.7% last week (Prior readings: 82.5%, 68.5%, 66.3%, 71.3%, 68.8%, 62.5%, 62.5%).
View My Favorite Market Models Online
The State of the Fundamental Backdrop
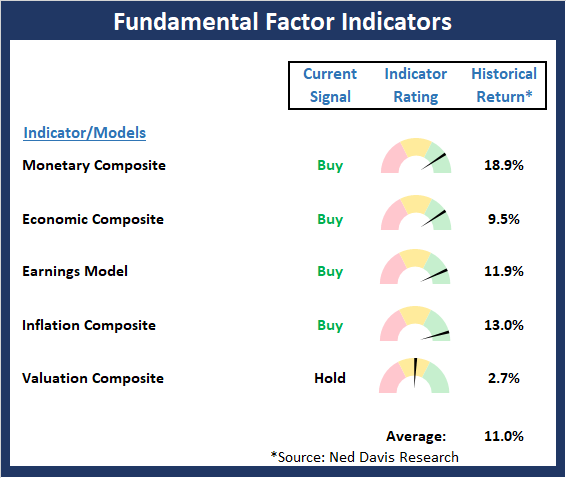
The has been no movement in our Fundamental indicators and the board remains positive overall.
View Fundamental Indicator Board Online
The State of the Trend
The shorter-term trend indicators took a hit last week as an overdue pullback took hold. A test of the 2950 level would appear to be a logical retrace of the current summer rally. However, it is important to recognize that the longer-term indicators remain positive on balance. Finally, it is worth noting that the cycle projection suggests a pause is to be expected in the coming weeks.
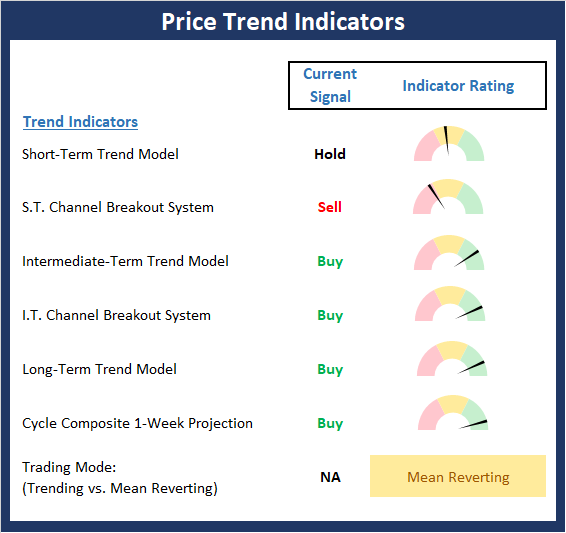
View Trend Indicator Board Online
The State of Internal Momentum
So far at least, the current pullback is following the script as we had been looking for a short/shallow corrective phase to begin. Watching the Momentum board will be important going forward. While there has been some weakening, the overall "state" of the board remains constructive. As such, the bulls should be given the benefit of any doubt.

View Momentum Indicator Board Online
The State of the "Trade"
We had written recently that the table looked to be set for some corrective action but that it was not (yet?) a "table pounding" situation. Now that the pullback has begun, some of the Early Warning indicators (which can be thought of as pendulums) are already starting to swing the other way. The bottom line is the EW board leans bearish, but not meaningfully so.
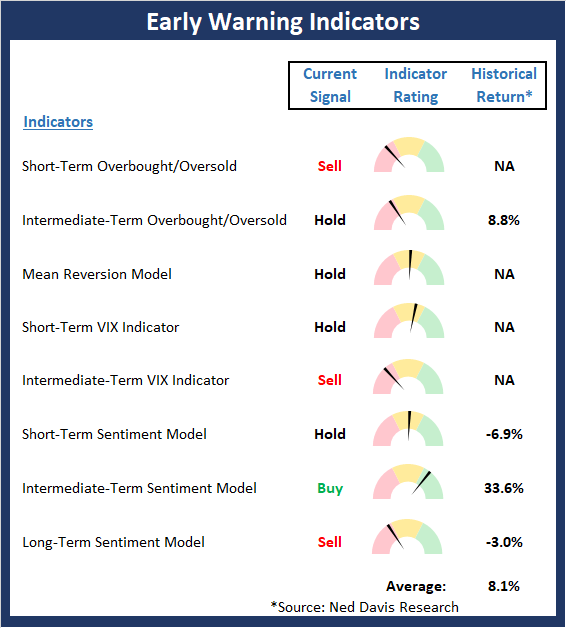
View Early Warning Indicator Board Online
Thought For The Day:
The secret of happiness is to count your blessings while others are adding up their troubles -William Penn
Wishing you green screens and all the best for a great day,

David D. Moenning
Founder, Chief Investment Officer
Heritage Capital Research

HCR Focuses on a Risk-Managed Approach to Investing
What Risk Management Can and Cannot Do
Disclosures
At the time of publication, Mr. Moenning held long positions in the following securities mentioned: None - Note that positions may change at any time.
Leading Indicators Model: A group of indicators that have historically shown tendencies to lead the market at major turning points.
Intermediate-Term Market Model: A composite model (model of models) focused on trend and momentum indicators which has been designed to provide identify intermediate-term trading opportunities.
Risk/Reward Model: A model-of-models intended to provide an overall view of the state of the risk/reward environment. The model includes tape, monetary, and sentiment indicators as well as 7 big-picture market model readings.
Desert Island Model: If I was stranded on a desert island with access to only one market model to manage money with, this would be the model. The model is a comprehensive model-of-models comprised of trend, momentum, mean reversion, economic, monetary, sentiment, and factor-based indicators/models.
External Factors Model: A model-of-models designed to provide a reading on the "macro state" of the market environment. The model is comprised of indicators/models in the areas of various index yields, industrial production, investors sentiment, and historic volatility.
Short-Term Trend-and-Breadth Signal Explained: History shows the most reliable market moves tend to occur when the breadth indices are in gear with the major market averages. When the breadth measures diverge, investors should take note that a trend reversal may be at hand. This indicator incorporates NDR's All-Cap Dollar Weighted Equity Series and A/D Line. From 1998, when the A/D line is above its 5-day smoothing and the All-Cap Equal Weighted Equity Series is above its 25-day smoothing, the equity index has gained at a rate of +32.5% per year. When one of the indicators is above its smoothing, the equity index has gained at a rate of +13.3% per year. And when both are below, the equity index has lost +23.6% per year.
Channel Breakout System Explained: The short-term and intermediate-term Channel Breakout Systems are modified versions of the Donchian Channel indicator. According to Wikipedia, "The Donchian channel is an indicator used in market trading developed by Richard Donchian. It is formed by taking the highest high and the lowest low of the last n periods. The area between the high and the low is the channel for the period chosen."
Intermediate-Term Trend-and-Breadth Signal Explained: This indicator incorporates NDR's All-Cap Dollar Weighted Equity Series and A/D Line. From 1998, when the A/D line is above its 45-day smoothing and the All-Cap Equal Weighted Equity Series is above its 45-day smoothing, the equity index has gained at a rate of +17.6% per year. When one of the indicators is above its smoothing, the equity index has gained at a rate of +6.5% per year. And when both are below, the equity index has lost -1.3% per year.
Cycle Composite Projections: The cycle composite combines the 1-year Seasonal, 4-year Presidential, and 10-year Decennial cycles. The indicator reading shown uses the cycle projection for the upcoming week.
Trading Mode Indicator: This indicator attempts to identify whether the current trading environment is "trending" or "mean reverting." The indicator takes the composite reading of the Efficiency Ratio, the Average Correlation Coefficient, and Trend Strength models.
Volume Relationship Models: These models review the relationship between "supply" and "demand" volume over the short- and intermediate-term time frames.
Price Thrust Model Explained: This indicator measures the 3-day rate of change of the Value Line Composite relative to the standard deviation of the 30-day average. When the Value Line's 3-day rate of change have moved above 0.5 standard deviation of the 30-day average ROC, a "thrust" occurs and since 2000, the Value Line Composite has gained ground at a rate of +20.6% per year. When the indicator is below 0.5 standard deviation of the 30-day, the Value Line has lost ground at a rate of -10.0% per year. And when neutral, the Value Line has gained at a rate of +5.9% per year.
Volume Thrust Model Explained: This indicator uses NASDAQ volume data to indicate bullish and bearish conditions for the NASDAQ Composite Index. The indicator plots the ratio of the 10-day total of NASDAQ daily advancing volume (i.e., the total volume traded in stocks which rose in price each day) to the 10-day total of daily declining volume (volume traded in stocks which fell each day). This ratio indicates when advancing stocks are attracting the majority of the volume (readings above 1.0) and when declining stocks are seeing the heaviest trading (readings below 1.0). This indicator thus supports the case that a rising market supported by heavier volume in the advancing issues tends to be the most bullish condition, while a declining market with downside volume dominating confirms bearish conditions. When in a positive mode, the NASDAQ Composite has gained at a rate of +38.3% per year, When neutral, the NASDAQ has gained at a rate of +13.3% per year. And when negative, the NASDAQ has lost at a rate of -14.279% per year.
Breadth Thrust Model Explained: This indicator uses the number of NASDAQ-listed stocks advancing and declining to indicate bullish or bearish breadth conditions for the NASDAQ Composite. The indicator plots the ratio of the 10-day total of the number of stocks rising on the NASDAQ each day to the 10-day total of the number of stocks declining each day. Using 10-day totals smooths the random daily fluctuations and gives indications on an intermediate-term basis. As expected, the NASDAQ Composite performs much better when the 10-day A/D ratio is high (strong breadth) and worse when the indicator is in its lower mode (weak breadth). The most bullish conditions for the NASDAQ when the 10-day A/D indicator is not only high, but has recently posted an extreme high reading and thus indicated a thrust of upside momentum. Bearish conditions are confirmed when the indicator is low and has recently signaled a downside breadth thrust. In positive mode, the NASDAQ has gained at a rate of +22.1% per year since 1981. In a neutral mode, the NASDAQ has gained at a rate of +14.5% per year. And when in a negative mode, the NASDAQ has lost at a rate of -6.4% per year.
Short-Term Overbought/sold Indicator: This indicator is the current reading of the 14,1,3 stochastic oscillator. When the oscillator is above 80 and the %K is above the %D, the indicator gives an overbought reading. Conversely, when the oscillator is below 20 and %K is below its %D, the indicator is oversold.
Intermediate-Term Overbought/sold Indicator: This indicator is a 40-day RSI reading. When above 57.5, the indicator is considered overbought and wnen below 45 it is oversold.
Mean Reversion Model: This is a diffusion model consisting of five indicators that can produce buy and sell signals based on overbought/sold conditions.
VIX Indicator: This indicators looks at the current reading of the VIX relative to standard deviation bands. When the indicator reaches an extreme reading in either direction, it is an indication that a market trend could reverse in the near-term.
Short-Term Sentiment Indicator: This is a model-of-models composed of 18 independent sentiment indicators designed to indicate when market sentiment has reached an extreme from a short-term perspective. Historical analysis indicates that the stock market's best gains come after an environment has become extremely negative from a sentiment standpoint. Conversely, when sentiment becomes extremely positive, market returns have been subpar.
Intermediate-Term Sentiment Indicator: This is a model-of-models composed of 7 independent sentiment indicators designed to indicate when market sentiment has reached an extreme from a intermediate-term perspective. Historical analysis indicates that the stock market's best gains come after an environment has become extremely negative from a sentiment standpoint. Conversely, when sentiment becomes extremely positive, market returns have been subpar.
Long-Term Sentiment Indicator: This is a model-of-models composed of 6 independent sentiment indicators designed to indicate when market sentiment has reached an extreme from a long-term perspective. Historical analysis indicates that the stock market's best gains come after an environment has become extremely negative from a sentiment standpoint. Conversely, when sentiment becomes extremely positive, market returns have been subpar.
Absolute Monetary Model Explained: The popular cliche, "Don't fight the Fed" is really a testament to the profound impact that interest rates and Fed policy have on the market. It is a proven fact that monetary conditions are one of the most powerful influences on the direction of stock prices. The Absolute Monetary Model looks at the current level of interest rates relative to historical levels and Fed policy.
Relative Monetary Model Explained: The "relative" monetary model looks at monetary indicators relative to recent levels as well as rates of change and Fed Policy.
Economic Model Explained: During the middle of bull and bear markets, understanding the overall health of the economy and how it impacts the stock market is one of the few truly logical aspects of the stock market. When our Economic model sports a "positive" reading, history (beginning in 1965) shows that stocks enjoy returns in excess of 21% per year. Yet, when the model's reading falls into the "negative" zone, the S&P has lost nearly -25% per year. However, it is vital to understand that there are times when good economic news is actually bad for stocks and vice versa. Thus, the Economic model can help investors stay in tune with where we are in the overall economic cycle.
Inflation Model Explained: They say that "the tape tells all." However, one of the best "big picture" indicators of what the market is expected to do next is inflation. Simply put, since 1962, when the model indicates that inflationary pressures are strong, stocks have lost ground. Yet, when inflationary pressures are low, the S&P 500 has gained ground at a rate in excess of 13%. The bottom line is inflation is one of the primary drivers of stock market returns.
Valuation Model Explained: If you want to get analysts really riled up, you need only to begin a discussion of market valuation. While the question of whether stocks are overvalued or undervalued appears to be a simple one, the subject is actually extremely complex. To simplify the subject dramatically, investors must first determine if they should focus on relative valuation (which include the current level of interest rates) or absolute valuation measures (the more traditional readings of Price/Earnings, Price/Dividend, and Price/Book Value). We believe that it is important to recognize that environments change. And as such, the market's focus and corresponding view of valuations are likely to change as well. Thus, we depend on our Valuation Models to help us keep our eye on the ball.
Disclosures
NOT INVESTMENT ADVICE. The opinions and forecasts expressed herein are those of Mr. David Moenning and Heritage Capital Research and may not actually come to pass. The opinions and viewpoints regarding the future of the markets should not be construed as recommendations. The analysis and information in this report is for informational purposes only. No part of the material presented in this report is intended as an investment recommendation or investment advice. Neither the information nor any opinion expressed constitutes a solicitation to purchase or sell securities or any investment program.
Any investment decisions must in all cases be made by the reader or by his or her investment adviser. Do NOT ever purchase any security without doing sufficient research. There is no guarantee that the investment objectives outlined will actually come to pass. All opinions expressed herein are subject to change without notice. Neither the editor, employees, nor any of their affiliates shall have any liability for any loss sustained by anyone who has relied on the information provided.
Mr. Moenning of Heritage Capital Research is an investment adviser representative of Eastsound Capital Advisors, LLC, a registered investment advisor. The adviser may not transact business in states where it is not appropriately registered, excluded or exempted from registration. Individualized responses to persons that involve either the effecting of transaction in securities, or the rendering of personalized investment advice for compensation, will not be made without registration or exemption.
Mr. Moenning and Heritage Capital Research may at times have positions in the securities referred to and may make purchases or sales of these securities while publications are in circulation. Positions may change at any time.
The analysis provided is based on both technical and fundamental research and is provided "as is" without warranty of any kind, either expressed or implied. Although the information contained is derived from sources which are believed to be reliable, they cannot be guaranteed.
The author neither endorses nor warrants the content of this site, any embedded advertisement, or any linked resource. The author or his managed funds may hold either long or short positions in the referenced securities. Republication rights must be expressly granted by author in writing.
Investments in equities carry an inherent element of risk including the potential for significant loss of principal. Past performance is not an indication of future results.