Looking Ahead To Better Days
It is my sincere hope that everyone remains healthy, is being diligent with their social distancing, and is surviving the new virtual work world reality. Since my kids are now all adults and I've had a home office since 2001, my days haven't changed much - well, except for the daily market freak outs, of course!
However, if I rewind my life back to when my kids were little, I must admit that trying to balance working from home and keeping everybody happy and occupied might have been a bit challenging. Although, who am I kidding, my wife is a champion with kids and would have "handled" the situation for me!
Turning to the markets, it will suffice to say that I've been a little busy lately as everybody wants to get a handle on how/why the market is doing what it is doing. And since there are so many points to consider here, this week I'm once again going to present a rapid-fire summary of what I see from my seat.
If you'd prefer to listen to some of my main points, I did an interview on WGN 720 radio in Chicago over the weekend. The funny part about the interview is the segment was part of a sports talk show. The producer said that since there wasn't much to talk about in the sports world these days now that baseball, basketball, and hockey are on hold and the ink is now dry on the Nick Foles deal, they needed to focus on what their audience is talking about. Namely, the virus, their money, and the markets/economy. So, if you are interested, here's a link to the segment.
Caveats
First, let me say once again that I do not manage money based on market predictions or gut hunches. As I've stated a time or twenty, I don't know anyone that has been able to "call" the market's next move with any consistency over time. So, I prefer to use what I call a "rules guided" approach to managing the risks in the markets.
Next, I'd like to repeat what I said last week. I do not know where the bottom is on this crisis/panic-driven decline. No one does. Anybody who pretends to know how low the market will go and/or where bond yields are going to level off at should be ignored.
Big Picture Take
We are seeing a waterfall decline (aka a "bad news panic" or "crash") driven by three issues:
- 1. The coronavirus pandemic and the associated threats to our health and the economy
- 2. The crash in oil prices caused by the turf war between the Saudis and Russia
- 3. The dysfunction, illiquidity, and dislocations happening in the bond/credit markets
It is important to recognize that this "triple threat" is being led by the daily dose of horrible news on the virus front. But we can't simply dismiss the other two issues as I believe they are playing an important role in the ongoing plunge in stocks.
Forced Liquidations
Another key part of the massive declines seen in the stock market is there continues to be "forced liquidations" in the market. This can take many forms including capital requirement failures such as we saw on Friday as the CME Group was forced to auction off Ronin Capital's holdings. There's also margin calls, hedge fund "blow ups," and mutual fund redemptions. All of the above cause securities of all kinds to be dumped on the market without regard to price.
"It's the Economy, Stupid"
As we discussed last week, the stock market is in the process of discounting the impact this crisis will have on the economy. To be sure, this is a fast-moving situation. Last Monday at this time, JPMorgan (JPM) was calling for Q1 GDP to fall about 2.5% and for Q2 to decline by -4%. Two days later, their Q2 forecast was changed to -14%. The next day, Goldman (GS) issued a forecast for -24%. And this morning, Morgan Stanley puts the damage at -30%. Yikes.
The point is that the situation is changing fast, which is leading to even faster moves in the stock market as traders attempt to discount the new reality.
A Self-Inflicted Wound
But at the same time, we need to recognize that this economic downturn isn't like any other because it is a self-inflicted wound. In short, the plan to flatten the curve of the virus is to create a sudden stop in the economy. The country is doing this on purpose. Once the virus threat has passed, I think we can assume that the consumer will resume spending money. And armed with some extra cash from Uncle Sam, it is safe to say that there will be pent up demand.
The Fed is on the Case
I have to say that I've been impressed with the Fed's actions. Unlike 2008, Jay Powell & Co. are acting swiftly. And this morning's "anything it takes" proclamation is encouraging. In short, the Fed is implementing their 2008 crisis playbook, and doing it quickly in order to not let things get out of hand.
Will the Fiscal Stimulus Solve the Problem?
In a word, no. However, from my seat, the goal of the stimulus is to lessen the impact of this crisis on the consumer and the economy.
What if the Fiscal Stimulus is Delayed?
If you will recall, Congress initially voted down Hank Paulsen's TARP bill during the Financial Crisis. The response from the stock market wasn't pretty. As such, today's decline shouldn't surprise anyone. But I have to believe that Congress will get this done - and quickly. I think lawmakers understand that a week of bickering would be disastrous for the stock market. Here's hoping we get a bill today or tomorrow.
How Low Can Stocks Go?
The question on everyone's mind - especially after another huge drop in the major indices - is, how low can stocks go? Obviously, we don't know the answer here. But we do know some things.
- We are seeing the emotional "panic" phase here
- The current decline discounts a healthy amount of bad news
- Valuations have improved - I got a buy signal on my weekly Value Line P/E indicator this morning
- The Global Central Bankers are doing a good job
- Fiscal stimulus is on the way
- We have a guide to follow in terms of the virus
- We have a guide to follow in terms of market behavior going forward
Keys to a Bottom
From my perch, there are a few things to look for/expect as we approach the initial "panic" low...
- Good news on the virus. We want to see the number of new cases begin to decline. This will take time.
- Stability in oil prices. This will help.
- Stability in credit markets. This is a necessity. Watch symbol LQD for signs of improvement.
- The "dead cat bounce" - After the panic low, stocks tend to experience a "sigh of relief" rally. Expect this to be breathtaking and give you the feeling that everything will be fine.
- "Enough is enough" - At some point, values will be obvious and real buyers will emerge
- The "retest" phase. After the initial bounce, bad news returns, and stocks move back toward the initial low.
- Heed the second buy signal. One of the lessons I've learned is that when markets crash, you want to ignore the first buy signal or bounce. Unless of course, something occurs that "fixes" the situation (Example: The Fed changing course in early January 2019). Assuming stocks experience a "retest," THIS is when it is usually a good point to put your offense back on the field.
- Look for a Breadth Thrust. A key signal that the market has bottomed, and that a new bull market is about to begin is a "breadth thrust." This is when the number of advancing issues/volume swamps decliners over a period of a couple weeks. There are many forms of this indicators and we track several on a weekly basis.
Reasons to Stay Positive
It is VERY easy to be negative here. But I think there are several reasons to have an optimistic view about the future.
- We've seen this movie before, and the hero doesn't die in the end!
- The powers that be (central bankers and governments) are on the case. The bottom line is this will help on the other side.
- The economic downturn is likely to be temporary.
- The market is likely to follow the "Crash Playbook"
- There is big money to be made by the biotech/pharma companies that can produce relief from the virus. My bet is these folks are working their tails off to be first.
- Bear markets eventually give way to bull markets.
- The average bull market gains between 86% and 106% (source: Ned Davis Research)
- This means that a very good opportunity to make some real money lies ahead.
Summing Up
There can be no argument that this market is unpleasant. And the pain of the decline is definitely mounting.
However, it is important to remember that there will be money-making opportunities ahead. Think about where things will be one year from now... two years from now. Once the market recovers - and it will - think about how you would like to play the beginning of the new bull market. Will you be one who waits for "proof" that everything is okay? Or will you be one who tries to turn this debacle into an opportunity?
Using the benefit of hindsight, it is always easy to see what you "should have done." My question is, why should now be any different?
Weekly Market Model Review
Each week we do a disciplined, deep dive into our key market indicators and models. The overall goal of this exercise is to (a) remove emotion from the investment process, (b) stay "in tune" with the primary market cycles, and (c) remain cognizant of the risk/reward environment.
The Major Market Models
We start with six of our favorite long-term market models. These models are designed to help determine the "state" of the overall market.
There was one important change to report on the Primary Cycle board as the Intermediate-Term Market Model moved to a sell signal early in the week. From my seat, this tips the board's overall rating from neutral to moderately negative. The bottom line is stocks are now entrenched in a cyclical bear market within the context of a secular bull.
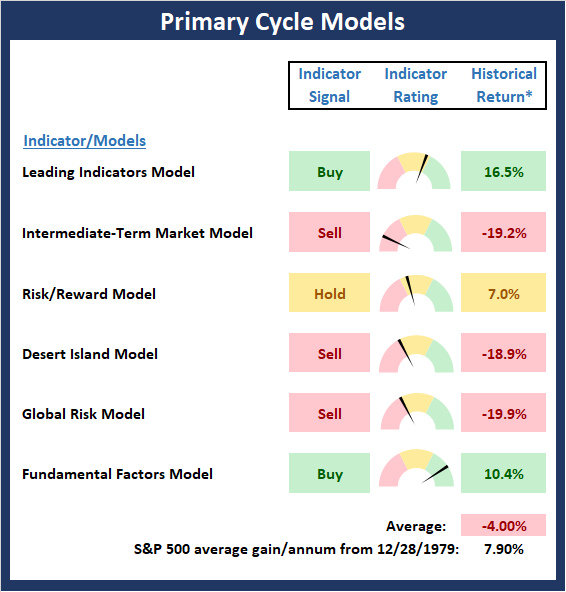
* Source: Ned Davis Research (NDR) as of the date of publication. Historical returns are hypothetical average annual performances calculated by NDR. Past performances do not guarantee future results or profitability - NOT INDIVIDUAL INVESTMENT ADVICE.
View My Favorite Market Models Online
The State of the Fundamental Backdrop
Next, we review the market's fundamental factors in the areas of interest rates, the economy, inflation, and valuations.
There are no obvious changes to report on the Fundamental Factors board this week. However, it is worth noting that one the component models in the Valuation Composite (the P/E ratio on the Value Line Index) moved into the positive zone this week. I would expect to see further improvement in this area - but unfortunately, the remainder of the indicators/models contained in the valuation composite are only updated monthly/quarterly. Next, I think it is important to recognize that the fundamental models are not built to handle a self-inflicted, sudden halt to economic activity in response to a pandemic health emergency. As such, I think we must look ahead and try to ascertain what the economic outlook will be once the primary wave of the coronavirus passes. Of course, this is easier said than done. My working thesis is that the economy will likely recover quickly once the emergency ends. However, the question is how strong the rebound will be. Stay tuned.
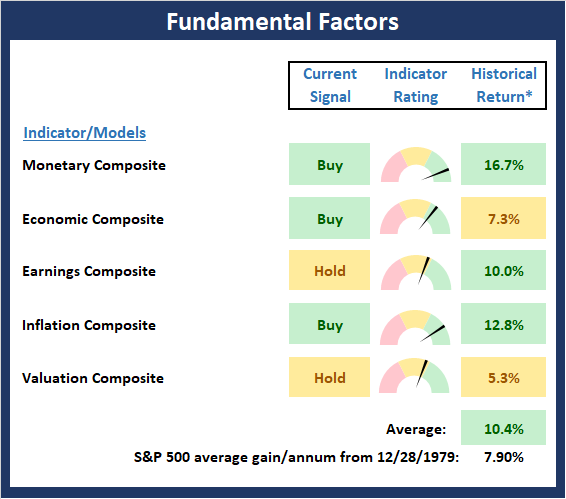
* Source: Ned Davis Research (NDR) as of the date of publication. Historical returns are hypothetical average annual performances calculated by NDR. Past performances do not guarantee future results or profitability - NOT INDIVIDUAL INVESTMENT ADVICE.
View Fundamental Indicator Board Online
The State of the Trend
After looking at the big-picture models and the fundamental backdrop, I like to look at the state of the trend. This board of indicators is designed to tell us about the overall technical health of the current trend.
With the major indices now in a cyclical bear market and having reached this status in record time, it is not surprising to see a lot of red on the Trend board. The lone positive trend is the 50-day vs. 200-day moving average, which would appear to be destined to turn red at some point in the coming weeks. And given that the cycle composite is not helpful in this environment, the green on the board currently is misleading.
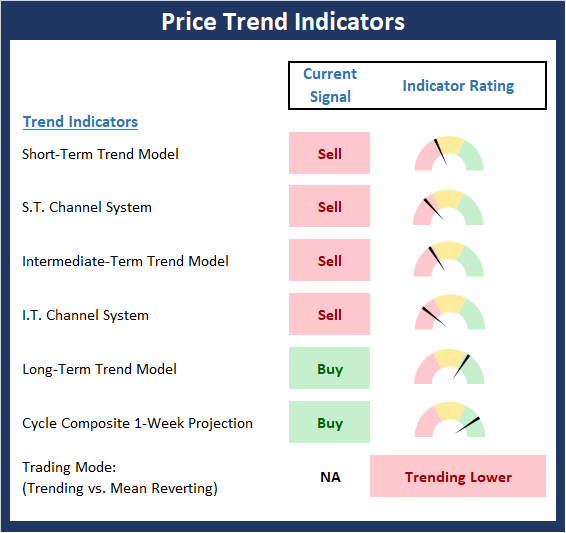
NOT INDIVIDUAL INVESTMENT ADVICE.
View Trend Indicator Board Online
The State of Internal Momentum
Next, we analyze the "oomph" behind the current trend via our group of market momentum indicators/models.
If you are looking for a good technical summary of the current market environment, the Momentum Board is it. It's red. Completely. 'Nuf said.
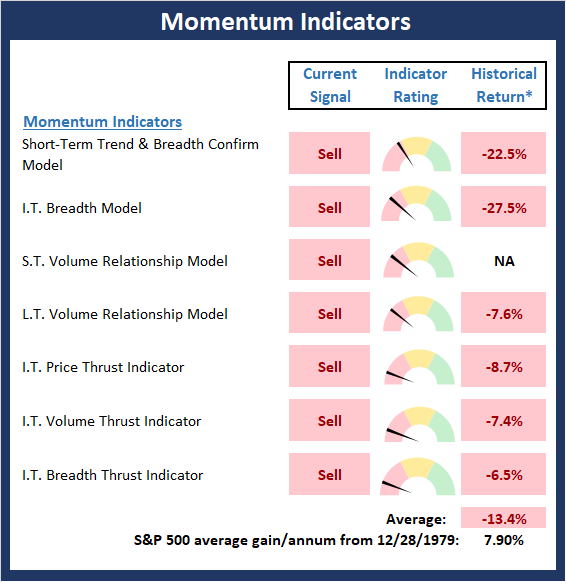
* Source: Ned Davis Research (NDR) as of the date of publication. Historical returns are hypothetical average annual performances calculated by NDR. Past performances do not guarantee future results or profitability - NOT INDIVIDUAL INVESTMENT ADVICE.
View Momentum Indicator Board Online
Early Warning Signals
Once we have identified the current environment, the state of the trend, and the degree of momentum behind the move, we then review the potential for a counter-trend move to begin. This batch of indicators is designed to suggest when the table is set for the trend to "go the other way."
Last week, I opined that the Early Warning board was in a "Not Yet" mode (intended to be a reference to the famous line from the movie, "Trading Places"). While attempting to pick a bottom in this environment is akin to trying to catch a falling knife (which might wind up being a guillotine!), the Early Warning board does suggest that a trading opportunity is likely close at hand. Especially when you consider that the Short-Term Overbought/Sold indicator is a whisker away from giving a buy signal as well. But, if you are looking for some spice in your life and want to put a long trade on in anticipation of the "dead cat bounce" that is coming, I'd encourage you to give yourself more than one shot at buying - personally, I'd prefer to take three shots at it!

* Source: Ned Davis Research (NDR) as of the date of publication. Historical returns are hypothetical average annual performances calculated by NDR. Past performances do not guarantee future results or profitability - NOT INDIVIDUAL INVESTMENT ADVICE.
View Early Warning Indicator Board Online
Thought For The Day:
I think a hero is an ordinary individual who finds strength to persevere & endure in spite of overwhelming obstacles. -Christopher Reeve
Wishing you green screens and all the best for a great day,

David D. Moenning
Founder, Chief Investment Officer
Heritage Capital Research

Disclosures
At the time of publication, Mr. Moenning held long positions in the following securities mentioned: JPM, GS - Note that positions may change at any time.
Leading Indicators Model: A group of indicators that have historically shown tendencies to lead the market at major turning points.
Intermediate-Term Market Model: A composite model (model of models) focused on trend and momentum indicators which has been designed to provide identify intermediate-term trading opportunities.
Risk/Reward Model: A model-of-models intended to provide an overall view of the state of the risk/reward environment. The model includes tape, monetary, and sentiment indicators as well as 7 big-picture market model readings.
Desert Island Model: If I was stranded on a desert island with access to only one market model to manage money with, this would be the model. The model is a comprehensive model-of-models comprised of trend, momentum, mean reversion, economic, monetary, sentiment, and factor-based indicators/models.
External Factors Model: A model-of-models designed to provide a reading on the "macro state" of the market environment. The model is comprised of indicators/models in the areas of various index yields, industrial production, investors sentiment, and historic volatility.
Short-Term Trend-and-Breadth Signal Explained: History shows the most reliable market moves tend to occur when the breadth indices are in gear with the major market averages. When the breadth measures diverge, investors should take note that a trend reversal may be at hand. This indicator incorporates NDR's All-Cap Dollar Weighted Equity Series and A/D Line. From 1998, when the A/D line is above its 5-day smoothing and the All-Cap Equal Weighted Equity Series is above its 25-day smoothing, the equity index has gained at a rate of +32.5% per year. When one of the indicators is above its smoothing, the equity index has gained at a rate of +13.3% per year. And when both are below, the equity index has lost +23.6% per year.
Channel Breakout System Explained: The short-term and intermediate-term Channel Breakout Systems are modified versions of the Donchian Channel indicator. According to Wikipedia, "The Donchian channel is an indicator used in market trading developed by Richard Donchian. It is formed by taking the highest high and the lowest low of the last n periods. The area between the high and the low is the channel for the period chosen."
Intermediate-Term Trend-and-Breadth Signal Explained: This indicator incorporates NDR's All-Cap Dollar Weighted Equity Series and A/D Line. From 1998, when the A/D line is above its 45-day smoothing and the All-Cap Equal Weighted Equity Series is above its 45-day smoothing, the equity index has gained at a rate of +17.6% per year. When one of the indicators is above its smoothing, the equity index has gained at a rate of +6.5% per year. And when both are below, the equity index has lost -1.3% per year.
Cycle Composite Projections: The cycle composite combines the 1-year Seasonal, 4-year Presidential, and 10-year Decennial cycles. The indicator reading shown uses the cycle projection for the upcoming week.
Trading Mode Indicator: This indicator attempts to identify whether the current trading environment is "trending" or "mean reverting." The indicator takes the composite reading of the Efficiency Ratio, the Average Correlation Coefficient, and Trend Strength models.
Volume Relationship Models: These models review the relationship between "supply" and "demand" volume over the short- and intermediate-term time frames.
Price Thrust Model Explained: This indicator measures the 3-day rate of change of the Value Line Composite relative to the standard deviation of the 30-day average. When the Value Line's 3-day rate of change have moved above 0.5 standard deviation of the 30-day average ROC, a "thrust" occurs and since 2000, the Value Line Composite has gained ground at a rate of +20.6% per year. When the indicator is below 0.5 standard deviation of the 30-day, the Value Line has lost ground at a rate of -10.0% per year. And when neutral, the Value Line has gained at a rate of +5.9% per year.
Volume Thrust Model Explained: This indicator uses NASDAQ volume data to indicate bullish and bearish conditions for the NASDAQ Composite Index. The indicator plots the ratio of the 10-day total of NASDAQ daily advancing volume (i.e., the total volume traded in stocks which rose in price each day) to the 10-day total of daily declining volume (volume traded in stocks which fell each day). This ratio indicates when advancing stocks are attracting the majority of the volume (readings above 1.0) and when declining stocks are seeing the heaviest trading (readings below 1.0). This indicator thus supports the case that a rising market supported by heavier volume in the advancing issues tends to be the most bullish condition, while a declining market with downside volume dominating confirms bearish conditions. When in a positive mode, the NASDAQ Composite has gained at a rate of +38.3% per year, When neutral, the NASDAQ has gained at a rate of +13.3% per year. And when negative, the NASDAQ has lost at a rate of -14.279% per year.
Breadth Thrust Model Explained: This indicator uses the number of NASDAQ-listed stocks advancing and declining to indicate bullish or bearish breadth conditions for the NASDAQ Composite. The indicator plots the ratio of the 10-day total of the number of stocks rising on the NASDAQ each day to the 10-day total of the number of stocks declining each day. Using 10-day totals smooths the random daily fluctuations and gives indications on an intermediate-term basis. As expected, the NASDAQ Composite performs much better when the 10-day A/D ratio is high (strong breadth) and worse when the indicator is in its lower mode (weak breadth). The most bullish conditions for the NASDAQ when the 10-day A/D indicator is not only high, but has recently posted an extreme high reading and thus indicated a thrust of upside momentum. Bearish conditions are confirmed when the indicator is low and has recently signaled a downside breadth thrust. In positive mode, the NASDAQ has gained at a rate of +22.1% per year since 1981. In a neutral mode, the NASDAQ has gained at a rate of +14.5% per year. And when in a negative mode, the NASDAQ has lost at a rate of -6.4% per year.
Short-Term Overbought/sold Indicator: This indicator is the current reading of the 14,1,3 stochastic oscillator. When the oscillator is above 80 and the %K is above the %D, the indicator gives an overbought reading. Conversely, when the oscillator is below 20 and %K is below its %D, the indicator is oversold.
Intermediate-Term Overbought/sold Indicator: This indicator is a 40-day RSI reading. When above 57.5, the indicator is considered overbought and wnen below 45 it is oversold.
Mean Reversion Model: This is a diffusion model consisting of five indicators that can produce buy and sell signals based on overbought/sold conditions.
VIX Indicator: This indicators looks at the current reading of the VIX relative to standard deviation bands. When the indicator reaches an extreme reading in either direction, it is an indication that a market trend could reverse in the near-term.
Short-Term Sentiment Indicator: This is a model-of-models composed of 18 independent sentiment indicators designed to indicate when market sentiment has reached an extreme from a short-term perspective. Historical analysis indicates that the stock market's best gains come after an environment has become extremely negative from a sentiment standpoint. Conversely, when sentiment becomes extremely positive, market returns have been subpar.
Intermediate-Term Sentiment Indicator: This is a model-of-models composed of 7 independent sentiment indicators designed to indicate when market sentiment has reached an extreme from a intermediate-term perspective. Historical analysis indicates that the stock market's best gains come after an environment has become extremely negative from a sentiment standpoint. Conversely, when sentiment becomes extremely positive, market returns have been subpar.
Long-Term Sentiment Indicator: This is a model-of-models composed of 6 independent sentiment indicators designed to indicate when market sentiment has reached an extreme from a long-term perspective. Historical analysis indicates that the stock market's best gains come after an environment has become extremely negative from a sentiment standpoint. Conversely, when sentiment becomes extremely positive, market returns have been subpar.
Absolute Monetary Model Explained: The popular cliche, "Don't fight the Fed" is really a testament to the profound impact that interest rates and Fed policy have on the market. It is a proven fact that monetary conditions are one of the most powerful influences on the direction of stock prices. The Absolute Monetary Model looks at the current level of interest rates relative to historical levels and Fed policy.
Relative Monetary Model Explained: The "relative" monetary model looks at monetary indicators relative to recent levels as well as rates of change and Fed Policy.
Economic Model Explained: During the middle of bull and bear markets, understanding the overall health of the economy and how it impacts the stock market is one of the few truly logical aspects of the stock market. When our Economic model sports a "positive" reading, history (beginning in 1965) shows that stocks enjoy returns in excess of 21% per year. Yet, when the model's reading falls into the "negative" zone, the S&P has lost nearly -25% per year. However, it is vital to understand that there are times when good economic news is actually bad for stocks and vice versa. Thus, the Economic model can help investors stay in tune with where we are in the overall economic cycle.
Inflation Model Explained: They say that "the tape tells all." However, one of the best "big picture" indicators of what the market is expected to do next is inflation. Simply put, since 1962, when the model indicates that inflationary pressures are strong, stocks have lost ground. Yet, when inflationary pressures are low, the S&P 500 has gained ground at a rate in excess of 13%. The bottom line is inflation is one of the primary drivers of stock market returns.
Valuation Model Explained: If you want to get analysts really riled up, you need only to begin a discussion of market valuation. While the question of whether stocks are overvalued or undervalued appears to be a simple one, the subject is actually extremely complex. To simplify the subject dramatically, investors must first determine if they should focus on relative valuation (which include the current level of interest rates) or absolute valuation measures (the more traditional readings of Price/Earnings, Price/Dividend, and Price/Book Value). We believe that it is important to recognize that environments change. And as such, the market's focus and corresponding view of valuations are likely to change as well. Thus, we depend on our Valuation Models to help us keep our eye on the ball.
Disclosures
NOT INVESTMENT ADVICE. The opinions and forecasts expressed herein are those of Mr. David Moenning and Heritage Capital Research and may not actually come to pass. The opinions and viewpoints regarding the future of the markets should not be construed as recommendations. The analysis and information in this report is for informational purposes only. No part of the material presented in this report is intended as an investment recommendation or investment advice. Neither the information nor any opinion expressed constitutes a solicitation to purchase or sell securities or any investment program.
Any investment decisions must in all cases be made by the reader or by his or her investment adviser. Do NOT ever purchase any security without doing sufficient research. There is no guarantee that the investment objectives outlined will actually come to pass. All opinions expressed herein are subject to change without notice. Neither the editor, employees, nor any of their affiliates shall have any liability for any loss sustained by anyone who has relied on the information provided.
Mr. Moenning of Heritage Capital Research is an investment adviser representative of Eastsound Capital Advisors, LLC, a registered investment advisor. The adviser may not transact business in states where it is not appropriately registered, excluded or exempted from registration. Individualized responses to persons that involve either the effecting of transaction in securities, or the rendering of personalized investment advice for compensation, will not be made without registration or exemption.
Mr. Moenning and Heritage Capital Research may at times have positions in the securities referred to and may make purchases or sales of these securities while publications are in circulation. Positions may change at any time.
The analysis provided is based on both technical and fundamental research and is provided "as is" without warranty of any kind, either expressed or implied. Although the information contained is derived from sources which are believed to be reliable, they cannot be guaranteed.
The author neither endorses nor warrants the content of this site, any embedded advertisement, or any linked resource. The author or his managed funds may hold either long or short positions in the referenced securities. Republication rights must be expressly granted by author in writing.
Investments in equities carry an inherent element of risk including the potential for significant loss of principal. Past performance is not an indication of future results.