Moderna Monday
I had every intention this morning of having a discussion about the divergence between the messaging the market received last week from the likes of Jay Powell, Dr. Fauci, David Tepper, and Stan Druckenmiller - all of whom expressed sobering outlooks - and, of course, the horrific economic data, versus "the trade" (you know, everyone buying the same Coronavirus winners, which also happen to be the dominant positions in the major indices).
By now, everybody knows the key players that can be expected to "win" in the coronavirus world. Some of the poster children here include Amazon (AMZN), Netflix (NFLX), Microsoft (MSFT), Activision (ATVI), Dominos (DPZ), NVIDA (NVDA), Paypal (PYPL), ServiceNow (NOW), Wayfair (W), Chegg (CHGG), Shopify (SHOP), Ring Central (RNG), Regeneron (REGN), and, of course, Moderna (MRNA), to name a few.
The bottom line is that although the economic outlook isn't great due to the time it will likely take to return to "normal" and the severity of the lasting damage incurred along the way, the S&P 500 and especially the NASDAQ 100 continue to march merrily higher because they are dominated by the same names that everyone on the planet (including yours truly) wants/needs to own. For example, don't look now fans, but the NASDAQ 100 ETF (QQQ) closed Friday up +5.2% on the year - and is up another 1.9% as I type on this fine Monday morning.
The key point I had planned to elaborate on was that the major indices don't always follow the macroeconomic narrative. No, sometimes you need only to "follow the money" to understand why stocks appear to have lost their minds.
Things Changed Monday Morning
But that was before my alarm went off this morning. Before I peeked at the futures. Before the surge at the open. And before a big dose of hope returned to the corner of Broad and Wall.
This morning, you can forget about the current P/E ratio and even the Forward P/E ratio. You can brush aside your fears about what negative interest rates might mean to savers, banks, and the Fed's balance sheet. And you can simply ignore the miserable earnings reports as well as the guidance, where there is any, from Corporate America.
No, this morning the game is about hope. And this time there is some actual data to back up that warm and fuzzy feeling everyone owning stocks has right about now.
The Key: A Little Something Called mRNA-1273
In case you haven't seen the headlines yet, drugmaker Moderna (MRNA), which sadly, I do not own, said Monday morning that the vaccine the company is testing to guard against the coronavirus - a vaccine code-named mRNA-1273 - showed positive preliminary results in its Phase I human trial.
Here's the key phrase from the company's announcement this morning: "The results reinforce the potential for the vaccine to prevent Covid-19." Wow.
More specifically, Moderna's chief medical officer Dr. Tal Zaks said in a statement, "These interim Phase 1 data, while early, demonstrate that vaccination with mRNA-1273 elicits an immune response of the magnitude caused by natural infection starting with a dose as low as 25 [micrograms]."
If a long sigh of relief isn't your response to that sentence, you may want to call your therapist.
While a bit geeky, I find some of the additional notes from Moderna's statement fascinating. "When combined with the success in preventing viral replication in the lungs of a pre-clinical challenge model at a dose that elicited similar levels of neutralizing antibodies, these data substantiate our belief that mRNA-1273 has the potential to prevent COVID-19 disease and advance our ability to select a dose for pivotal trials," Zaks added.
Did you catch the part about "mRNA-1273 has the potential to prevent COVID-19 disease?"
Now we're talkin. Yes, this was a preliminary trial with only 45 participants. And it is true that all the data from the trial aren't in. But if you dig into what Moderna is doing here, the data will definitely raise your spirits.
Moderna's mRNA-1273 contains genetic material called messenger RNA, or mRNA. This mRNA is a genetic code that basically tells a person's cells what to build. Here, the mRNA tells your body to build an antigen that will hopefully create an immunity to the virus.
Moderna says that after the Phase I trial is complete, it will move on to Phase II trials with 600 participants. Oh, and if the vaccine is effective and safe, it could be ready for us in, wait for it... early 2021.
"Early 2021" Definitely Works
This is important because "early 2021" is within the window of time that stocks tend to look towards. And IF any of the more than 100 vaccines currently in development (according to the WHO) can be "safe and effective," then the world can actually think about returning to normal in the not too distant future.
I don't know about you, but as someone who struggled to load all the potting soil, flowers and veggie plants into the back of our vehicle while wearing a mask and avoiding the rest of the gardeners yesterday morning, I for one, think this is welcome, hopeful news.
Weekly Market Model Review
Each week we do a disciplined, deep dive into our key market indicators and models. The overall goal of this exercise is to (a) remove emotion from the investment process, (b) stay "in tune" with the primary market cycles, and (c) remain cognizant of the risk/reward environment.
The Major Market Models
We start with six of our favorite long-term market models. These models are designed to help determine the "state" of the overall market.
There are no changes to report on the Primary Cycle board this week. And as I alluded to last week, the fact that there are no buy signals on this board gives me pause from a big picture standpoint. Thus, I think it is a good idea to try and separate one's view of the short-term market action and the macro view. I'm not saying that the view should be negative - especially after this morning's news from Moderna. But I will feel a whole lot better when I start to see some green here.
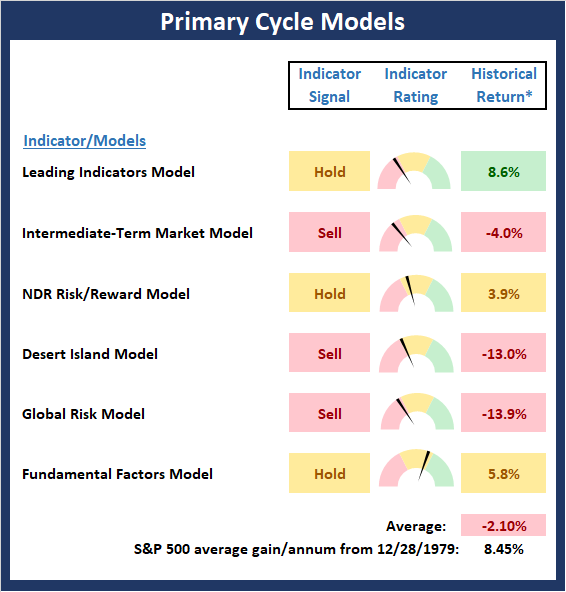
* Source: Ned Davis Research (NDR) as of the date of publication. Historical returns are hypothetical average annual performances calculated by NDR. Past performances do not guarantee future results or profitability - NOT INDIVIDUAL INVESTMENT ADVICE.
View My Favorite Market Models Online
The State of the Fundamental Backdrop
Next, we review the market's fundamental factors in the areas of interest rates, the economy, inflation, and valuations.
There are also no changes to the Fundamental Factors board this week. However, from an optimistic point of view, it is important to keep in mind that the efforts of the Fed and Congress amount to another green box here. In short, the stimulative measures being taken are unprecedented and assuming there is a medical solution on the horizon, these efforts will wind up aiding the economic recovery.
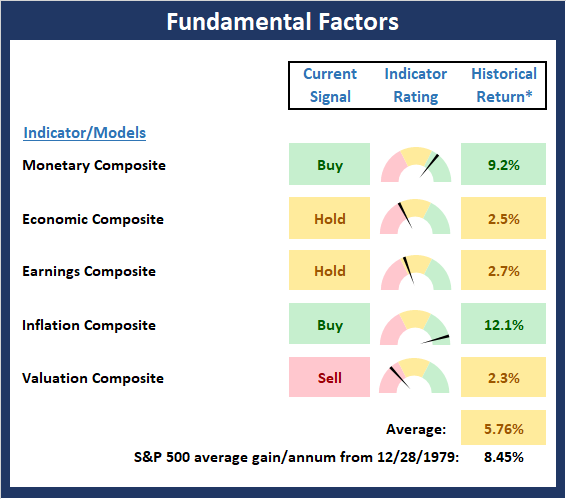
* Source: Ned Davis Research (NDR) as of the date of publication. Historical returns are hypothetical average annual performances calculated by NDR. Past performances do not guarantee future results or profitability - NOT INDIVIDUAL INVESTMENT ADVICE.
View Fundamental Indicator Board Online
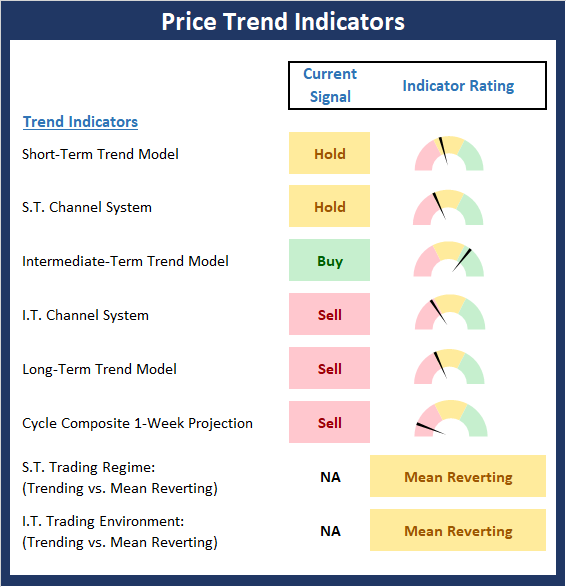
The State of the Trend
After looking at the big-picture models and the fundamental backdrop, I like to look at the state of the trend. This board of indicators is designed to tell us about the overall technical health of the current trend.
While stocks are surging this morning, the bottom line is stocks appear to be range-bound here. However, given the hopeful vaccine news out of MRNA, it does appear that a test of the S&P's 200-day could certainly be in the cards. As such, we need to watch the action around the current resistance levels closely. My take is the result of the upcoming tests of important technical levels will be a key tell.
NOT INDIVIDUAL INVESTMENT ADVICE.
View Trend Indicator Board Online
The State of Internal Momentum
Next, we analyze the "oomph" behind the current trend via our group of market momentum indicators/models.
The Momentum Board sagged last week. However, this is due to the fact that many of the indicators are sitting very close to their respective lines of demarcation. Thus, a little upward oomph could easily put this board back in its happy place.
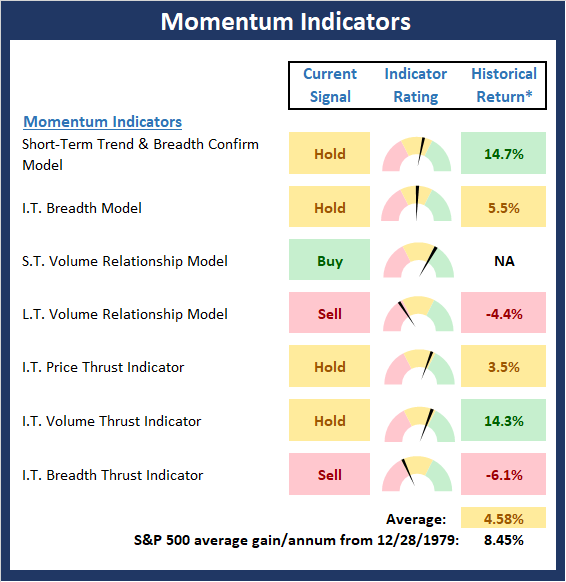
* Source: Ned Davis Research (NDR) as of the date of publication. Historical returns are hypothetical average annual performances calculated by NDR. Past performances do not guarantee future results or profitability - NOT INDIVIDUAL INVESTMENT ADVICE.
View Momentum Indicator Board Online
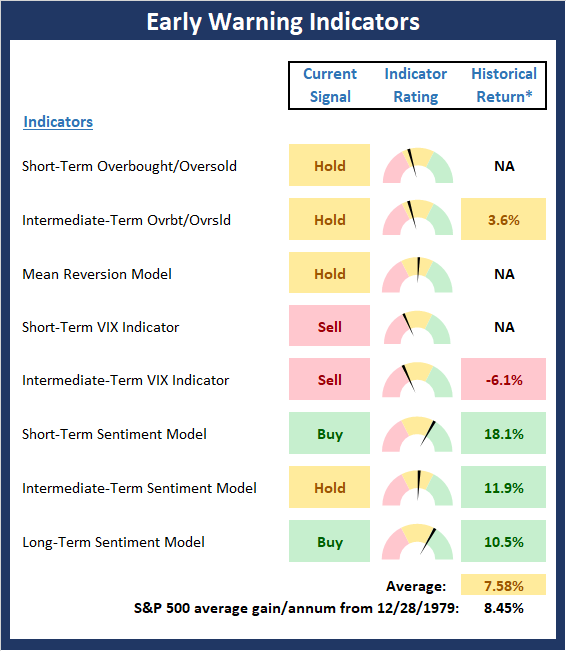
Early Warning Signals
Once we have identified the current environment, the state of the trend, and the degree of momentum behind the move, we then review the potential for a counter-trend move to begin. This batch of indicators is designed to suggest when the table is set for the trend to "go the other way."
For the last couple weeks, I've been saying the Early Warning board suggested the table was set for a counter-trend move, which in this case, would be down. However, so far at least, said "retest" hasn't happened. Blame it on the ongoing stimulus, the impressive moves by the Fed, or the hopeful news on the potential for a vaccine in record time. As such, stocks are now looking ahead and those looking for a leg lower may want to have stops in place.
* Source: Ned Davis Research (NDR) as of the date of publication. Historical returns are hypothetical average annual performances calculated by NDR. Past performances do not guarantee future results or profitability - NOT INDIVIDUAL INVESTMENT ADVICE.
View Early Warning Indicator Board Online
Thought For The Day:
Remember to say a quiet "thank you" for the good things that happen each day.
Wishing you green screens and all the best for a great day,

David D. Moenning
Founder, Chief Investment Officer
Heritage Capital Research

Disclosures
At the time of publication, Mr. Moenning held long positions in the following securities mentioned: QQQ, Amazon (AMZN), Netflix (NFLX), Microsoft (MSFT), Activision (ATVI), Dominos (DPZ), NVIDA (NVDA), ServiceNow (NOW) - Note that positions may change at any time.
Leading Indicators Model: A group of indicators that have historically shown tendencies to lead the market at major turning points.
Intermediate-Term Market Model: A composite model (model of models) focused on trend and momentum indicators which has been designed to provide identify intermediate-term trading opportunities.
Risk/Reward Model: A model-of-models intended to provide an overall view of the state of the risk/reward environment. The model includes tape, monetary, and sentiment indicators as well as 7 big-picture market model readings.
Desert Island Model: If I was stranded on a desert island with access to only one market model to manage money with, this would be the model. The model is a comprehensive model-of-models comprised of trend, momentum, mean reversion, economic, monetary, sentiment, and factor-based indicators/models.
External Factors Model: A model-of-models designed to provide a reading on the "macro state" of the market environment. The model is comprised of indicators/models in the areas of various index yields, industrial production, investors sentiment, and historic volatility.
Short-Term Trend-and-Breadth Signal Explained: History shows the most reliable market moves tend to occur when the breadth indices are in gear with the major market averages. When the breadth measures diverge, investors should take note that a trend reversal may be at hand. This indicator incorporates NDR's All-Cap Dollar Weighted Equity Series and A/D Line. From 1998, when the A/D line is above its 5-day smoothing and the All-Cap Equal Weighted Equity Series is above its 25-day smoothing, the equity index has gained at a rate of +32.5% per year. When one of the indicators is above its smoothing, the equity index has gained at a rate of +13.3% per year. And when both are below, the equity index has lost +23.6% per year.
Channel Breakout System Explained: The short-term and intermediate-term Channel Breakout Systems are modified versions of the Donchian Channel indicator. According to Wikipedia, "The Donchian channel is an indicator used in market trading developed by Richard Donchian. It is formed by taking the highest high and the lowest low of the last n periods. The area between the high and the low is the channel for the period chosen."
Intermediate-Term Trend-and-Breadth Signal Explained: This indicator incorporates NDR's All-Cap Dollar Weighted Equity Series and A/D Line. From 1998, when the A/D line is above its 45-day smoothing and the All-Cap Equal Weighted Equity Series is above its 45-day smoothing, the equity index has gained at a rate of +17.6% per year. When one of the indicators is above its smoothing, the equity index has gained at a rate of +6.5% per year. And when both are below, the equity index has lost -1.3% per year.
Cycle Composite Projections: The cycle composite combines the 1-year Seasonal, 4-year Presidential, and 10-year Decennial cycles. The indicator reading shown uses the cycle projection for the upcoming week.
Trading Mode Indicator: This indicator attempts to identify whether the current trading environment is "trending" or "mean reverting." The indicator takes the composite reading of the Efficiency Ratio, the Average Correlation Coefficient, and Trend Strength models.
Volume Relationship Models: These models review the relationship between "supply" and "demand" volume over the short- and intermediate-term time frames.
Price Thrust Model Explained: This indicator measures the 3-day rate of change of the Value Line Composite relative to the standard deviation of the 30-day average. When the Value Line's 3-day rate of change have moved above 0.5 standard deviation of the 30-day average ROC, a "thrust" occurs and since 2000, the Value Line Composite has gained ground at a rate of +20.6% per year. When the indicator is below 0.5 standard deviation of the 30-day, the Value Line has lost ground at a rate of -10.0% per year. And when neutral, the Value Line has gained at a rate of +5.18% per year.
Volume Thrust Model Explained: This indicator uses NASDAQ volume data to indicate bullish and bearish conditions for the NASDAQ Composite Index. The indicator plots the ratio of the 10-day total of NASDAQ daily advancing volume (i.e., the total volume traded in stocks which rose in price each day) to the 10-day total of daily declining volume (volume traded in stocks which fell each day). This ratio indicates when advancing stocks are attracting the majority of the volume (readings above 1.0) and when declining stocks are seeing the heaviest trading (readings below 1.0). This indicator thus supports the case that a rising market supported by heavier volume in the advancing issues tends to be the most bullish condition, while a declining market with downside volume dominating confirms bearish conditions. When in a positive mode, the NASDAQ Composite has gained at a rate of +38.3% per year, When neutral, the NASDAQ has gained at a rate of +13.3% per year. And when negative, the NASDAQ has lost at a rate of -15.189% per year.
Breadth Thrust Model Explained: This indicator uses the number of NASDAQ-listed stocks advancing and declining to indicate bullish or bearish breadth conditions for the NASDAQ Composite. The indicator plots the ratio of the 10-day total of the number of stocks rising on the NASDAQ each day to the 10-day total of the number of stocks declining each day. Using 10-day totals smooths the random daily fluctuations and gives indications on an intermediate-term basis. As expected, the NASDAQ Composite performs much better when the 10-day A/D ratio is high (strong breadth) and worse when the indicator is in its lower mode (weak breadth). The most bullish conditions for the NASDAQ when the 10-day A/D indicator is not only high, but has recently posted an extreme high reading and thus indicated a thrust of upside momentum. Bearish conditions are confirmed when the indicator is low and has recently signaled a downside breadth thrust. In positive mode, the NASDAQ has gained at a rate of +22.1% per year since 1981. In a neutral mode, the NASDAQ has gained at a rate of +14.5% per year. And when in a negative mode, the NASDAQ has lost at a rate of -6.4% per year.
Short-Term Overbought/sold Indicator: This indicator is the current reading of the 14,1,3 stochastic oscillator. When the oscillator is above 80 and the %K is above the %D, the indicator gives an overbought reading. Conversely, when the oscillator is below 20 and %K is below its %D, the indicator is oversold.
Intermediate-Term Overbought/sold Indicator: This indicator is a 40-day RSI reading. When above 57.5, the indicator is considered overbought and wnen below 45 it is oversold.
Mean Reversion Model: This is a diffusion model consisting of five indicators that can produce buy and sell signals based on overbought/sold conditions.
VIX Indicator: This indicators looks at the current reading of the VIX relative to standard deviation bands. When the indicator reaches an extreme reading in either direction, it is an indication that a market trend could reverse in the near-term.
Short-Term Sentiment Indicator: This is a model-of-models composed of 18 independent sentiment indicators designed to indicate when market sentiment has reached an extreme from a short-term perspective. Historical analysis indicates that the stock market's best gains come after an environment has become extremely negative from a sentiment standpoint. Conversely, when sentiment becomes extremely positive, market returns have been subpar.
Intermediate-Term Sentiment Indicator: This is a model-of-models composed of 7 independent sentiment indicators designed to indicate when market sentiment has reached an extreme from a intermediate-term perspective. Historical analysis indicates that the stock market's best gains come after an environment has become extremely negative from a sentiment standpoint. Conversely, when sentiment becomes extremely positive, market returns have been subpar.
Long-Term Sentiment Indicator: This is a model-of-models composed of 6 independent sentiment indicators designed to indicate when market sentiment has reached an extreme from a long-term perspective. Historical analysis indicates that the stock market's best gains come after an environment has become extremely negative from a sentiment standpoint. Conversely, when sentiment becomes extremely positive, market returns have been subpar.
Absolute Monetary Model Explained: The popular cliche, "Don't fight the Fed" is really a testament to the profound impact that interest rates and Fed policy have on the market. It is a proven fact that monetary conditions are one of the most powerful influences on the direction of stock prices. The Absolute Monetary Model looks at the current level of interest rates relative to historical levels and Fed policy.
Relative Monetary Model Explained: The "relative" monetary model looks at monetary indicators relative to recent levels as well as rates of change and Fed Policy.
Economic Model Explained: During the middle of bull and bear markets, understanding the overall health of the economy and how it impacts the stock market is one of the few truly logical aspects of the stock market. When our Economic model sports a "positive" reading, history (beginning in 1965) shows that stocks enjoy returns in excess of 21% per year. Yet, when the model's reading falls into the "negative" zone, the S&P has lost nearly -25% per year. However, it is vital to understand that there are times when good economic news is actually bad for stocks and vice versa. Thus, the Economic model can help investors stay in tune with where we are in the overall economic cycle.
Inflation Model Explained: They say that "the tape tells all." However, one of the best "big picture" indicators of what the market is expected to do next is inflation. Simply put, since 1962, when the model indicates that inflationary pressures are strong, stocks have lost ground. Yet, when inflationary pressures are low, the S&P 500 has gained ground at a rate in excess of 13%. The bottom line is inflation is one of the primary drivers of stock market returns.
Valuation Model Explained: If you want to get analysts really riled up, you need only to begin a discussion of market valuation. While the question of whether stocks are overvalued or undervalued appears to be a simple one, the subject is actually extremely complex. To simplify the subject dramatically, investors must first determine if they should focus on relative valuation (which include the current level of interest rates) or absolute valuation measures (the more traditional readings of Price/Earnings, Price/Dividend, and Price/Book Value). We believe that it is important to recognize that environments change. And as such, the market's focus and corresponding view of valuations are likely to change as well. Thus, we depend on our Valuation Models to help us keep our eye on the ball.
Disclosures
NOT INVESTMENT ADVICE. The opinions and forecasts expressed herein are those of Mr. David Moenning and Heritage Capital Research and may not actually come to pass. The opinions and viewpoints regarding the future of the markets should not be construed as recommendations. The analysis and information in this report is for informational purposes only. No part of the material presented in this report is intended as an investment recommendation or investment advice. Neither the information nor any opinion expressed constitutes a solicitation to purchase or sell securities or any investment program.
Any investment decisions must in all cases be made by the reader or by his or her investment adviser. Do NOT ever purchase any security without doing sufficient research. There is no guarantee that the investment objectives outlined will actually come to pass. All opinions expressed herein are subject to change without notice. Neither the editor, employees, nor any of their affiliates shall have any liability for any loss sustained by anyone who has relied on the information provided.
Mr. Moenning of Heritage Capital Research is an investment adviser representative of Eastsound Capital Advisors, LLC, a registered investment advisor. The adviser may not transact business in states where it is not appropriately registered, excluded or exempted from registration. Individualized responses to persons that involve either the effecting of transaction in securities, or the rendering of personalized investment advice for compensation, will not be made without registration or exemption.
Mr. Moenning and Heritage Capital Research may at times have positions in the securities referred to and may make purchases or sales of these securities while publications are in circulation. Positions may change at any time.
The analysis provided is based on both technical and fundamental research and is provided "as is" without warranty of any kind, either expressed or implied. Although the information contained is derived from sources which are believed to be reliable, they cannot be guaranteed.
The author neither endorses nor warrants the content of this site, any embedded advertisement, or any linked resource. The author or his managed funds may hold either long or short positions in the referenced securities. Republication rights must be expressly granted by author in writing.
Investments in equities carry an inherent element of risk including the potential for significant loss of principal. Past performance is not an indication of future results.