More Questions Than Answers
We've talked a lot lately about what I call "The Crash Playbook." In short, this is a guide developed since the mid-1980's on how market crashes/crises tend to play out. The premise for the playbook is, as the saying goes, "history doesn't repeat itself, but it often rhymes."
The main reason the market tends to follow the playbook is the various stages (Crash, Dead-Cat Bounce, Retest, Bottoming Phase, New Bull) are based on the emotions of investors. The idea is that while no two market moves are alike, investor behavior tends to be similar over time.
So, from my seat, the question of the day is if we have completed the first two chapters and are now moving into the third - the retest phase. Or, if we remain stuck in chapter one. While I don't know the answer, I'm of the mind that the next week or two will provide some serious clues.
Throw Out The Playbook?
However, my son, who is a portfolio manager for Clarus Wealth Advisors with nearly a decade of PM experience already (how the heck did that happen, btw?) asked what I deemed to be a darned good question on Friday. "Dad," he began, "how do we know the playbook will hold up this time around? We are experiencing an unprecedented event. So might we need a new playbook?"
I know what you're thinking. The youngster is basically saying, "This time it's different." And as we all know, those four words tend to create difficulty in one's portfolio.
Yet, in his defense, I had challenged him earlier in the week to think outside the box and to keep his mind open to anything here. As such, I thought the question was solid. And for the record, my initial response was something along the lines of, "Hmmm..."
No Appropriate Analog
It goes without saying that we are experiencing an economic situation like nothing we've seen before. Sure, the economy of the United States, and other countries for that matter, have stopped on a dime before. The 9/11 Terrorist Attacks and Japan's Tsunami are decent examples. But never has economic activity across the globe been shut down - on purpose.
Thus, the financial markets are busy "discounting" what comes next. The problem is nobody really knows what comes next. Other than an almost complete stoppage of economic activity, that is.
Obviously, this creates uncertainty. And we all know how Ms. Market hates uncertainty, right! So, at this stage of the game, understanding the questions that are most important to the market might be mission critical. So, while many of the questions posed below can be placed in the "Captain Obvious" category, my guess is that these are the key questions market participants need answers to. So here goes...
So Many Questions
There are so many questions here, which, in my humble opinion, makes it REALLY tough to know when "enough is enough" in terms of downside action in the stock market.
For example, one of the most obvious questions, which happens to be vital in terms of trying to discount the future appropriately is, how long will "the great cessation" last?
Are we talking about a few weeks as the White House recently opined (to the chagrin of just about everybody in the room)? A couple months? Three to four months? Longer?
Or will the virus simply "burn out" once the weather warms up?
The short answer is, nobody knows.
Next up in the long list of important question is, what will the economic damage be?
The consensus thinking appears to be that the U.S. is already in recession. I could show you any number of charts to support this idea. However, the chart below of last week's initial claims seems to make the point pretty well that these are indeed unique times.
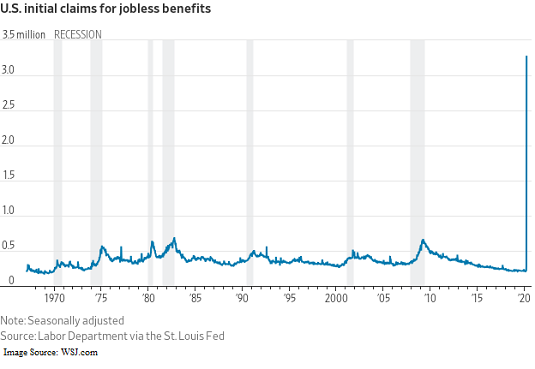
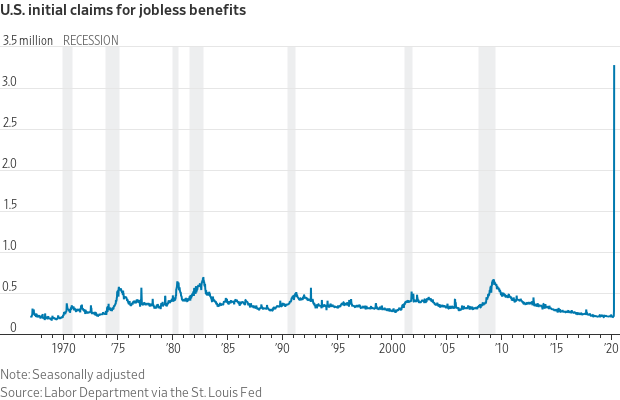
So, what does this mean in terms of GDP? The guesses from Wall Street's best and brightest are all over the map. Currently Morgan Stanley has the most pessimistic view in calling for GDP to decline 30% in Q2. Frankly, that sounds a bit extreme. Goldman's (GS) estimate is at -24%, JPMorgan's (JPM) at -14%, Deutsche is at -12.9, and Bank of America is at -12%.
Regardless of who you believe, it appears the quarter isn't gonna be pretty.
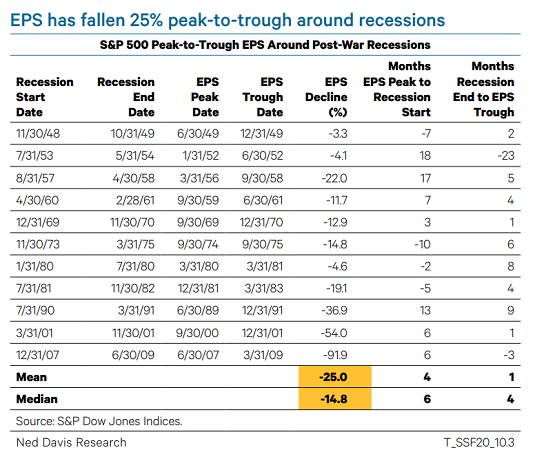
The next question to ponder is, what happens to earnings? The bad news is we really can't know how bad the oncoming recession is going to be. However, what can be viewed as "kinda good news" is we can be pretty sure a recession will occur. And therefore, we can look back at history to see how economic downturns have impacted earnings on the S&P 500.
Below is a chart from Ned Davis Research showing how EPS for the S&P fared during recessions in the modern, post-war era.
View Chart Online
Source: Ned Davis Research
The bottom line is the average earnings decline experienced during recessions since 1948 has been -25% while the median has been -14.8%. The worst hit was seen during the Financial Crisis. Obviously, this was a big, bad recession and earnings fell -91.9%. Other big hits occurred during the Tech Bubble bear (-54% beginning in 2001) and the -36.9% seen after the Gulf War of 1990. So, clearly there is serious risk to earnings if the U.S. experiences a nasty recession. Thus, the 33.9% drop from the S& 500's all-time high to the recent low might not be enough. Ugh.
If you prefer to be optimistic, the shallowest declines in EPS during recessions were -3.3% in 1948, -4.1% in 1953, and -4.6% in 1980. These recessions were more of the short-and-sweet variety. So, if you believe that the U.S. is going to dip in and out of recession quickly, then one can argue that the downside discounting already done to stock prices is likely enough.
Next Question...
The next question is really tough. How do you open the economy back up? Quickly and all at once? Slowly over time? County by county? City by city?
The lifting of shelter-in-place orders will ultimately come from the local governments that imposed them. So, while the White House may encourage folks to get back to work, here in Colorado, we've got to wait on the governor and/or mayors to give us the all-clear proclamation.
Finally, What Does the New Normal Look Like?
So, when everyone comes out of hibernation and is allowed to conduct a little commerce in an up close and personal way again, what will the new "normal" look like?
Will folks just forget the weeks/months of worrying about a virus that could upend their lives at any moment and return to business as usual? Ask yourself, will you jump on an airplane immediately for that late-summer vacation? What about the cruise the family was talking about? Do you dare visit great grandma in her nursing home? What about shopping at the mall?
Or will people think twice about sitting so close together at a baseball game? And will a ride on a packed subway ever be the same until every American has been vaccinated for COVID-19?
While my point is likely obvious, the key here is that there are a BUNCH of questions that cannot be answered at the present time. Therefore, anybody thinking that the stock market is going to simply march higher from here and head right back to new highs might want to think again.
To be sure, I believe there will be great opportunities for investors on the horizon. I just think the markets will need to get comfortable with possible answers before the next bull market can begin in earnest. It is for this reason that I believe last week's "bounce" is likely to fail and lead to a "retest" phase. However, I will also admit that this is a very popular view, which, of course, makes me nervous!
But in closing, the good news is the next bull market IS coming. It's just a question of when! Oh, and word that the Fed might consider buying stock ETFs if things get worse is certainly encouraging!
Weekly Market Model Review
Each week we do a disciplined, deep dive into our key market indicators and models. The overall goal of this exercise is to (a) remove emotion from the investment process, (b) stay "in tune" with the primary market cycles, and (c) remain cognizant of the risk/reward environment.
The Major Market Models
We start with six of our favorite long-term market models. These models are designed to help determine the "state" of the overall market.
There are three items of note this week on the Primary Cycle board. First, the Leading Indicators Model slipped from a positive to neutral. Next, while the Intermediate-Term Market Model hasn't exactly nailed this market, there was some improvement within the internal components, which resulted in the hypothetical historical return rising from -19.2% to -1.0%. Finally, the Desert Island Model managed to push up into the neutral zone from negative. As a result, I'll give the board an overall rating of low-neutral this week.

* Source: Ned Davis Research (NDR) as of the date of publication. Historical returns are hypothetical average annual performances calculated by NDR. Past performances do not guarantee future results or profitability - NOT INDIVIDUAL INVESTMENT ADVICE.
View My Favorite Market Models Online
The State of the Fundamental Backdrop
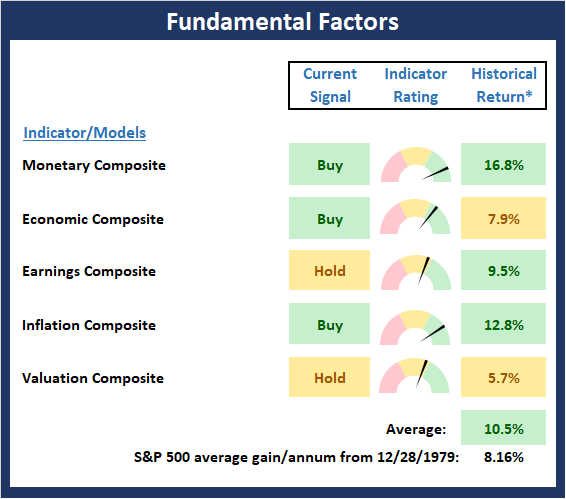
Next, we review the market's fundamental factors in the areas of interest rates, the economy, inflation, and valuations.
There are no obvious changes to report on the Fundamental Factors board again this week. However, as I mentioned last week, I think it is important to recognize that the majority of the fundamental model components are updated on a monthly basis. As such, I would expect to see the Economic and Earnings composites take a substantial hit in the next month or so, and the Valuation composite to improve. As a result, the best I can do here is a high neutral rating. The bottom line is we just don't know how long or how severe the self-inflicted recession is likely to be.
* Source: Ned Davis Research (NDR) as of the date of publication. Historical returns are hypothetical average annual performances calculated by NDR. Past performances do not guarantee future results or profitability - NOT INDIVIDUAL INVESTMENT ADVICE.
View Fundamental Indicator Board Online
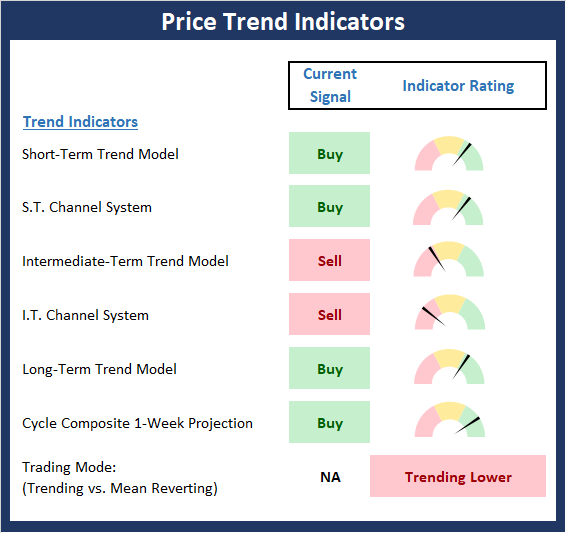
The State of the Trend
After looking at the big-picture models and the fundamental backdrop, I like to look at the state of the trend. This board of indicators is designed to tell us about the overall technical health of the current trend.
The biggest weekly rally in many years caused the Trend board to perk up a bit. But while some of the financial press is calling the 20% move up off the bottom by the DJIA a new bull market, this is where the mathematics of loss comes into play. For example, the DJIA closed Friday -26.78% from its peak. Thus, the index will need to rise +36.6% in order to get back to the old high. For the record, the MDY needs a gain of 48.3% to return to break even from the old high and the IWM (Russell 2000 Small Cap ETF) needs to gain 50.6%.
NOT INDIVIDUAL INVESTMENT ADVICE.
View Trend Indicator Board Online
The State of Internal Momentum
Next, we analyze the "oomph" behind the current trend via our group of market momentum indicators/models.
Although the trend board showed some marked improvement in response to last week's bounce, the Momentum Board was less impressed. However, it is modestly positive that two indicators moved from negative to neutral and one went from red to green. It's a start. But remember, for a new bull market to begin, typically we see momentum thrusts across several breadth measures. So far, only one out of four has flashed a buy signal (the percentage of stocks above their 10-day moving averages).

* Source: Ned Davis Research (NDR) as of the date of publication. Historical returns are hypothetical average annual performances calculated by NDR. Past performances do not guarantee future results or profitability - NOT INDIVIDUAL INVESTMENT ADVICE.
View Momentum Indicator Board Online
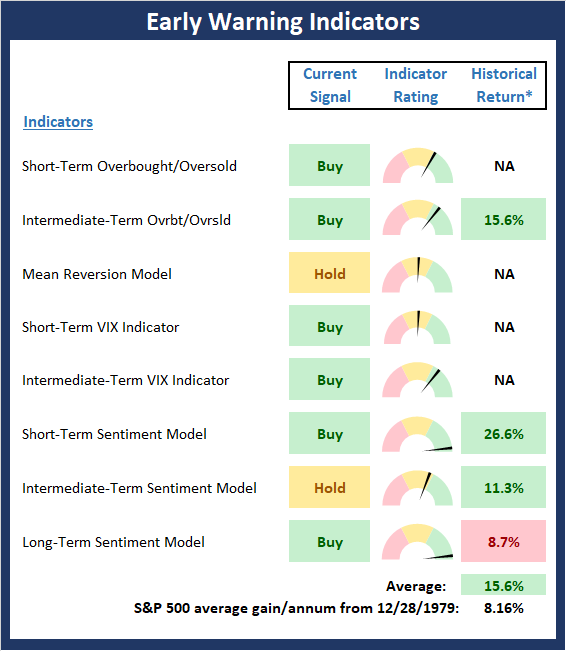
Early Warning Signals
Once we have identified the current environment, the state of the trend, and the degree of momentum behind the move, we then review the potential for a counter-trend move to begin. This batch of indicators is designed to suggest when the table is set for the trend to "go the other way."
Last week, I opined that the Early Warning board suggested that a trading opportunity was likely close at hand. However, the trouble with the inevitable "dead cat bounces" that occur during crash/crisis market cycles is they are very difficult to play. Personally, I prefer to focus on the second round of buy signals that tend to occur after a retest of the lows. Was Friday's decline the start of such a phase? We shall see.
* Source: Ned Davis Research (NDR) as of the date of publication. Historical returns are hypothetical average annual performances calculated by NDR. Past performances do not guarantee future results or profitability - NOT INDIVIDUAL INVESTMENT ADVICE.
View Early Warning Indicator Board Online
Thought For The Day:
Laughter is the shortest distance between two people. - Victor Borge (But please be sure to stay six feet apart!)
Wishing you green screens and all the best for a great day,

David D. Moenning
Founder, Chief Investment Officer
Heritage Capital Research

Disclosures
At the time of publication, Mr. Moenning held long positions in the following securities mentioned: GS, JPM - Note that positions may change at any time.
Leading Indicators Model: A group of indicators that have historically shown tendencies to lead the market at major turning points.
Intermediate-Term Market Model: A composite model (model of models) focused on trend and momentum indicators which has been designed to provide identify intermediate-term trading opportunities.
Risk/Reward Model: A model-of-models intended to provide an overall view of the state of the risk/reward environment. The model includes tape, monetary, and sentiment indicators as well as 7 big-picture market model readings.
Desert Island Model: If I was stranded on a desert island with access to only one market model to manage money with, this would be the model. The model is a comprehensive model-of-models comprised of trend, momentum, mean reversion, economic, monetary, sentiment, and factor-based indicators/models.
External Factors Model: A model-of-models designed to provide a reading on the "macro state" of the market environment. The model is comprised of indicators/models in the areas of various index yields, industrial production, investors sentiment, and historic volatility.
Short-Term Trend-and-Breadth Signal Explained: History shows the most reliable market moves tend to occur when the breadth indices are in gear with the major market averages. When the breadth measures diverge, investors should take note that a trend reversal may be at hand. This indicator incorporates NDR's All-Cap Dollar Weighted Equity Series and A/D Line. From 1998, when the A/D line is above its 5-day smoothing and the All-Cap Equal Weighted Equity Series is above its 25-day smoothing, the equity index has gained at a rate of +32.5% per year. When one of the indicators is above its smoothing, the equity index has gained at a rate of +13.3% per year. And when both are below, the equity index has lost +23.6% per year.
Channel Breakout System Explained: The short-term and intermediate-term Channel Breakout Systems are modified versions of the Donchian Channel indicator. According to Wikipedia, "The Donchian channel is an indicator used in market trading developed by Richard Donchian. It is formed by taking the highest high and the lowest low of the last n periods. The area between the high and the low is the channel for the period chosen."
Intermediate-Term Trend-and-Breadth Signal Explained: This indicator incorporates NDR's All-Cap Dollar Weighted Equity Series and A/D Line. From 1998, when the A/D line is above its 45-day smoothing and the All-Cap Equal Weighted Equity Series is above its 45-day smoothing, the equity index has gained at a rate of +17.6% per year. When one of the indicators is above its smoothing, the equity index has gained at a rate of +6.5% per year. And when both are below, the equity index has lost -1.3% per year.
Cycle Composite Projections: The cycle composite combines the 1-year Seasonal, 4-year Presidential, and 10-year Decennial cycles. The indicator reading shown uses the cycle projection for the upcoming week.
Trading Mode Indicator: This indicator attempts to identify whether the current trading environment is "trending" or "mean reverting." The indicator takes the composite reading of the Efficiency Ratio, the Average Correlation Coefficient, and Trend Strength models.
Volume Relationship Models: These models review the relationship between "supply" and "demand" volume over the short- and intermediate-term time frames.
Price Thrust Model Explained: This indicator measures the 3-day rate of change of the Value Line Composite relative to the standard deviation of the 30-day average. When the Value Line's 3-day rate of change have moved above 0.5 standard deviation of the 30-day average ROC, a "thrust" occurs and since 2000, the Value Line Composite has gained ground at a rate of +20.6% per year. When the indicator is below 0.5 standard deviation of the 30-day, the Value Line has lost ground at a rate of -10.0% per year. And when neutral, the Value Line has gained at a rate of +5.9% per year.
Volume Thrust Model Explained: This indicator uses NASDAQ volume data to indicate bullish and bearish conditions for the NASDAQ Composite Index. The indicator plots the ratio of the 10-day total of NASDAQ daily advancing volume (i.e., the total volume traded in stocks which rose in price each day) to the 10-day total of daily declining volume (volume traded in stocks which fell each day). This ratio indicates when advancing stocks are attracting the majority of the volume (readings above 1.0) and when declining stocks are seeing the heaviest trading (readings below 1.0). This indicator thus supports the case that a rising market supported by heavier volume in the advancing issues tends to be the most bullish condition, while a declining market with downside volume dominating confirms bearish conditions. When in a positive mode, the NASDAQ Composite has gained at a rate of +38.3% per year, When neutral, the NASDAQ has gained at a rate of +13.3% per year. And when negative, the NASDAQ has lost at a rate of -14.279% per year.
Breadth Thrust Model Explained: This indicator uses the number of NASDAQ-listed stocks advancing and declining to indicate bullish or bearish breadth conditions for the NASDAQ Composite. The indicator plots the ratio of the 10-day total of the number of stocks rising on the NASDAQ each day to the 10-day total of the number of stocks declining each day. Using 10-day totals smooths the random daily fluctuations and gives indications on an intermediate-term basis. As expected, the NASDAQ Composite performs much better when the 10-day A/D ratio is high (strong breadth) and worse when the indicator is in its lower mode (weak breadth). The most bullish conditions for the NASDAQ when the 10-day A/D indicator is not only high, but has recently posted an extreme high reading and thus indicated a thrust of upside momentum. Bearish conditions are confirmed when the indicator is low and has recently signaled a downside breadth thrust. In positive mode, the NASDAQ has gained at a rate of +22.1% per year since 1981. In a neutral mode, the NASDAQ has gained at a rate of +14.5% per year. And when in a negative mode, the NASDAQ has lost at a rate of -6.4% per year.
Short-Term Overbought/sold Indicator: This indicator is the current reading of the 14,1,3 stochastic oscillator. When the oscillator is above 80 and the %K is above the %D, the indicator gives an overbought reading. Conversely, when the oscillator is below 20 and %K is below its %D, the indicator is oversold.
Intermediate-Term Overbought/sold Indicator: This indicator is a 40-day RSI reading. When above 57.5, the indicator is considered overbought and wnen below 45 it is oversold.
Mean Reversion Model: This is a diffusion model consisting of five indicators that can produce buy and sell signals based on overbought/sold conditions.
VIX Indicator: This indicators looks at the current reading of the VIX relative to standard deviation bands. When the indicator reaches an extreme reading in either direction, it is an indication that a market trend could reverse in the near-term.
Short-Term Sentiment Indicator: This is a model-of-models composed of 18 independent sentiment indicators designed to indicate when market sentiment has reached an extreme from a short-term perspective. Historical analysis indicates that the stock market's best gains come after an environment has become extremely negative from a sentiment standpoint. Conversely, when sentiment becomes extremely positive, market returns have been subpar.
Intermediate-Term Sentiment Indicator: This is a model-of-models composed of 7 independent sentiment indicators designed to indicate when market sentiment has reached an extreme from a intermediate-term perspective. Historical analysis indicates that the stock market's best gains come after an environment has become extremely negative from a sentiment standpoint. Conversely, when sentiment becomes extremely positive, market returns have been subpar.
Long-Term Sentiment Indicator: This is a model-of-models composed of 6 independent sentiment indicators designed to indicate when market sentiment has reached an extreme from a long-term perspective. Historical analysis indicates that the stock market's best gains come after an environment has become extremely negative from a sentiment standpoint. Conversely, when sentiment becomes extremely positive, market returns have been subpar.
Absolute Monetary Model Explained: The popular cliche, "Don't fight the Fed" is really a testament to the profound impact that interest rates and Fed policy have on the market. It is a proven fact that monetary conditions are one of the most powerful influences on the direction of stock prices. The Absolute Monetary Model looks at the current level of interest rates relative to historical levels and Fed policy.
Relative Monetary Model Explained: The "relative" monetary model looks at monetary indicators relative to recent levels as well as rates of change and Fed Policy.
Economic Model Explained: During the middle of bull and bear markets, understanding the overall health of the economy and how it impacts the stock market is one of the few truly logical aspects of the stock market. When our Economic model sports a "positive" reading, history (beginning in 1965) shows that stocks enjoy returns in excess of 21% per year. Yet, when the model's reading falls into the "negative" zone, the S&P has lost nearly -25% per year. However, it is vital to understand that there are times when good economic news is actually bad for stocks and vice versa. Thus, the Economic model can help investors stay in tune with where we are in the overall economic cycle.
Inflation Model Explained: They say that "the tape tells all." However, one of the best "big picture" indicators of what the market is expected to do next is inflation. Simply put, since 1962, when the model indicates that inflationary pressures are strong, stocks have lost ground. Yet, when inflationary pressures are low, the S&P 500 has gained ground at a rate in excess of 13%. The bottom line is inflation is one of the primary drivers of stock market returns.
Valuation Model Explained: If you want to get analysts really riled up, you need only to begin a discussion of market valuation. While the question of whether stocks are overvalued or undervalued appears to be a simple one, the subject is actually extremely complex. To simplify the subject dramatically, investors must first determine if they should focus on relative valuation (which include the current level of interest rates) or absolute valuation measures (the more traditional readings of Price/Earnings, Price/Dividend, and Price/Book Value). We believe that it is important to recognize that environments change. And as such, the market's focus and corresponding view of valuations are likely to change as well. Thus, we depend on our Valuation Models to help us keep our eye on the ball.
Disclosures
NOT INVESTMENT ADVICE. The opinions and forecasts expressed herein are those of Mr. David Moenning and Heritage Capital Research and may not actually come to pass. The opinions and viewpoints regarding the future of the markets should not be construed as recommendations. The analysis and information in this report is for informational purposes only. No part of the material presented in this report is intended as an investment recommendation or investment advice. Neither the information nor any opinion expressed constitutes a solicitation to purchase or sell securities or any investment program.
Any investment decisions must in all cases be made by the reader or by his or her investment adviser. Do NOT ever purchase any security without doing sufficient research. There is no guarantee that the investment objectives outlined will actually come to pass. All opinions expressed herein are subject to change without notice. Neither the editor, employees, nor any of their affiliates shall have any liability for any loss sustained by anyone who has relied on the information provided.
Mr. Moenning of Heritage Capital Research is an investment adviser representative of Eastsound Capital Advisors, LLC, a registered investment advisor. The adviser may not transact business in states where it is not appropriately registered, excluded or exempted from registration. Individualized responses to persons that involve either the effecting of transaction in securities, or the rendering of personalized investment advice for compensation, will not be made without registration or exemption.
Mr. Moenning and Heritage Capital Research may at times have positions in the securities referred to and may make purchases or sales of these securities while publications are in circulation. Positions may change at any time.
The analysis provided is based on both technical and fundamental research and is provided "as is" without warranty of any kind, either expressed or implied. Although the information contained is derived from sources which are believed to be reliable, they cannot be guaranteed.
The author neither endorses nor warrants the content of this site, any embedded advertisement, or any linked resource. The author or his managed funds may hold either long or short positions in the referenced securities. Republication rights must be expressly granted by author in writing.
Investments in equities carry an inherent element of risk including the potential for significant loss of principal. Past performance is not an indication of future results.