Technical Tuesday: Stuck In The Middle With You
Welcome to the inaugural edition of "Technical Tuesdays."
If it's Tuesday, it's time to focus on the trend and momentum of the market. We start each week with a review of the primary market cycles through the lens of our big-picture primary cycle models. Next, I like to review the market's trend and momentum via our indicator boards and running through some charts.
The theme to this week's technical review can be summed up with the refrain from the Stealers Wheel's hit from 1972, "Stuck In The Middle With You" as the major indices have been moving sideways for more than a month now. But in order to avoid becoming complacent, let's take a look at the state of our trend and momentum indicators.
The State of the Trend Indicators
The Trend board indicators are designed to determine the overall technical health of the current stock market trend in terms of the short- and intermediate-term time frames.
The trend board has seen some deterioration over the past week as the major indices remain stuck in a sideways trading range. While there are two sell signals on the trend board here, we will place more emphasis on the bounds of the trading range than any moving averages at this time. In other words, the real key here is which way the indices break out of the range.

NOT INDIVIDUAL INVESTMENT ADVICE.
View Trend Indicator Board Online
My Take on the State of the Charts
While the NASDAQ 100 (second chart below) has roared higher and remains in a solid uptrend, the rest of the major indices remain range bound in a consolidation phase (between 2965 on the downside and 3230 on the upside of the S&P 500). This is very clear on the chart of the S&P 500 below. Thus, traders and investors everywhere will be watching to see which way price breaks out of the current trading range - and movements within the range should be taken with a grain of salt.
S&P 500 - Daily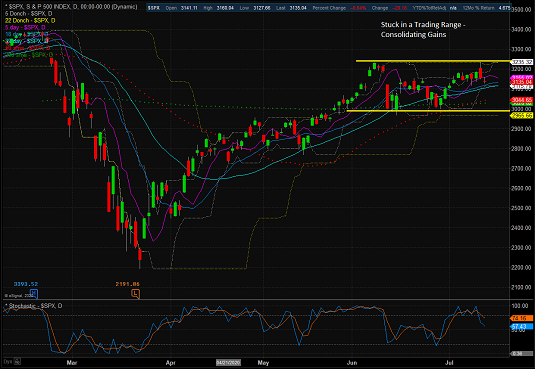
View Larger Chart
Looking at the NDX, which has been the clear leader for many moons, it is clear that these market darlings are due to rest for a while. As such, some underperformance in the near-term is to be expected. However, as long as the NDX does not put in a "lower low" on the chart (which I'll define as a couple closes below 9850), I will continue to give the bulls the benefit of the doubt.
NASDAQ 100 - Daily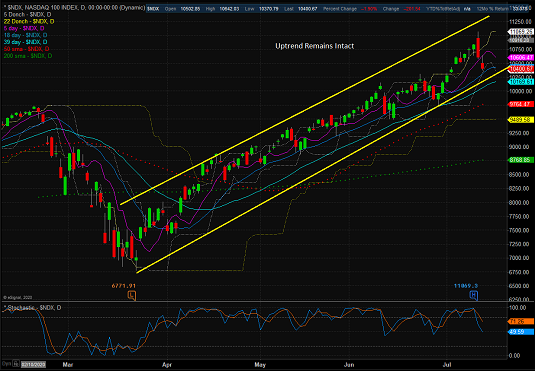
View Larger Chart
The State of Market Momentum
Once we've reviewed the state of the tape, we then analyze the internals to determine if there is any "oomph" behind the current trend via our group of market momentum indicators/models.
The Momentum Board has taken a pretty good hit of late. Last week, I rated the state of market momentum as moderately positive. This week, I think it has to be downgraded to neutral. However, the indicators that have dipped into the red are fairly active and would flip back to positive with a few decent up days.
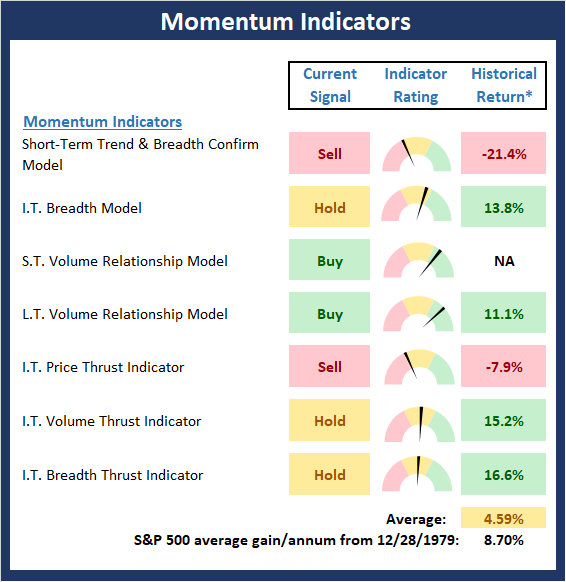
* Source: Ned Davis Research (NDR) as of the date of publication. Historical returns are hypothetical average annual performances calculated by NDR. Past performances do not guarantee future results or profitability - NOT INDIVIDUAL INVESTMENT ADVICE.
View Momentum Indicator Board Online
The Bottom Line
Although some weakness has crept into the indicator boards and the major indices have been doing a lot of nothing - albeit in an oftentimes volatile fashion, I think it is important to remember markets tend to exit a trading range heading in the same direction they were before the range began. As such, my plan is to stay seated on the bull train until/unless the trend/momentum indicators suggest otherwise.
Thought For The Day:
A man is tested by his reaction to man's praise. -Proverbs 27:2
Wishing you green screens and all the best for a great day,

David D. Moenning
Founder, Chief Investment Officer
Heritage Capital Research

Disclosures
At the time of publication, Mr. Moenning held long positions in the following securities mentioned: None - Note that positions may change at any time.
Trend Models Explained
Short-Term Trend Model:A series of indicator designed to identify the status of the stock market’s short-term (0-3 weeks) trend. The model compares the current price of S&P 500 relative to 5-day customized smoothing (weighted and moved forward 3 periods), the relationship of the 5-day to the 10-day, and the relationship of 10-day to 39-day.
Short- and Intermediate-Term Channel Breakout Systems: The short-term and intermediate-term Channel Breakout Systems are modified versions of the Donchian Channel indicator. According to Wikipedia, "The Donchian channel is an indicator used in market trading developed by Richard Donchian. It is formed by taking the highest high and the lowest low of the last n periods. The area between the high and the low is the channel for the period chosen."
Intermediate-Term Trend Model: A model designed to identify the status of the stock market’s intermediate-term (3 weeks to 6 months) price trend. The model compares the current weekly price of S&P 500 relative to relative to customized 10-week smoothing (weighted and moved forward 3 periods), the relationship of the 10-week to the 30-week, and the relationship of 30-week to 55-week.
Long-Term Trend Model: An indicator designed to identify the status of the stock market’s longer-term (>6 months) trend. The indicator compares the 50-day smoothing of the S&P 500 relative to its 200-day smoothing. When the 50-day is above 200-day, the indicator is positive and vice versa.
Cycle Composite Projections: The cycle composite combines the 1-year Seasonal, 4-year Presidential, and 10-year Decennial cycles. The indicator reading shown uses the cycle projection for the upcoming week.
Short- and Intermediate-Term Trading Mode Models: These indicator attempt to identify whether the current market action represents a "trending" or "mean reverting" environment. The indicator utilizes the readings of the Efficiency Ratio, the Average Correlation Coefficient, and Trend Strength models.
Momentum Models Explained
Short-Term Trend-and-Breadth Model: History shows the most reliable market moves tend to occur when the breadth indices are in tune with the major market averages. When the breadth measures diverge, investors should take note that a trend reversal may be at hand. This indicator incorporates an All-Cap Dollar Weighted Equity Series and A/D Line. At the time of this writing, when the A/D line has been above its 5-day smoothing and the All-Cap Equal Weighted Equity Series is above its 25-day smoothing, the equity index has gained at a rate of +26.5% per year since 1980. When one of the indicators is above its smoothing, the equity index has gained at a rate of +14.5% per year. And when both are below, the equity index has lost over -20% per year.
Intermediate-Term Breadth Model: A proprietary diffusion index developed by Ned Davis Research. The indicator is designed to determine the technical health of the market’s 157 sub-industry groups (GICS categorizes the market into 11 sectors, 20 industries, and 157 sub-industry groups). Technical health is determined by the direction of each sub-industry’s long-term smoothing and the rate of change of the sub-industry’s price index.
Short- and Long-Term Volume Relationship Models: These models review the relationship between "supply" and "demand" volume over the short- and intermediate-term time frames.
Intermediate-Term Price Thrust Model: This indicator measures the 3-day rate of change of the Value Line Composite relative to the standard deviation of the 30-day average.
Intermediate-Term Volume Thrust Model: This indicator uses NASDAQ volume data to indicate bullish and bearish conditions for the NASDAQ Composite Index. The indicator plots the ratio of the 10-day total of NASDAQ daily advancing volume to the 10-day total of daily declining volume. The indicator supports the case that a rising market supported by heavier volume in the advancing issues tends to be the most bullish condition, while a declining market with downside volume dominating confirms bearish conditions.
Breadth Thrust Model: This indicator uses the number of NASDAQ-listed stocks advancing and declining to indicate bullish or bearish breadth conditions for the NASDAQ Composite. The indicator plots the ratio of the 10-day total of the number of stocks rising on the NASDAQ each day to the 10-day total of the number of stocks declining each day. Using 10-day totals smooths the random daily fluctuations and gives indications on an intermediate-term basis. Historically, the NASDAQ Composite has performed much better when the 10-day A/D ratio is high (strong breadth) and worse when the indicator is in its lower mode (weak breadth). The most bullish conditions for the NASDAQ when the 10-day A/D indicator is not only high, but has recently posted an extreme high reading and thus indicated a thrust of upside momentum. Bearish conditions are confirmed when the indicator is low and has recently signaled a downside breadth thrust.
NOT INVESTMENT ADVICE. The opinions and forecasts expressed herein are those of Mr. David Moenning and Heritage Capital Research and may not actually come to pass. The opinions and viewpoints regarding the future of the markets should not be construed as recommendations. The analysis and information in this report is for informational purposes only. No part of the material presented in this report is intended as an investment recommendation or investment advice. Neither the information nor any opinion expressed constitutes a solicitation to purchase or sell securities or any investment program.
Any investment decisions must in all cases be made by the reader or by his or her investment adviser. Do NOT ever purchase any security without doing sufficient research. There is no guarantee that the investment objectives outlined will actually come to pass. All opinions expressed herein are subject to change without notice. Neither the editor, employees, nor any of their affiliates shall have any liability for any loss sustained by anyone who has relied on the information provided.
Mr. Moenning of Heritage Capital Research is an investment adviser representative of Eastsound Capital Advisors, LLC, a registered investment advisor. The adviser may not transact business in states where it is not appropriately registered, excluded or exempted from registration. Individualized responses to persons that involve either the effecting of transaction in securities, or the rendering of personalized investment advice for compensation, will not be made without registration or exemption.
Mr. Moenning and Heritage Capital Research may at times have positions in the securities referred to and may make purchases or sales of these securities while publications are in circulation. Positions may change at any time.
The analysis provided is based on both technical and fundamental research and is provided "as is" without warranty of any kind, either expressed or implied. Although the information contained is derived from sources which are believed to be reliable, they cannot be guaranteed.
The author neither endorses nor warrants the content of this site, any embedded advertisement, or any linked resource. The author or his managed funds may hold either long or short positions in the referenced securities. Republication rights must be expressly granted by author in writing.
Investments in equities carry an inherent element of risk including the potential for significant loss of principal. Past performance is not an indication of future results.