The King is Dead. Long Live the King!
Well it's official, we've got a full-fledged crisis on our hands in the financial markets. Historic events now occur on a daily basis. Things I have never seen before in my 33-year career as a portfolio manager are now happening with regularity. Safety plays are no longer safe. The tech-ladened QQQ ETF is outperforming the Dow. Very strange moves such as the AGG ETF losing 4% in a day occur due to forced liquidations. Good times.
This morning, I'd like to run through what we know and what can be expected to occur. And since nobody wants to plow through two thousand words on the subject, my plan is to present my thoughts in a brief, bullet-point fashion. So let's get started.
First, let me be clear; I do not know where the bottom is on this crisis/panic-driven decline. No one does. Anybody who pretends to know how low the market and/or bond yields will go is a poser and should be ignored.
Next, and while this can be placed in the "Captain Obvious" category, this crisis isn't over. Nor will it be over when the stock market bounces up the first time. No, this is going to take a while. My guess is it will take a few weeks for the stock market to discount the bad news and it will be a few months before the next bull market is born. But again, this is nothing more than educated guesswork on my part.
Next, I'm going to run through some of my key points - again, in a brief fashion...
- The stock market has officially entered a "cyclical" bear market, which is occurring within a "secular" bull market. (Cyclical cycles tend to last months on the way down and about 2.5 to 3 years on the way up. Whereas "secular" moves usually last at least a decade. We believe the current secular bull was born on March 9, 2009 and is ongoing.)
- According to history, the average "cyclical" bear market loses -30.6% over a period of about one year, while cyclical bears that occur within a "secular" bull lose -21.8% on average and last 283 calendar days (source: Ned Davis Research).
- However, we are definitely in uncharted territory in the markets here as the indices now move faster than ever before. For example, in the past two weeks we have seen moves of 5% - 8% occur within a matter of minutes.
- Important to Remember: The stock market is a discounting mechanism of future expectations.
- What we are seeing right now is called "price exploration" (to the downside) as traders try to determine "how much is enough." As in, at what price level is the bad news "baked in?"
- It is hard to see how we will get any "good news" on the virus front in the next few weeks. In short, the testing phase is just beginning. So, we can expect some very big, scary numbers to hit the wires in the coming weeks. And we can probably expect stocks to react negatively to the bad news.
- But at some point - and at some level - the bad news becomes priced in. (Example: Think about the way the market reacted during Trade War. For a while, markets reacted to every single tweet. But as time passed and the assumptions become clear, the market stopped caring/reacting to the news.)
- Thus, we can expect the stock market to likely bottom BEFORE the news stops getting bad. Again, this is because the market is currently trying to "price in" the expected impact to the economy.
- In order to flatten the curve of the virus's growth rate, we must effectively "kill the economy." The way to keep folks from getting this bug is to "hunker down" and stay home. I.E. Don't go out and stimulate the economy. Stay put and watch NFLX!
- At this stage, analysts are expecting (and stocks are pricing in) a mild, temporary recession. The thinking is that the crisis will fade within a couple months as the weather warms up. But then again, nobody really knows long or how deep the economic slowdown will be!
- The assumption is that economic growth will resume once the crisis passes. The worry is that consumers could stay cautious for longer than expected.
- I do not see how the stock market's ultimate bottom can take the shape of a "V" this time around.
- The Fed can't kill the virus. Fiscal stimulus can't kill the virus. (One of the best headlines I've seen this morning is, "Fed Fires Bazooka, Virus Still Standing.") So, the only way for the crisis to fade is for the virus news to stop getting worse.
- Remember that the violent declines are often associated with "forced liquidations." Think margin calls, hedge fund failings, mutual fund redemptions, systematic trading strategy moves, (such as the popular Risk Parity systems) etc.
- During a "forced liquidation" caused by redemptions, managers sell what they can, not what they want to. This explains why almost everything except government bonds go down in a bear market.
- The biggest one-day advances (such as we saw on Friday) have historically occurred during bear markets.
- Expect a "dead cat bounce" to begin when some good news comes out. This should last a few days and cause you to feel like the worst is over and things are better now.
- Once a dead cat bounce occurs, the original reason for the decline tends to resurface and a test of the lows takes place. THIS tends to be the time to begin thinking about the next bull market as everyone that wanted/needed to sell, has likely already done so.
- History teaches us that once a new bull is born, a big chunk of the gain occurs in the first one-third of the move (don't quote me on the exactness of that stat - I'm citing my recollection here). So, it is important to be ready for the next cycle!
- It is best to be looking for the bottom. To be ready for the next opportunity to make money. History shows that the average bull market gains 85.6% over 787 calendar days and bulls that occur within an ongoing secular bull gain an average of 105.7% over 1050 days (source: Ned Davis Research).
The goal in this type of environment is to lose the least amount possible. The definition of such will depend entirely on your investing approach/strategy. For example, active traders will want to be completely defensive. However, such an approach runs the risk of missing the beginning of the next bull market.
From my seat, the biggest goal is to avoid making a "big mistake" during this type of market. It is easy to succumb to emotions and do the wrong thing at the wrong time. So, sometimes the best thing to do is to ride it out. If you've reduced your risk to market exposure (which we have done to varying degrees), great. Now is the time to be looking ahead.
Finally, I should probably address the title of this morning's meandering market missive, "The King is Dead! Long Live the King!"
This a play on history as town criers would announce the death of one king and the new king's ascension to the throne directly after. The point here is that the most recent cyclical bull, which we believe began on 2/11/2016, ended/died on 2/12/2020. So, "the king is dead."
However, my final point this morning is to recognize that we've seen this movie before (1987, 1990, 1998, 2000-03, 2008-09, 2011, 2015-16, December 2018). I.E. Stocks tend to follow a familiar pattern during a crisis. First is the panic low. Then the dead-cat bounce. Then a retest of the lows. Then a bottoming phase. And finally, a new bull market.
The keys here are (1) the hero doesn't die in the end and (2) the next bull market is coming. Hence the phrase, "Long live the King!"
The question, of course, is when and from what level does the next bull market begin? And once again, I will be honest and say, I don't know. But what I do know is that we get closer to the next bull each and every time the market plummets in a panicked fashion.
In closing, it is my sincere hope that everyone stays safe and healthy. I for one am planning on complying with the "hunker down" approach and will play my part in trying to avoid spreading this nasty bug.
Weekly Market Model Review
Each week we do a disciplined, deep dive into our key market indicators and models. The overall goal of this exercise is to (a) remove emotion from the investment process, (b) stay "in tune" with the primary market cycles, and (c) remain cognizant of the risk/reward environment.
The Major Market Models
We start with six of our favorite long-term market models. These models are designed to help determine the "state" of the overall market.
There are no changes to report on the Primary Cycle board this week. From my seat, the board is neutral on balance. However, the hypothetical average return of the S&P given the current modes of the models is just 1.8%. And at this stage of the market debacle, this seems generous. I would also like to note that the Intermediate-Term Market Model appears to have booted the current cycle. As such, the model's inclusion is now under review. The bottom line is stocks are now entrenched in a cyclical bear market within the context of a secular bull.
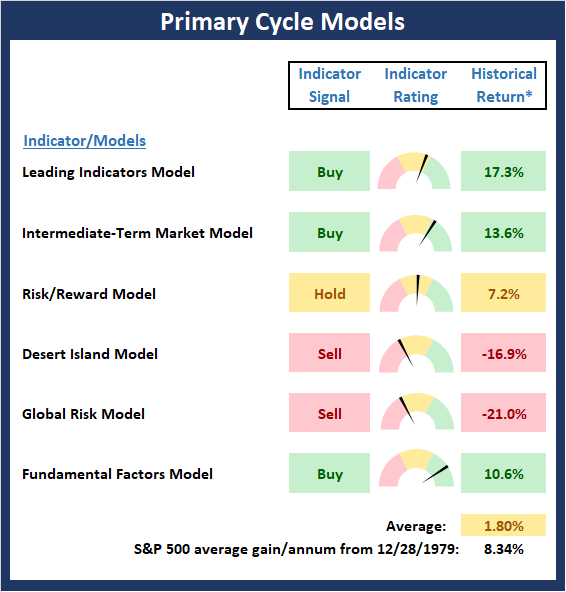
* Source: Ned Davis Research (NDR) as of the date of publication. Historical returns are hypothetical average annual performances calculated by NDR. Past performances do not guarantee future results or profitability - NOT INDIVIDUAL INVESTMENT ADVICE.
View My Favorite Market Models Online
The State of the Fundamental Backdrop
Next, we review the market's fundamental factors in the areas of interest rates, the economy, inflation, and valuations.
There are no changes to report on the Fundamental Factors board this week. However, there can be little argument that the U.S. Economy is going to slow in response to the novel coronavirus and the resulting disease, COVID-19, perhaps significantly. As such, we should probably assume the Economic Composite will move to neutral (at best) at some point in the near-term. The same can be said for the Earnings Composite since earnings will undoubtedly take a hit this quarter. The only question is how long the Economic and Earnings models will be impacted.
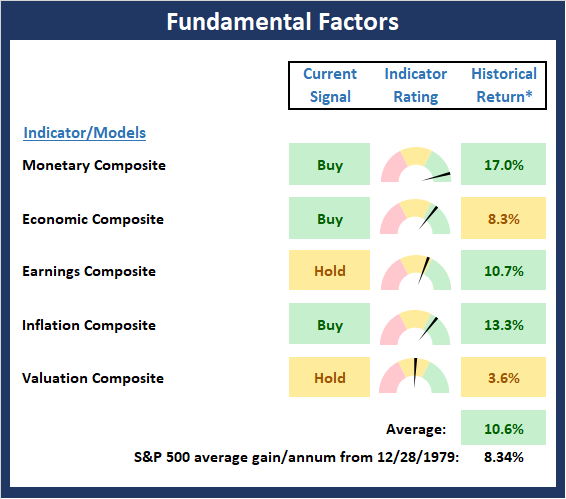
* Source: Ned Davis Research (NDR) as of the date of publication. Historical returns are hypothetical average annual performances calculated by NDR. Past performances do not guarantee future results or profitability - NOT INDIVIDUAL INVESTMENT ADVICE.
View Fundamental Indicator Board Online
The State of the Trend
After looking at the big-picture models and the fundamental backdrop, I like to look at the state of the trend. This board of indicators is designed to tell us about the overall technical health of the current trend.
Not surprisingly, the Trend board took a major hit last week. Stocks are now trending lower and the bottom has yet to be found. And until stocks can start looking ahead to better days, the trend will likely remain under pressure.

NOT INDIVIDUAL INVESTMENT ADVICE.
View Trend Indicator Board Online
The State of Internal Momentum
Next, we analyze the "oomph" behind the current trend via our group of market momentum indicators/models.
The Momentum Board currently sports a rare 100% negative reading. Thus, the bears must be given the benefit of the doubt here and will likely continue to remain in control for several weeks.
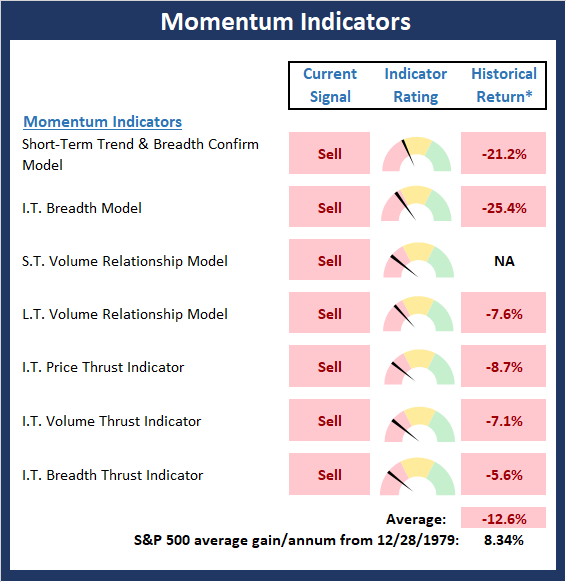
* Source: Ned Davis Research (NDR) as of the date of publication. Historical returns are hypothetical average annual performances calculated by NDR. Past performances do not guarantee future results or profitability - NOT INDIVIDUAL INVESTMENT ADVICE.
View Momentum Indicator Board Online
Early Warning Signals
Once we have identified the current environment, the state of the trend, and the degree of momentum behind the move, we then review the potential for a counter-trend move to begin. This batch of indicators is designed to suggest when the table is set for the trend to "go the other way."
It is also discouraging to note that the Early Warning board moved to a less bullish stance this week. This is due to the fact that we require a fair number of our "get ready to go the other way" indicators to first reach extreme readings (check) and then reverse in order to trigger buy signals. Last week, some of the indicators had reversed higher and flashed buys. However, this week, three are moving to new lows and have yet to reverse. As such, we find ourselves in a "not yet" environment in terms of looking for a trend reversal.
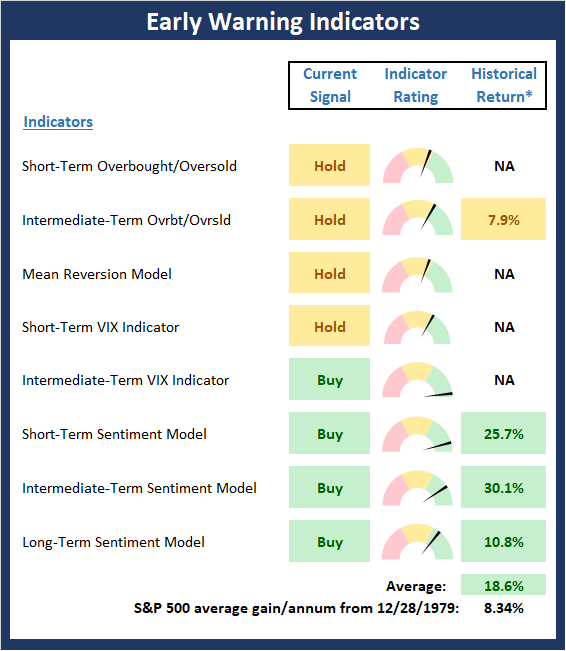
* Source: Ned Davis Research (NDR) as of the date of publication. Historical returns are hypothetical average annual performances calculated by NDR. Past performances do not guarantee future results or profitability - NOT INDIVIDUAL INVESTMENT ADVICE.
View Early Warning Indicator Board Online
Thought For The Day:
A happy person is not a person in a certain set of circumstances, but rather a person with a certain set of attitudes. -Hugh Downs
Wishing you green screens and all the best for a great day,

David D. Moenning
Founder, Chief Investment Officer
Heritage Capital Research

Disclosures
At the time of publication, Mr. Moenning held long positions in the following securities mentioned: NFLX, QQQ, AGG - Note that positions may change at any time.
Leading Indicators Model: A group of indicators that have historically shown tendencies to lead the market at major turning points.
Intermediate-Term Market Model: A composite model (model of models) focused on trend and momentum indicators which has been designed to provide identify intermediate-term trading opportunities.
Risk/Reward Model: A model-of-models intended to provide an overall view of the state of the risk/reward environment. The model includes tape, monetary, and sentiment indicators as well as 7 big-picture market model readings.
Desert Island Model: If I was stranded on a desert island with access to only one market model to manage money with, this would be the model. The model is a comprehensive model-of-models comprised of trend, momentum, mean reversion, economic, monetary, sentiment, and factor-based indicators/models.
External Factors Model: A model-of-models designed to provide a reading on the "macro state" of the market environment. The model is comprised of indicators/models in the areas of various index yields, industrial production, investors sentiment, and historic volatility.
Short-Term Trend-and-Breadth Signal Explained: History shows the most reliable market moves tend to occur when the breadth indices are in gear with the major market averages. When the breadth measures diverge, investors should take note that a trend reversal may be at hand. This indicator incorporates NDR's All-Cap Dollar Weighted Equity Series and A/D Line. From 1998, when the A/D line is above its 5-day smoothing and the All-Cap Equal Weighted Equity Series is above its 25-day smoothing, the equity index has gained at a rate of +32.5% per year. When one of the indicators is above its smoothing, the equity index has gained at a rate of +13.3% per year. And when both are below, the equity index has lost +23.6% per year.
Channel Breakout System Explained: The short-term and intermediate-term Channel Breakout Systems are modified versions of the Donchian Channel indicator. According to Wikipedia, "The Donchian channel is an indicator used in market trading developed by Richard Donchian. It is formed by taking the highest high and the lowest low of the last n periods. The area between the high and the low is the channel for the period chosen."
Intermediate-Term Trend-and-Breadth Signal Explained: This indicator incorporates NDR's All-Cap Dollar Weighted Equity Series and A/D Line. From 1998, when the A/D line is above its 45-day smoothing and the All-Cap Equal Weighted Equity Series is above its 45-day smoothing, the equity index has gained at a rate of +17.6% per year. When one of the indicators is above its smoothing, the equity index has gained at a rate of +6.5% per year. And when both are below, the equity index has lost -1.3% per year.
Cycle Composite Projections: The cycle composite combines the 1-year Seasonal, 4-year Presidential, and 10-year Decennial cycles. The indicator reading shown uses the cycle projection for the upcoming week.
Trading Mode Indicator: This indicator attempts to identify whether the current trading environment is "trending" or "mean reverting." The indicator takes the composite reading of the Efficiency Ratio, the Average Correlation Coefficient, and Trend Strength models.
Volume Relationship Models: These models review the relationship between "supply" and "demand" volume over the short- and intermediate-term time frames.
Price Thrust Model Explained: This indicator measures the 3-day rate of change of the Value Line Composite relative to the standard deviation of the 30-day average. When the Value Line's 3-day rate of change have moved above 0.5 standard deviation of the 30-day average ROC, a "thrust" occurs and since 2000, the Value Line Composite has gained ground at a rate of +20.6% per year. When the indicator is below 0.5 standard deviation of the 30-day, the Value Line has lost ground at a rate of -10.0% per year. And when neutral, the Value Line has gained at a rate of +5.9% per year.
Volume Thrust Model Explained: This indicator uses NASDAQ volume data to indicate bullish and bearish conditions for the NASDAQ Composite Index. The indicator plots the ratio of the 10-day total of NASDAQ daily advancing volume (i.e., the total volume traded in stocks which rose in price each day) to the 10-day total of daily declining volume (volume traded in stocks which fell each day). This ratio indicates when advancing stocks are attracting the majority of the volume (readings above 1.0) and when declining stocks are seeing the heaviest trading (readings below 1.0). This indicator thus supports the case that a rising market supported by heavier volume in the advancing issues tends to be the most bullish condition, while a declining market with downside volume dominating confirms bearish conditions. When in a positive mode, the NASDAQ Composite has gained at a rate of +38.3% per year, When neutral, the NASDAQ has gained at a rate of +13.3% per year. And when negative, the NASDAQ has lost at a rate of -14.279% per year.
Breadth Thrust Model Explained: This indicator uses the number of NASDAQ-listed stocks advancing and declining to indicate bullish or bearish breadth conditions for the NASDAQ Composite. The indicator plots the ratio of the 10-day total of the number of stocks rising on the NASDAQ each day to the 10-day total of the number of stocks declining each day. Using 10-day totals smooths the random daily fluctuations and gives indications on an intermediate-term basis. As expected, the NASDAQ Composite performs much better when the 10-day A/D ratio is high (strong breadth) and worse when the indicator is in its lower mode (weak breadth). The most bullish conditions for the NASDAQ when the 10-day A/D indicator is not only high, but has recently posted an extreme high reading and thus indicated a thrust of upside momentum. Bearish conditions are confirmed when the indicator is low and has recently signaled a downside breadth thrust. In positive mode, the NASDAQ has gained at a rate of +22.1% per year since 1981. In a neutral mode, the NASDAQ has gained at a rate of +14.5% per year. And when in a negative mode, the NASDAQ has lost at a rate of -6.4% per year.
Short-Term Overbought/sold Indicator: This indicator is the current reading of the 14,1,3 stochastic oscillator. When the oscillator is above 80 and the %K is above the %D, the indicator gives an overbought reading. Conversely, when the oscillator is below 20 and %K is below its %D, the indicator is oversold.
Intermediate-Term Overbought/sold Indicator: This indicator is a 40-day RSI reading. When above 57.5, the indicator is considered overbought and wnen below 45 it is oversold.
Mean Reversion Model: This is a diffusion model consisting of five indicators that can produce buy and sell signals based on overbought/sold conditions.
VIX Indicator: This indicators looks at the current reading of the VIX relative to standard deviation bands. When the indicator reaches an extreme reading in either direction, it is an indication that a market trend could reverse in the near-term.
Short-Term Sentiment Indicator: This is a model-of-models composed of 18 independent sentiment indicators designed to indicate when market sentiment has reached an extreme from a short-term perspective. Historical analysis indicates that the stock market's best gains come after an environment has become extremely negative from a sentiment standpoint. Conversely, when sentiment becomes extremely positive, market returns have been subpar.
Intermediate-Term Sentiment Indicator: This is a model-of-models composed of 7 independent sentiment indicators designed to indicate when market sentiment has reached an extreme from a intermediate-term perspective. Historical analysis indicates that the stock market's best gains come after an environment has become extremely negative from a sentiment standpoint. Conversely, when sentiment becomes extremely positive, market returns have been subpar.
Long-Term Sentiment Indicator: This is a model-of-models composed of 6 independent sentiment indicators designed to indicate when market sentiment has reached an extreme from a long-term perspective. Historical analysis indicates that the stock market's best gains come after an environment has become extremely negative from a sentiment standpoint. Conversely, when sentiment becomes extremely positive, market returns have been subpar.
Absolute Monetary Model Explained: The popular cliche, "Don't fight the Fed" is really a testament to the profound impact that interest rates and Fed policy have on the market. It is a proven fact that monetary conditions are one of the most powerful influences on the direction of stock prices. The Absolute Monetary Model looks at the current level of interest rates relative to historical levels and Fed policy.
Relative Monetary Model Explained: The "relative" monetary model looks at monetary indicators relative to recent levels as well as rates of change and Fed Policy.
Economic Model Explained: During the middle of bull and bear markets, understanding the overall health of the economy and how it impacts the stock market is one of the few truly logical aspects of the stock market. When our Economic model sports a "positive" reading, history (beginning in 1965) shows that stocks enjoy returns in excess of 21% per year. Yet, when the model's reading falls into the "negative" zone, the S&P has lost nearly -25% per year. However, it is vital to understand that there are times when good economic news is actually bad for stocks and vice versa. Thus, the Economic model can help investors stay in tune with where we are in the overall economic cycle.
Inflation Model Explained: They say that "the tape tells all." However, one of the best "big picture" indicators of what the market is expected to do next is inflation. Simply put, since 1962, when the model indicates that inflationary pressures are strong, stocks have lost ground. Yet, when inflationary pressures are low, the S&P 500 has gained ground at a rate in excess of 13%. The bottom line is inflation is one of the primary drivers of stock market returns.
Valuation Model Explained: If you want to get analysts really riled up, you need only to begin a discussion of market valuation. While the question of whether stocks are overvalued or undervalued appears to be a simple one, the subject is actually extremely complex. To simplify the subject dramatically, investors must first determine if they should focus on relative valuation (which include the current level of interest rates) or absolute valuation measures (the more traditional readings of Price/Earnings, Price/Dividend, and Price/Book Value). We believe that it is important to recognize that environments change. And as such, the market's focus and corresponding view of valuations are likely to change as well. Thus, we depend on our Valuation Models to help us keep our eye on the ball.
Disclosures
NOT INVESTMENT ADVICE. The opinions and forecasts expressed herein are those of Mr. David Moenning and Heritage Capital Research and may not actually come to pass. The opinions and viewpoints regarding the future of the markets should not be construed as recommendations. The analysis and information in this report is for informational purposes only. No part of the material presented in this report is intended as an investment recommendation or investment advice. Neither the information nor any opinion expressed constitutes a solicitation to purchase or sell securities or any investment program.
Any investment decisions must in all cases be made by the reader or by his or her investment adviser. Do NOT ever purchase any security without doing sufficient research. There is no guarantee that the investment objectives outlined will actually come to pass. All opinions expressed herein are subject to change without notice. Neither the editor, employees, nor any of their affiliates shall have any liability for any loss sustained by anyone who has relied on the information provided.
Mr. Moenning of Heritage Capital Research is an investment adviser representative of Eastsound Capital Advisors, LLC, a registered investment advisor. The adviser may not transact business in states where it is not appropriately registered, excluded or exempted from registration. Individualized responses to persons that involve either the effecting of transaction in securities, or the rendering of personalized investment advice for compensation, will not be made without registration or exemption.
Mr. Moenning and Heritage Capital Research may at times have positions in the securities referred to and may make purchases or sales of these securities while publications are in circulation. Positions may change at any time.
The analysis provided is based on both technical and fundamental research and is provided "as is" without warranty of any kind, either expressed or implied. Although the information contained is derived from sources which are believed to be reliable, they cannot be guaranteed.
The author neither endorses nor warrants the content of this site, any embedded advertisement, or any linked resource. The author or his managed funds may hold either long or short positions in the referenced securities. Republication rights must be expressly granted by author in writing.
Investments in equities carry an inherent element of risk including the potential for significant loss of principal. Past performance is not an indication of future results.