The Panic Playbook: A Blueprint For Market Crises
For investors of all shapes and sizes, the question of the day appears to be, now what? After the 14% thrashing of the Dow Jones Industrial Average in just seven sessions, one can't be blamed for feeling a little shell shocked. In short, these types of market panics can leave one disoriented and unsure about what to do next.
Two weeks ago, folks were complaining about the lack of any market "dips" to buy into. The underinvested felt left behind and anxious about whether there would be an opportunity to put money to work in the stock market. Such feelings are typical after the type of relentless run seen from October 1, 2019 through February 19, 2020.
As we have discussed in previous missives, it is important to remember that the market had become overbought and over-believed and the charts of many leaders such as Microsoft (MSFT), Visa (V), and Apple (AAPL) had gone parabolic. As such, stocks were due for a pullback, a pause, or a period of what I like to call, sloppy action. The key point here is that some sort of dance to the downside was to be expected.
Although many analysts, including yours truly, were on record calling for a pullback of some form, almost no one suggested that stocks would plunge from all-time highs into "correction territory" (meaning 10% off the highs) in record breaking fashion. And according to CNBC, this is exactly what happened as the panic selling pushed the Dow from an all-time high to the 10% correction mark in the shortest period ever.
I know of no one that suggested the market would enter a waterfall decline driven by fear and the uncertainty of what COVID-19 will do to global economies. But unfortunately, a scary, emotional, "bad news panic" is exactly what we've got on our hands right now as traders and their computers are clearly in "sell first and ask questions later" mode.
The Problem is Obvious
The current market worry is in plain view. Investors fret the slowdown caused by the virus will push the economies of the world into recession. And "the message" from the bond market appears to concur as the yield on the U.S. 10-year closed Friday at 1.127%, the lowest level in history, and this morning is trading at 1.085%.
But it is important to recognize that from an historical perspective, this scare is likely to be temporary. We can look at both the 2003 SARS and 2009 Swine Flu epidemics as a guide. But since the primary concern is economic (from the market’s perspective), we can also look at how markets reacted to the 9/11 terrorist attacks and the 2011 Japanese Tsunami.
The bottom line is past events proved to be temporary and markets rebounded in fairly short order. Whether the COVID-19 scenario will play out in the same fashion remains to be seen.
Remember: Corrections Are Part of the Game
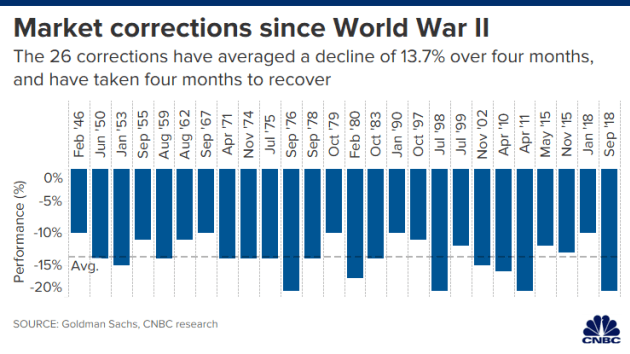
We can also look at the situation more broadly as there can be no denying that stocks are in correction mode. As such, it may be helpful to take a look at how past corrections have played out. So, according to CNBC, there have been 26 corrections since the end of World War II. The average decline for the S&P 500 during the prior corrections has been -13.7% and the current decline is -12.76% as of Friday's close.
Next, this study shows that the corrections lasted about four months on average and took about four months to recover.

View Chart Online
Image Source: CNBC
We've Seen This Movie Before: The Panic Playbook
To be sure, we can't know the economic impact of folks staying home and canceling travel plans in an effort to stay healthy and avoid this virus. Yet, I think it's important to also realize that we are not in uncharted territory here. As I wrote last week, we've seen this movie before. And in the end, the hero doesn't die.
Experienced investors know that "bad news panics" that result in waterfall declines tend to follow a familiar pattern. First, you see panic selling based on the "bad news." And a plunge of 14% in seven days on the Dow certainly qualifies here.
Next, we see an "emotional low" where fear is pervasive and stocks "flush" to the downside in dramatic fashion. In the days before computers dominated trading, this was fairly easy to spot. Investors panicked out of their positions and assumed that the sky was actually falling. However, the high-speed trading era has made "emotional lows" harder to identify as trend following algos tend to "chase their tails" until the closing bell rings and moves of 2% in a matter of minutes are now commonplace. Thus, I think the jury is still out on whether Friday's third 1,000+ point dive in a week was a panic low. My personal guess is no. But we'll see.
After the emotional selling phase happens (As in, "get me out at any price!"), a "dead cat bounce" usually occurs. These moves are usually violent to the upside as traders cover shorts, undo hedges, and put on some long exposure - all at the same time.
One of the lessons I've learned in my career is that unless you are dealing with a news-driven event that can be "solved" with a headline, it is best to avoid buying that first bounce - well, unless you are a fast-money trader, that is. An example here would be the December 2018 example, where we saw the end of the trade war and the Fed reversing course, which put an end to the panic and the market V-bottomed.
After the initial bounce, the original reason for the waterfall decline tends to resurface. This causes traders to put shorts back on and anyone who wants to sell does so. This is called the "retest" phase as prices move back toward the lows in some fashion. It is important to note that a "retest" isn't exact. I.E. Prices don't have to actually hit the prior lows. No, a "retest" can take the form of a move back toward the lows. Or prices can even exceed the lows. The point is that prices move back down from the initial bounce.
Finally, as the market discounts the crisis and the fear/uncertainty fades, stocks experience a period of "backing and filling," something we call the "bottoming process." Another lesson to recall is that markets can "handle" just about anything over time. And once the crisis is "handled" the bulls tend to resume control as it becomes clear that once again, the sky isn't really falling.
One of the keys here is that bottoms are usually a process, and not an event. I would expect this to be the case with the current move as there isn't likely to be a single headline, tweet, or announcement that can turn things around. No, the market will have to get comfortable with the situation before it can move on - and this will likely take some time (think months).
The good news is that the bull market eventually resumes. Yep, that's right; good news can happen. The Fed can lend a hand. Governments can take action. And in the end, the market looks ahead to better days.
My Plan For Profiting From The Panic
While things certainly look tough here and the computers are definitely scaring the bejeebers out of individual investors, we should remember that this too shall pass. And unless the fundamentals of the market (rates, inflation, economic growth, and earnings) are impacted in a meaningful and sustained way, I believe the bulls are likely to resume control of the game in the few weeks/months ahead.
So, if you are one of the many investors who were looking to put money to work in the market a couple weeks ago, here's your chance. To be clear, I am NOT calling a bottom here - nor will I ever try such foolishness. No, I am suggesting that if there is money that needs to be invested in stocks, you should consider putting some to work. Don't try to be a hero, simply invest over a period of time.
I.E. My plan for investing into a decline is to give yourself three buckets to buy with. Invest some now. Then add more if stocks go lower. And then add again if things get really ugly. You won't get the bottom, so don't even try. Instead, think about where the market is likely to be a year from now - or two/three years from now. The goal is to use this price break to position for the future - not try to buy the bottom tick.
Weekly Market Model Review
Each week we do a disciplined, deep dive into our key market indicators and models. The overall goal of this exercise is to (a) remove emotion from the investment process, (b) stay "in tune" with the primary market cycles, and (c) remain cognizant of the risk/reward environment.
The Major Market Models
We start with six of our favorite long-term market models. These models are designed to help determine the "state" of the overall market.
There are three changes to note on the Primary Cycle board this week. First, the Leading Indicators flip-flopped yet again this week; moving back into positive territory from neutral. Next, the Risk/Reward model also moved back to positive from neutral in response to improved sentiment indicator readings. And finally, the Global Risk Model slipped into negative territory. While the board sports a lot of green, it is worth noting that the readings of three models could easily change. So, at this stage, I'll call this long-term board moderately positive.
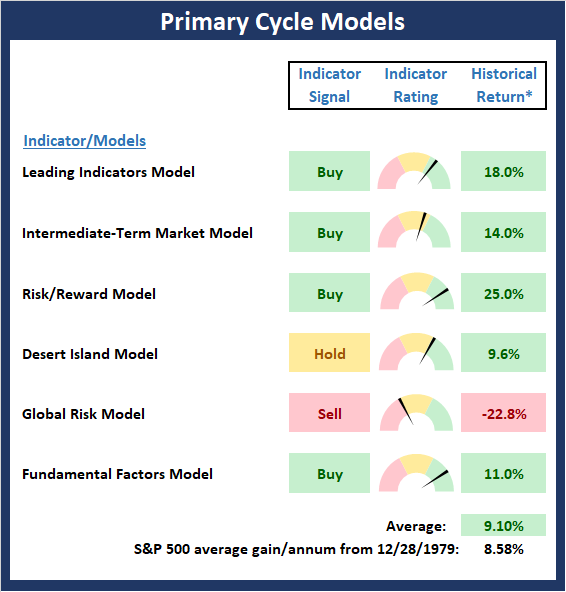
* Source: Ned Davis Research (NDR) as of the date of publication. Historical returns are hypothetical average annual performances calculated by NDR. Past performances do not guarantee future results or profitability - NOT INDIVIDUAL INVESTMENT ADVICE.
View My Favorite Market Models Online
The State of the Fundamental Backdrop
Next, we review the market's fundamental factors in the areas of interest rates, the economy, inflation, and valuations.
There was one change to the Fundamental Factors board worth noting this week as the Valuation Composite improved from negative to neutral. So, with an uptick in the inflation model last week and valuations this week, I'll opine that the market's fundamental backdrop is improving. Yes, of course, there is economic uncertainty. However, if we can look past what I expect to be a temporary decline in economic output, there are some positives to take into consideration.
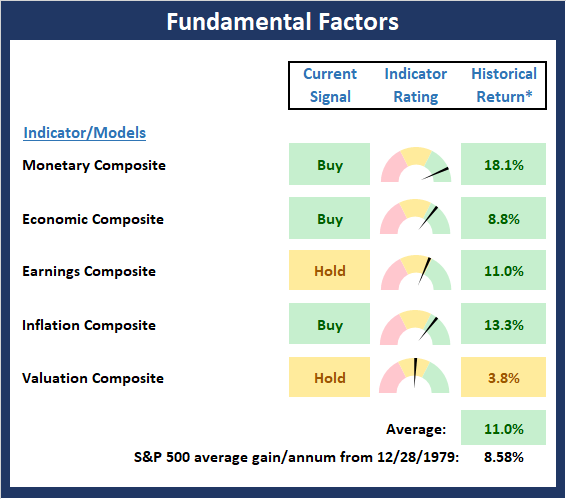
* Source: Ned Davis Research (NDR) as of the date of publication. Historical returns are hypothetical average annual performances calculated by NDR. Past performances do not guarantee future results or profitability - NOT INDIVIDUAL INVESTMENT ADVICE.
View Fundamental Indicator Board Online
The State of the Trend
After looking at the big-picture models and the fundamental backdrop, I like to look at the state of the trend. This board of indicators is designed to tell us about the overall technical health of the current trend.
The fact that the Price Trend board took a hit last week shouldn't be terribly surprising. The bottom line is a 14% dive on the Dow in seven trading days is gonna leave its mark on just about any price and/or trend-oriented indicators. To be sure, we are witnessing a fear-based waterfall decline unfold in panicky fashion before our eyes. And yes, it is indeed scary to see technical levels snap like toothpicks. However, in looking at the bright side, I will point out that the cycle composite points higher over the coming month and the long-term trend model remains green.
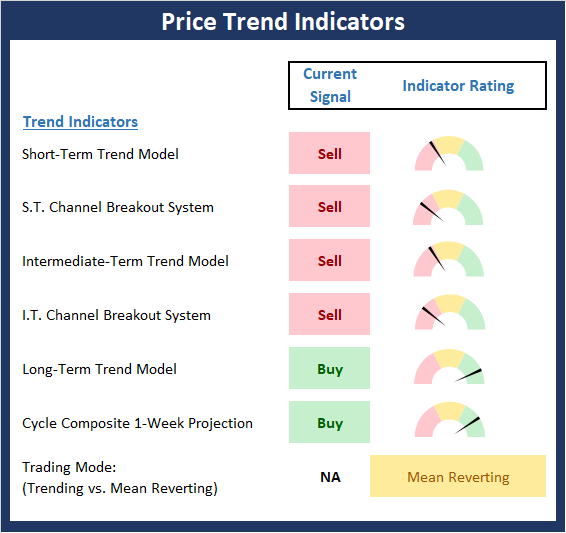
NOT INDIVIDUAL INVESTMENT ADVICE.
View Trend Indicator Board Online
The State of Internal Momentum
Next, we analyze the "oomph" behind the current trend via our group of market momentum indicators/models.
While the trend board definitely had a tough week, the action on the momentum board was actually worse. In short, the board is now awash in red and there is lone indicator that remains on a buy signal. As such, we must recognize that the fast and furious trend break has been accompanied by ferocious selling. Yet, I think we can all agree that much of the action has been driven by computerized algo trading, which tends to become overdone. Thus, I'm going to take the momentum board with a grain of salt here.
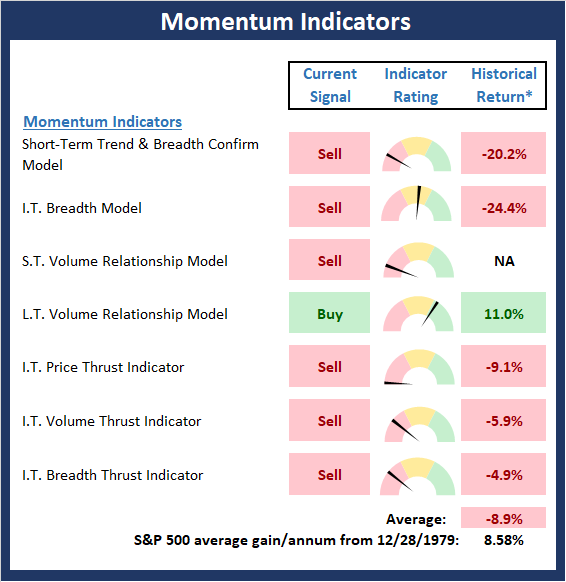
* Source: Ned Davis Research (NDR) as of the date of publication. Historical returns are hypothetical average annual performances calculated by NDR. Past performances do not guarantee future results or profitability - NOT INDIVIDUAL INVESTMENT ADVICE.
View Momentum Indicator Board Online
Early Warning Signals
Once we have identified the current environment, the state of the trend, and the degree of momentum behind the move, we then review the potential for a counter-trend move to begin. This batch of indicators is designed to suggest when the table is set for the trend to "go the other way."
As you'd expect after a thorough shellacking in the major indices, the Early Warning board is beginning to suggest that it might be time to go the other way for a while at some point soon. To be clear, the board is not in a "table pounding" position at this time. However, none of the indicators are negative and most are improving rapidly. Therefore, short-term traders should be on the lookout for the inevitable "dead cat" bounce. The question, of course, is if the bounce will hold or give way to a fresh round of selling. We shall see.
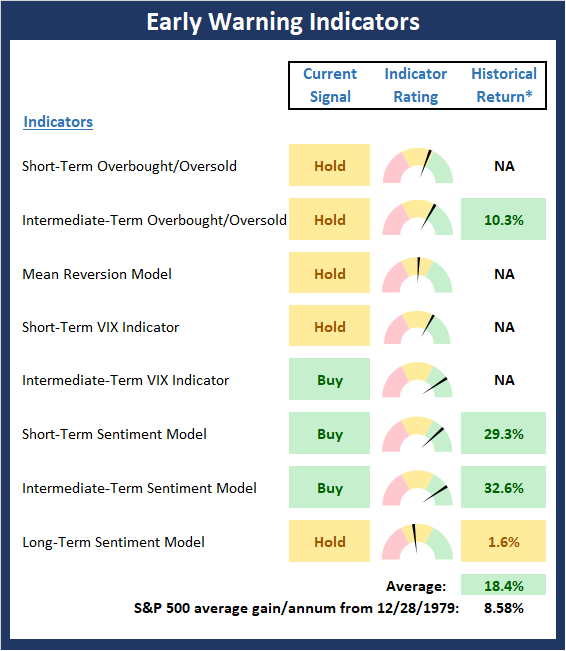
* Source: Ned Davis Research (NDR) as of the date of publication. Historical returns are hypothetical average annual performances calculated by NDR. Past performances do not guarantee future results or profitability - NOT INDIVIDUAL INVESTMENT ADVICE.
View Early Warning Indicator Board Online
Thought For The Day:
Every strike brings me closer to the next home run. - Babe Ruth
Wishing you green screens and all the best for a great day,

David D. Moenning
Founder, Chief Investment Officer
Heritage Capital Research

Disclosures
At the time of publication, Mr. Moenning held long positions in the following securities mentioned: MSFT, V, AAPL - Note that positions may change at any time.
Leading Indicators Model: A group of indicators that have historically shown tendencies to lead the market at major turning points.
Intermediate-Term Market Model: A composite model (model of models) focused on trend and momentum indicators which has been designed to provide identify intermediate-term trading opportunities.
Risk/Reward Model: A model-of-models intended to provide an overall view of the state of the risk/reward environment. The model includes tape, monetary, and sentiment indicators as well as 7 big-picture market model readings.
Desert Island Model: If I was stranded on a desert island with access to only one market model to manage money with, this would be the model. The model is a comprehensive model-of-models comprised of trend, momentum, mean reversion, economic, monetary, sentiment, and factor-based indicators/models.
External Factors Model: A model-of-models designed to provide a reading on the "macro state" of the market environment. The model is comprised of indicators/models in the areas of various index yields, industrial production, investors sentiment, and historic volatility.
Short-Term Trend-and-Breadth Signal Explained: History shows the most reliable market moves tend to occur when the breadth indices are in gear with the major market averages. When the breadth measures diverge, investors should take note that a trend reversal may be at hand. This indicator incorporates NDR's All-Cap Dollar Weighted Equity Series and A/D Line. From 1998, when the A/D line is above its 5-day smoothing and the All-Cap Equal Weighted Equity Series is above its 25-day smoothing, the equity index has gained at a rate of +32.5% per year. When one of the indicators is above its smoothing, the equity index has gained at a rate of +13.3% per year. And when both are below, the equity index has lost +23.6% per year.
Channel Breakout System Explained: The short-term and intermediate-term Channel Breakout Systems are modified versions of the Donchian Channel indicator. According to Wikipedia, "The Donchian channel is an indicator used in market trading developed by Richard Donchian. It is formed by taking the highest high and the lowest low of the last n periods. The area between the high and the low is the channel for the period chosen."
Intermediate-Term Trend-and-Breadth Signal Explained: This indicator incorporates NDR's All-Cap Dollar Weighted Equity Series and A/D Line. From 1998, when the A/D line is above its 45-day smoothing and the All-Cap Equal Weighted Equity Series is above its 45-day smoothing, the equity index has gained at a rate of +17.6% per year. When one of the indicators is above its smoothing, the equity index has gained at a rate of +6.5% per year. And when both are below, the equity index has lost -1.3% per year.
Cycle Composite Projections: The cycle composite combines the 1-year Seasonal, 4-year Presidential, and 10-year Decennial cycles. The indicator reading shown uses the cycle projection for the upcoming week.
Trading Mode Indicator: This indicator attempts to identify whether the current trading environment is "trending" or "mean reverting." The indicator takes the composite reading of the Efficiency Ratio, the Average Correlation Coefficient, and Trend Strength models.
Volume Relationship Models: These models review the relationship between "supply" and "demand" volume over the short- and intermediate-term time frames.
Price Thrust Model Explained: This indicator measures the 3-day rate of change of the Value Line Composite relative to the standard deviation of the 30-day average. When the Value Line's 3-day rate of change have moved above 0.5 standard deviation of the 30-day average ROC, a "thrust" occurs and since 2000, the Value Line Composite has gained ground at a rate of +20.6% per year. When the indicator is below 0.5 standard deviation of the 30-day, the Value Line has lost ground at a rate of -10.0% per year. And when neutral, the Value Line has gained at a rate of +5.9% per year.
Volume Thrust Model Explained: This indicator uses NASDAQ volume data to indicate bullish and bearish conditions for the NASDAQ Composite Index. The indicator plots the ratio of the 10-day total of NASDAQ daily advancing volume (i.e., the total volume traded in stocks which rose in price each day) to the 10-day total of daily declining volume (volume traded in stocks which fell each day). This ratio indicates when advancing stocks are attracting the majority of the volume (readings above 1.0) and when declining stocks are seeing the heaviest trading (readings below 1.0). This indicator thus supports the case that a rising market supported by heavier volume in the advancing issues tends to be the most bullish condition, while a declining market with downside volume dominating confirms bearish conditions. When in a positive mode, the NASDAQ Composite has gained at a rate of +38.3% per year, When neutral, the NASDAQ has gained at a rate of +13.3% per year. And when negative, the NASDAQ has lost at a rate of -14.279% per year.
Breadth Thrust Model Explained: This indicator uses the number of NASDAQ-listed stocks advancing and declining to indicate bullish or bearish breadth conditions for the NASDAQ Composite. The indicator plots the ratio of the 10-day total of the number of stocks rising on the NASDAQ each day to the 10-day total of the number of stocks declining each day. Using 10-day totals smooths the random daily fluctuations and gives indications on an intermediate-term basis. As expected, the NASDAQ Composite performs much better when the 10-day A/D ratio is high (strong breadth) and worse when the indicator is in its lower mode (weak breadth). The most bullish conditions for the NASDAQ when the 10-day A/D indicator is not only high, but has recently posted an extreme high reading and thus indicated a thrust of upside momentum. Bearish conditions are confirmed when the indicator is low and has recently signaled a downside breadth thrust. In positive mode, the NASDAQ has gained at a rate of +22.1% per year since 1981. In a neutral mode, the NASDAQ has gained at a rate of +14.5% per year. And when in a negative mode, the NASDAQ has lost at a rate of -6.4% per year.
Short-Term Overbought/sold Indicator: This indicator is the current reading of the 14,1,3 stochastic oscillator. When the oscillator is above 80 and the %K is above the %D, the indicator gives an overbought reading. Conversely, when the oscillator is below 20 and %K is below its %D, the indicator is oversold.
Intermediate-Term Overbought/sold Indicator: This indicator is a 40-day RSI reading. When above 57.5, the indicator is considered overbought and wnen below 45 it is oversold.
Mean Reversion Model: This is a diffusion model consisting of five indicators that can produce buy and sell signals based on overbought/sold conditions.
VIX Indicator: This indicators looks at the current reading of the VIX relative to standard deviation bands. When the indicator reaches an extreme reading in either direction, it is an indication that a market trend could reverse in the near-term.
Short-Term Sentiment Indicator: This is a model-of-models composed of 18 independent sentiment indicators designed to indicate when market sentiment has reached an extreme from a short-term perspective. Historical analysis indicates that the stock market's best gains come after an environment has become extremely negative from a sentiment standpoint. Conversely, when sentiment becomes extremely positive, market returns have been subpar.
Intermediate-Term Sentiment Indicator: This is a model-of-models composed of 7 independent sentiment indicators designed to indicate when market sentiment has reached an extreme from a intermediate-term perspective. Historical analysis indicates that the stock market's best gains come after an environment has become extremely negative from a sentiment standpoint. Conversely, when sentiment becomes extremely positive, market returns have been subpar.
Long-Term Sentiment Indicator: This is a model-of-models composed of 6 independent sentiment indicators designed to indicate when market sentiment has reached an extreme from a long-term perspective. Historical analysis indicates that the stock market's best gains come after an environment has become extremely negative from a sentiment standpoint. Conversely, when sentiment becomes extremely positive, market returns have been subpar.
Absolute Monetary Model Explained: The popular cliche, "Don't fight the Fed" is really a testament to the profound impact that interest rates and Fed policy have on the market. It is a proven fact that monetary conditions are one of the most powerful influences on the direction of stock prices. The Absolute Monetary Model looks at the current level of interest rates relative to historical levels and Fed policy.
Relative Monetary Model Explained: The "relative" monetary model looks at monetary indicators relative to recent levels as well as rates of change and Fed Policy.
Economic Model Explained: During the middle of bull and bear markets, understanding the overall health of the economy and how it impacts the stock market is one of the few truly logical aspects of the stock market. When our Economic model sports a "positive" reading, history (beginning in 1965) shows that stocks enjoy returns in excess of 21% per year. Yet, when the model's reading falls into the "negative" zone, the S&P has lost nearly -25% per year. However, it is vital to understand that there are times when good economic news is actually bad for stocks and vice versa. Thus, the Economic model can help investors stay in tune with where we are in the overall economic cycle.
Inflation Model Explained: They say that "the tape tells all." However, one of the best "big picture" indicators of what the market is expected to do next is inflation. Simply put, since 1962, when the model indicates that inflationary pressures are strong, stocks have lost ground. Yet, when inflationary pressures are low, the S&P 500 has gained ground at a rate in excess of 13%. The bottom line is inflation is one of the primary drivers of stock market returns.
Valuation Model Explained: If you want to get analysts really riled up, you need only to begin a discussion of market valuation. While the question of whether stocks are overvalued or undervalued appears to be a simple one, the subject is actually extremely complex. To simplify the subject dramatically, investors must first determine if they should focus on relative valuation (which include the current level of interest rates) or absolute valuation measures (the more traditional readings of Price/Earnings, Price/Dividend, and Price/Book Value). We believe that it is important to recognize that environments change. And as such, the market's focus and corresponding view of valuations are likely to change as well. Thus, we depend on our Valuation Models to help us keep our eye on the ball.
Disclosures
NOT INVESTMENT ADVICE. The opinions and forecasts expressed herein are those of Mr. David Moenning and Heritage Capital Research and may not actually come to pass. The opinions and viewpoints regarding the future of the markets should not be construed as recommendations. The analysis and information in this report is for informational purposes only. No part of the material presented in this report is intended as an investment recommendation or investment advice. Neither the information nor any opinion expressed constitutes a solicitation to purchase or sell securities or any investment program.
Any investment decisions must in all cases be made by the reader or by his or her investment adviser. Do NOT ever purchase any security without doing sufficient research. There is no guarantee that the investment objectives outlined will actually come to pass. All opinions expressed herein are subject to change without notice. Neither the editor, employees, nor any of their affiliates shall have any liability for any loss sustained by anyone who has relied on the information provided.
Mr. Moenning of Heritage Capital Research is an investment adviser representative of Eastsound Capital Advisors, LLC, a registered investment advisor. The adviser may not transact business in states where it is not appropriately registered, excluded or exempted from registration. Individualized responses to persons that involve either the effecting of transaction in securities, or the rendering of personalized investment advice for compensation, will not be made without registration or exemption.
Mr. Moenning and Heritage Capital Research may at times have positions in the securities referred to and may make purchases or sales of these securities while publications are in circulation. Positions may change at any time.
The analysis provided is based on both technical and fundamental research and is provided "as is" without warranty of any kind, either expressed or implied. Although the information contained is derived from sources which are believed to be reliable, they cannot be guaranteed.
The author neither endorses nor warrants the content of this site, any embedded advertisement, or any linked resource. The author or his managed funds may hold either long or short positions in the referenced securities. Republication rights must be expressly granted by author in writing.
Investments in equities carry an inherent element of risk including the potential for significant loss of principal. Past performance is not an indication of future results.