This Is The Dip
The excuse du jour for the current pullback/correction/sloppy period is clearly the Coronavirus. But in reality, it could have been anything. As I've been saying, stocks had become overbought and investors over believed in the bullish, theme. You know, the idea that we were revisiting 2013 and 2017's one-way market, where the only decision one had to make was what to buy next.
As is usually the case in these types of markets, something then came out of the woodwork to stir things up a bit and create some fear. Traders then all moved to a risk-off position at the same time and on Friday feared what the weekend headlines might bring. As a result, stocks whooshed lower.
The bearish talking points also included the yield curve inverting again and a not-so hot report from the popular Chicago Business Barometer. In case you haven't been paying attention, the manufacturing sector isn't in great shape as this particular indicator confirmed last week by remaining in contraction territory for the seventh straight month.
The good news is that the beleaguered manufacturing sector seems to be taking a turn for the better as the other five regional factory activity indices all rose last week and three of the six are now in expansion territory. And since the consumer is really the driver of the U.S. economy, the uptick in manufacturing should be viewed as icing on the economy's cake.
The questions of the day, of course, include, how low will the current pullback go and will this bout of selling wind up in the "garden variety" category?
With the S&P 500 having fallen -3.1% from the recent high as of Friday's close, the extent of the decline certainly falls in the "normal" zone for pullbacks - and a move to the -5% area should be a big surprise. Thus, the jury is still out on whether Friday's low was "the low" for the current move.
Since this appears to be a news driven event, the bulls would like to see the number of cases of the Coronavirus start to stabilize. And given that the virus has an incubation period of something like 14 days, seeing the number of cases not get significantly worse this week would be considered a win for the market.
In other words, the market doesn't need this thing to go away. It just needs to stop getting worse.
There can be little argument that the Coronavirus will impact the Chinese economy. As such, the drop of more than 7% overnight in Shanghai makes some sense.
But so far at least, it is hard to see how this outbreak will impact the U.S. economy to any great degree. In turn, the earnings picture shouldn't take a hit. And from my seat, this is really the driver at this point in time.
To be sure, nasty days like Friday aren't any fun and can test one's upbeat view of the market. But I think it is important to remember that there is no such thing as a "healthy" correction while it is occurring. No, pullbacks seem to always get ugly and scare the bejeebers out of you.
However, so far at least, this pullback seems to be keeping to the overbought/over believed script and appears to be offering up the opportunity to "get in" that so many were looking for a couple weeks back.
My guess is that the downside exploration may continue for a while in order to test the bulls' resolve (and the 50-day moving averages). Yet, I remain firmly in the "buy the dips" camp. At least for now.
Weekly Market Model Review
Since it's the start of a new week, it's now time to put aside my subjective view of the action and to review the "state" of our indicator boards. Each week we do a disciplined, deep dive into our key market indicators and models. The overall goal of this exercise is to (a) remove emotion from the investment process, (b) stay "in tune" with the primary market cycles, and (c) remain cognizant of the risk/reward environment.
The Major Market Models
We start with six of our favorite long-term market models. These models are designed to help determine the "state" of the overall market.
There is one change to report on the Primary Cycle board this week as the Global Risk model downticked to neutral from positive. It is also worth noting that both the Leading Indicators and Fundamental models currently sit just above their respective neutral zones. However, with the board continuing to sport a lot of green, the bulls should be given the benefit of the doubt during this corrective phase.
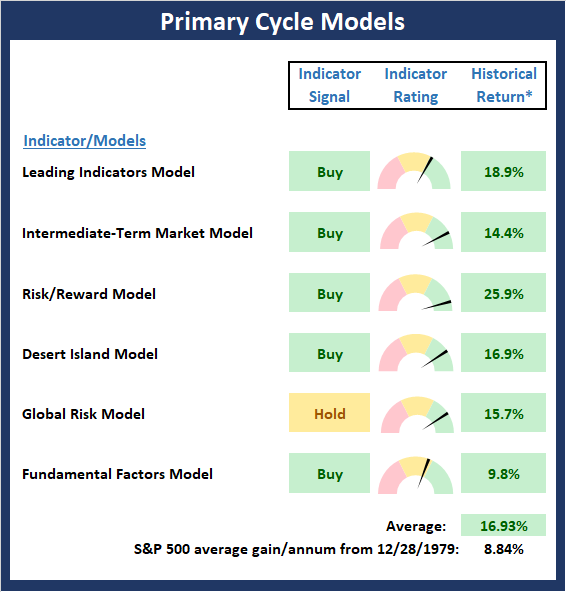
* Source: Ned Davis Research (NDR) as of the date of publication. Historical returns are hypothetical average annual performances calculated by NDR. Past performances do not guarantee future results or profitability - NOT INDIVIDUAL INVESTMENT ADVICE.
View My Favorite Market Models Online
The State of the Fundamental Backdrop
Next, we review the market's fundamental factors in the areas of interest rates, the economy, inflation, and valuations.
The Fundamental Factors board is unchanged this week. With two models sporting buy signals, two on "hold", and only one negative reading, my take is the board remains moderately positive. This tells me to view the current growth scare with a skeptical eye and to be ready to put money to work into the "dip." But as I mentioned last week, pullbacks/corrections never "feel" good when they are happening in real time.
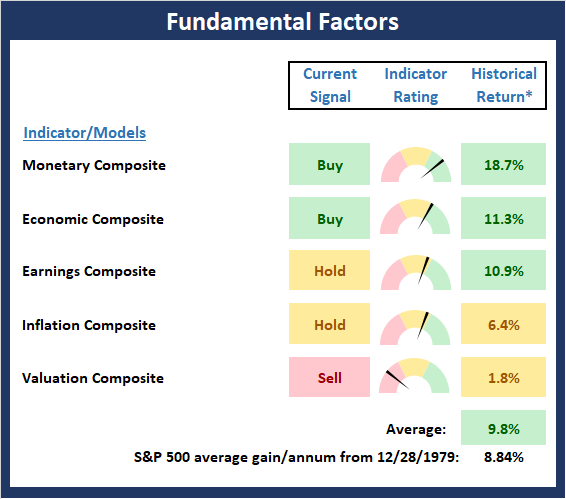
* Source: Ned Davis Research (NDR) as of the date of publication. Historical returns are hypothetical average annual performances calculated by NDR. Past performances do not guarantee future results or profitability - NOT INDIVIDUAL INVESTMENT ADVICE.
View Fundamental Indicator Board Online
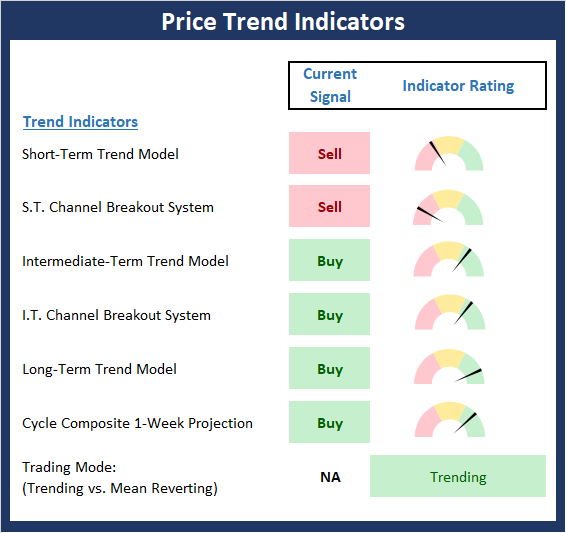
The State of the Trend
After looking at the big-picture models and the fundamental backdrop, I like to look at the state of the trend. This board of indicators is designed to tell us about the overall technical health of the current trend.
The current pullback, which has reached -3.1% for the S&P 500, -2.8% for the DJIA, -2.9% for the NASDAQ 100, -3.0% for Midcaps, and -3.55% for Smallcaps, has put some stress on our Trend board. However, for now at least, the board - and the market's intermediate-term trend - appears to be merely "bending" and not "breaking." We'll be watching support at Friday's lows as a "tell" about the near-term price movement.
NOT INDIVIDUAL INVESTMENT ADVICE.
View Trend Indicator Board Online
The State of Internal Momentum
Next, we analyze the "oomph" behind the current trend via our group of market momentum indicators/models.
The Momentum board deteriorated further this week. This is a bit worrisome as I would have expected to see the board put up more of a fight into a short-term pullback. I'll be paying particular attention to the Intermediate Term Breadth model. If this model were to go negative, it would suggest to me that the bears may have a leg to stand on and that further downside exploration would be in order.

* Source: Ned Davis Research (NDR) as of the date of publication. Historical returns are hypothetical average annual performances calculated by NDR. Past performances do not guarantee future results or profitability - NOT INDIVIDUAL INVESTMENT ADVICE.
View Momentum Indicator Board Online
Early Warning Signals
Once we have identified the current environment, the state of the trend, and the degree of momentum behind the move, we then review the potential for a counter-trend move to begin. This batch of indicators is designed to suggest when the table is set for the trend to "go the other way."
The biggest changes this week are seen on the Early Warning board. Recall that this board did a nice job alerting us to the fact that the table had been set up for the bears to enjoy some time in the spotlight well before the selling began. As usual, something (in this case, it was the Coronavirus) came out of the woodwork to allow traders to "go the other way." However, the board is now starting to shift. While the board is not in a "table pounding" position at this time and is often early (hence the name), I believe it does suggest that traders should "get ready to buy."
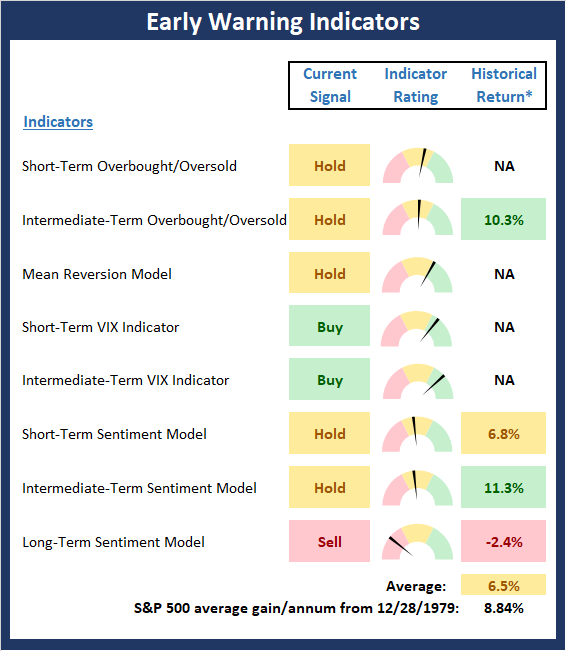
* Source: Ned Davis Research (NDR) as of the date of publication. Historical returns are hypothetical average annual performances calculated by NDR. Past performances do not guarantee future results or profitability - NOT INDIVIDUAL INVESTMENT ADVICE.
View Early Warning Indicator Board Online
Thought For The Day:
To sin by silence, when we should protest, makes cowards out of men. - Ella Wheeler Wilcox
Wishing you green screens and all the best for a great day,

David D. Moenning
Founder, Chief Investment Officer
Heritage Capital Research

Disclosures
At the time of publication, Mr. Moenning held long positions in the following securities mentioned: None - Note that positions may change at any time.
Leading Indicators Model: A group of indicators that have historically shown tendencies to lead the market at major turning points.
Intermediate-Term Market Model: A composite model (model of models) focused on trend and momentum indicators which has been designed to provide identify intermediate-term trading opportunities.
Risk/Reward Model: A model-of-models intended to provide an overall view of the state of the risk/reward environment. The model includes tape, monetary, and sentiment indicators as well as 7 big-picture market model readings.
Desert Island Model: If I was stranded on a desert island with access to only one market model to manage money with, this would be the model. The model is a comprehensive model-of-models comprised of trend, momentum, mean reversion, economic, monetary, sentiment, and factor-based indicators/models.
External Factors Model: A model-of-models designed to provide a reading on the "macro state" of the market environment. The model is comprised of indicators/models in the areas of various index yields, industrial production, investors sentiment, and historic volatility.
Short-Term Trend-and-Breadth Signal Explained: History shows the most reliable market moves tend to occur when the breadth indices are in gear with the major market averages. When the breadth measures diverge, investors should take note that a trend reversal may be at hand. This indicator incorporates NDR's All-Cap Dollar Weighted Equity Series and A/D Line. From 1998, when the A/D line is above its 5-day smoothing and the All-Cap Equal Weighted Equity Series is above its 25-day smoothing, the equity index has gained at a rate of +32.5% per year. When one of the indicators is above its smoothing, the equity index has gained at a rate of +13.3% per year. And when both are below, the equity index has lost +23.6% per year.
Channel Breakout System Explained: The short-term and intermediate-term Channel Breakout Systems are modified versions of the Donchian Channel indicator. According to Wikipedia, "The Donchian channel is an indicator used in market trading developed by Richard Donchian. It is formed by taking the highest high and the lowest low of the last n periods. The area between the high and the low is the channel for the period chosen."
Intermediate-Term Trend-and-Breadth Signal Explained: This indicator incorporates NDR's All-Cap Dollar Weighted Equity Series and A/D Line. From 1998, when the A/D line is above its 45-day smoothing and the All-Cap Equal Weighted Equity Series is above its 45-day smoothing, the equity index has gained at a rate of +17.6% per year. When one of the indicators is above its smoothing, the equity index has gained at a rate of +6.5% per year. And when both are below, the equity index has lost -1.3% per year.
Cycle Composite Projections: The cycle composite combines the 1-year Seasonal, 4-year Presidential, and 10-year Decennial cycles. The indicator reading shown uses the cycle projection for the upcoming week.
Trading Mode Indicator: This indicator attempts to identify whether the current trading environment is "trending" or "mean reverting." The indicator takes the composite reading of the Efficiency Ratio, the Average Correlation Coefficient, and Trend Strength models.
Volume Relationship Models: These models review the relationship between "supply" and "demand" volume over the short- and intermediate-term time frames.
Price Thrust Model Explained: This indicator measures the 3-day rate of change of the Value Line Composite relative to the standard deviation of the 30-day average. When the Value Line's 3-day rate of change have moved above 0.5 standard deviation of the 30-day average ROC, a "thrust" occurs and since 2000, the Value Line Composite has gained ground at a rate of +20.6% per year. When the indicator is below 0.5 standard deviation of the 30-day, the Value Line has lost ground at a rate of -10.0% per year. And when neutral, the Value Line has gained at a rate of +5.9% per year.
Volume Thrust Model Explained: This indicator uses NASDAQ volume data to indicate bullish and bearish conditions for the NASDAQ Composite Index. The indicator plots the ratio of the 10-day total of NASDAQ daily advancing volume (i.e., the total volume traded in stocks which rose in price each day) to the 10-day total of daily declining volume (volume traded in stocks which fell each day). This ratio indicates when advancing stocks are attracting the majority of the volume (readings above 1.0) and when declining stocks are seeing the heaviest trading (readings below 1.0). This indicator thus supports the case that a rising market supported by heavier volume in the advancing issues tends to be the most bullish condition, while a declining market with downside volume dominating confirms bearish conditions. When in a positive mode, the NASDAQ Composite has gained at a rate of +38.3% per year, When neutral, the NASDAQ has gained at a rate of +13.3% per year. And when negative, the NASDAQ has lost at a rate of -14.279% per year.
Breadth Thrust Model Explained: This indicator uses the number of NASDAQ-listed stocks advancing and declining to indicate bullish or bearish breadth conditions for the NASDAQ Composite. The indicator plots the ratio of the 10-day total of the number of stocks rising on the NASDAQ each day to the 10-day total of the number of stocks declining each day. Using 10-day totals smooths the random daily fluctuations and gives indications on an intermediate-term basis. As expected, the NASDAQ Composite performs much better when the 10-day A/D ratio is high (strong breadth) and worse when the indicator is in its lower mode (weak breadth). The most bullish conditions for the NASDAQ when the 10-day A/D indicator is not only high, but has recently posted an extreme high reading and thus indicated a thrust of upside momentum. Bearish conditions are confirmed when the indicator is low and has recently signaled a downside breadth thrust. In positive mode, the NASDAQ has gained at a rate of +22.1% per year since 1981. In a neutral mode, the NASDAQ has gained at a rate of +14.5% per year. And when in a negative mode, the NASDAQ has lost at a rate of -6.4% per year.
Short-Term Overbought/sold Indicator: This indicator is the current reading of the 14,1,3 stochastic oscillator. When the oscillator is above 80 and the %K is above the %D, the indicator gives an overbought reading. Conversely, when the oscillator is below 20 and %K is below its %D, the indicator is oversold.
Intermediate-Term Overbought/sold Indicator: This indicator is a 40-day RSI reading. When above 57.5, the indicator is considered overbought and wnen below 45 it is oversold.
Mean Reversion Model: This is a diffusion model consisting of five indicators that can produce buy and sell signals based on overbought/sold conditions.
VIX Indicator: This indicators looks at the current reading of the VIX relative to standard deviation bands. When the indicator reaches an extreme reading in either direction, it is an indication that a market trend could reverse in the near-term.
Short-Term Sentiment Indicator: This is a model-of-models composed of 18 independent sentiment indicators designed to indicate when market sentiment has reached an extreme from a short-term perspective. Historical analysis indicates that the stock market's best gains come after an environment has become extremely negative from a sentiment standpoint. Conversely, when sentiment becomes extremely positive, market returns have been subpar.
Intermediate-Term Sentiment Indicator: This is a model-of-models composed of 7 independent sentiment indicators designed to indicate when market sentiment has reached an extreme from a intermediate-term perspective. Historical analysis indicates that the stock market's best gains come after an environment has become extremely negative from a sentiment standpoint. Conversely, when sentiment becomes extremely positive, market returns have been subpar.
Long-Term Sentiment Indicator: This is a model-of-models composed of 6 independent sentiment indicators designed to indicate when market sentiment has reached an extreme from a long-term perspective. Historical analysis indicates that the stock market's best gains come after an environment has become extremely negative from a sentiment standpoint. Conversely, when sentiment becomes extremely positive, market returns have been subpar.
Absolute Monetary Model Explained: The popular cliche, "Don't fight the Fed" is really a testament to the profound impact that interest rates and Fed policy have on the market. It is a proven fact that monetary conditions are one of the most powerful influences on the direction of stock prices. The Absolute Monetary Model looks at the current level of interest rates relative to historical levels and Fed policy.
Relative Monetary Model Explained: The "relative" monetary model looks at monetary indicators relative to recent levels as well as rates of change and Fed Policy.
Economic Model Explained: During the middle of bull and bear markets, understanding the overall health of the economy and how it impacts the stock market is one of the few truly logical aspects of the stock market. When our Economic model sports a "positive" reading, history (beginning in 1965) shows that stocks enjoy returns in excess of 21% per year. Yet, when the model's reading falls into the "negative" zone, the S&P has lost nearly -25% per year. However, it is vital to understand that there are times when good economic news is actually bad for stocks and vice versa. Thus, the Economic model can help investors stay in tune with where we are in the overall economic cycle.
Inflation Model Explained: They say that "the tape tells all." However, one of the best "big picture" indicators of what the market is expected to do next is inflation. Simply put, since 1962, when the model indicates that inflationary pressures are strong, stocks have lost ground. Yet, when inflationary pressures are low, the S&P 500 has gained ground at a rate in excess of 13%. The bottom line is inflation is one of the primary drivers of stock market returns.
Valuation Model Explained: If you want to get analysts really riled up, you need only to begin a discussion of market valuation. While the question of whether stocks are overvalued or undervalued appears to be a simple one, the subject is actually extremely complex. To simplify the subject dramatically, investors must first determine if they should focus on relative valuation (which include the current level of interest rates) or absolute valuation measures (the more traditional readings of Price/Earnings, Price/Dividend, and Price/Book Value). We believe that it is important to recognize that environments change. And as such, the market's focus and corresponding view of valuations are likely to change as well. Thus, we depend on our Valuation Models to help us keep our eye on the ball.
Disclosures
NOT INVESTMENT ADVICE. The opinions and forecasts expressed herein are those of Mr. David Moenning and Heritage Capital Research and may not actually come to pass. The opinions and viewpoints regarding the future of the markets should not be construed as recommendations. The analysis and information in this report is for informational purposes only. No part of the material presented in this report is intended as an investment recommendation or investment advice. Neither the information nor any opinion expressed constitutes a solicitation to purchase or sell securities or any investment program.
Any investment decisions must in all cases be made by the reader or by his or her investment adviser. Do NOT ever purchase any security without doing sufficient research. There is no guarantee that the investment objectives outlined will actually come to pass. All opinions expressed herein are subject to change without notice. Neither the editor, employees, nor any of their affiliates shall have any liability for any loss sustained by anyone who has relied on the information provided.
Mr. Moenning of Heritage Capital Research is an investment adviser representative of Eastsound Capital Advisors, LLC, a registered investment advisor. The adviser may not transact business in states where it is not appropriately registered, excluded or exempted from registration. Individualized responses to persons that involve either the effecting of transaction in securities, or the rendering of personalized investment advice for compensation, will not be made without registration or exemption.
Mr. Moenning and Heritage Capital Research may at times have positions in the securities referred to and may make purchases or sales of these securities while publications are in circulation. Positions may change at any time.
The analysis provided is based on both technical and fundamental research and is provided "as is" without warranty of any kind, either expressed or implied. Although the information contained is derived from sources which are believed to be reliable, they cannot be guaranteed.
The author neither endorses nor warrants the content of this site, any embedded advertisement, or any linked resource. The author or his managed funds may hold either long or short positions in the referenced securities. Republication rights must be expressly granted by author in writing.
Investments in equities carry an inherent element of risk including the potential for significant loss of principal. Past performance is not an indication of future results.