What Do The Cycles Say About 2020?
Good Tuesday morning and welcome back. Last week, I took a just-for-fun stab at modeling expectations for what calendar year 2020 might look like in the U.S. stock market. And since stocks seem to only go up these days, the question of the day isn't whether or not the S&P 500 will advance on the year, but rather by how much.
If you recall, my just-for-fun model's "final answer" last week suggested the S&P 500 would close the year at 3618.47, which would represent a gain on the year of a nice, round, 12%. Given that the average return of the venerable index has been almost 9% since 1980 (8.93% to be exact, according to Ned Davis Research) and nobody sees a recession in sight, I'm happy leaning toward the bullish end of the projection spectrum these days.
While hardly scientific, I arrived at my official guesstimate by taking the average returns projected by my models (which included models on the economy, the technical health of the market, monetary conditions, inflation, leading indicators, the average election year return, and a composite of earnings models) assuming each model moved up and down one notch from current levels. It seemed to make sense to me at the time.
This week, I'd like to take a different tack and look at what some of the classic historical cycles project for the coming year.
What Do The Cycles Say?
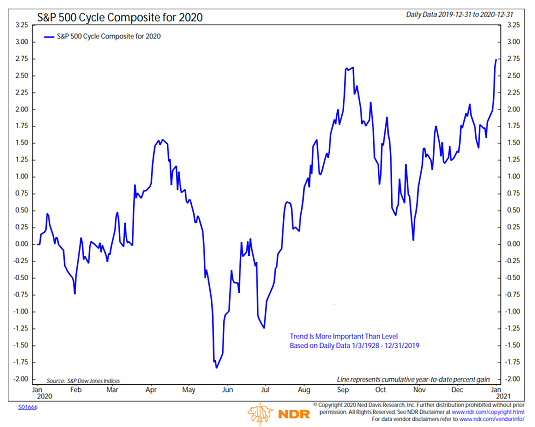
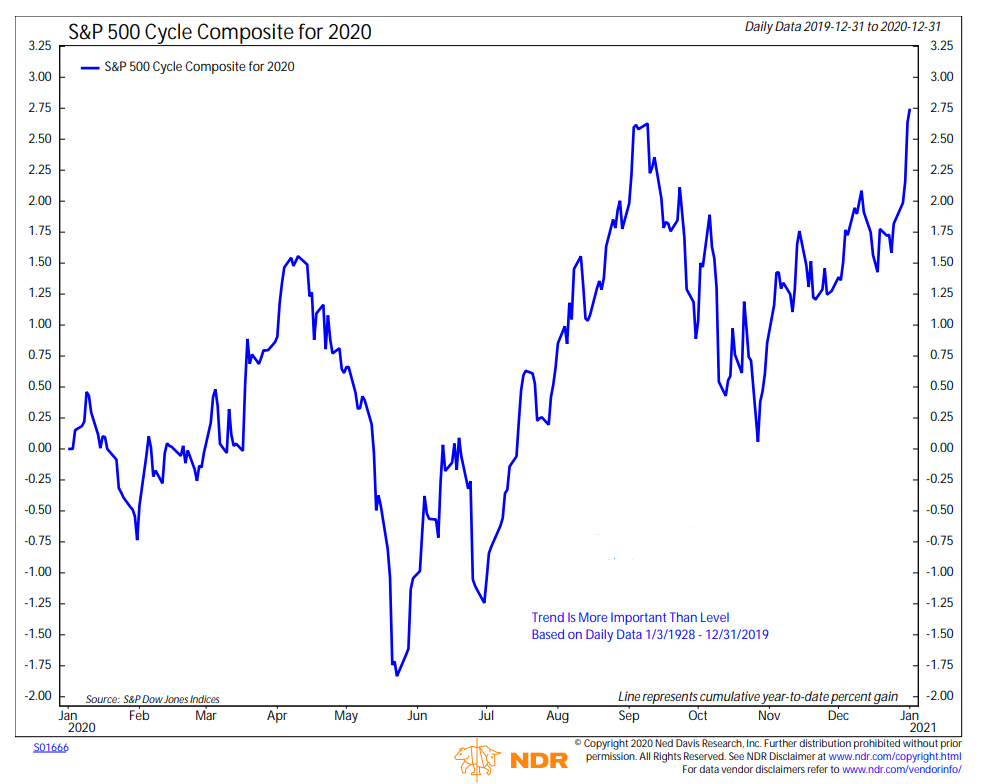
Long-time readers of my oftentimes meandering morning market missive are very familiar with something called the "Cycle Composite." This is a computerized mash-up of the one-year seasonal, the four-year Presidential, and the ten-year decennial cycles created by the good folks at Ned Davis Research.
As I have stated a time or twenty, I don't manage money based on predictions, prognostications, gut hunches, or projections. However, I have learned over the years that stocks do often follow the seasonal cycles and as such, the cycle projection can be quite good at times. As in scary good. And at other times, it can be, well, utterly useless. After all Ms. Market does tend to have a mind of her own!
But the bottom line is the various cycle projections are inputs in my daily/weekly/monthly work. So, without further ado, take a peek at this year's projection from the cycle composite:
View Full Size Chart Online
Source: Ned Davis Research Group
From my seat, this year's projection is interesting on a couple fronts. First, while I'm sorry to disappoint our furry friends in the bear camp, the projection once again suggests the S&P 500 will sport a plus sign at the end of the year.
Second, note the relatively large swoon projected to take place from mid-April through early July. This tends to be due in large part to the tendency for uncertainty to enter in the game as it relates to the Presidential election - and specifically political convention season. However, once the market gets a feel for who will be in the race, stocks tend to recover.
From there though, some additional uncertainty tends to creep in prior to the actual election. This is followed by a sigh of relief as traders realize that no matter who wins, a new President can't really get that much done on their own.
It is also interesting to recognize that the Presidential cycle tends to vary widely depending on whether or not the incumbent can be expected to win. But since I try my darndest to keep my political views out of the game, the average of the election year cycles is applied here.
My Current Market Take
Turning to the current market action, I was asked last week for my take on the state of the rally. So, I thought I'd share my response...
I'll start by saying that I had been feeling pretty good about the market - well, until recently, that is. To be sure, I enjoy a good rally as much as the next guy. But as most of my colleagues will likely agree, this "joyride to the upside" looks to be getting a little ridiculous.
It seems the macro argument is that the phase one trade deal can be expected to release the demand that has been building/pent up over the course of the trade war with China. I.E. Investors expect to see economic growth pick up in the future and are discounting the theme with higher prices. The problem here is there are no real metrics to use in the near term for how much discounting is enough. So, there is the risk that Wall Street might be overdoing it a bit – again.
Make no mistake about it; my market indicators remain solidly green. However, it is important to note that our "Early Warning" board is screaming for attention right now. As such, some sort of pause/pullback would seem to be in order. The question is, what will be the catalyst?
For me, the key to the next couple months will be how investors act during the much-anticipated pullback (assuming we get one, of course!). I know lots of folks that have money on the sidelines are currently sitting on their hands. Thus, the next dip could easily be short and sweet as the dip-buyers might all bomb in at once.
So, for "traders," it’s time to get ready for the next pullback. But for long-term investors, the plan is to ride out the pullback and see where we are after it occurs.
The bottom line is there is no threat of recession, inflation remains in check, unemployment is low, and the Fed is friendly (or at least not antagonistic). So, from a big-picture perspective, I have to continue give the bulls the benefit of the doubt.
Weekly Market Model Review
Since it's the start of a new week, it's now time to put aside my subjective view of the action and to review the "state" of our indicator boards. Each week we do a disciplined, deep dive into our key market indicators and models. The overall goal of this exercise is to (a) remove emotion from the investment process, (b) stay "in tune" with the primary market cycles, and (c) remain cognizant of the risk/reward environment.
The Major Market Models
We start with six of our favorite long-term market models. These models are designed to help determine the "state" of the overall market.
There is one change to report on the Primary Cycle board this week. While not a game changer by any means, it is worth noting that our Leading Indicators Model, slipped to high neutral last week. This is one of my favorite models because is comprised of indicators that have historically shown tendencies to lead the market at major turning points. For example, the model gave a timely sell signal in the spring of 2015, when the "earnings recession" was getting underway. The model includes things such as the action in Financials, Volume Demand, A/D Lines, Momentum, Coincidental Economic Indicators, New Highs, Bond Yields, and of course, Sentiment. To be clear, the model is nowhere near issuing a sell signal. However, I will continue to monitor this model closely as I'd hate to see any further weakness creep in.
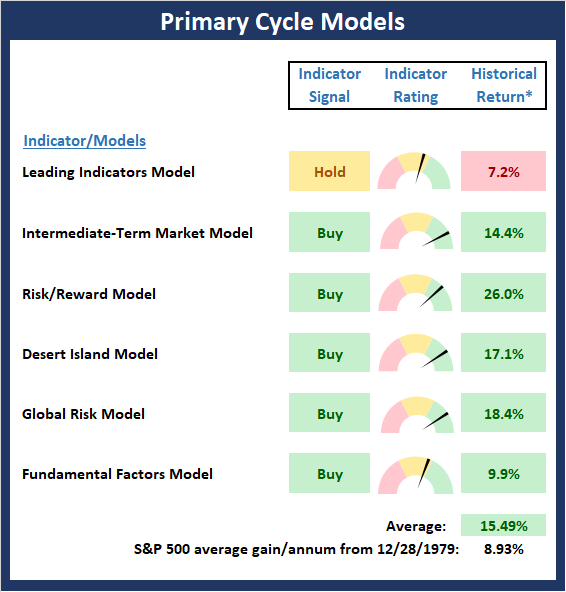
* Source: Ned Davis Research (NDR) as of the date of publication. Historical returns are hypothetical average annual performances calculated by NDR. Past performances do not guarantee future results or profitability - NOT INDIVIDUAL INVESTMENT ADVICE.
View My Favorite Market Models Online
The State of the Fundamental Backdrop
Next, we review the market's fundamental factors in the areas of interest rates, the economy, inflation, and valuations.
Once again, there was no movement on the Fundamental Factors board. Personally, I'd like to see the Earnings Composite model gain some ground in the coming months. And based on the idea that trade war uncertainty has held the economy back, there is no reason not to expect improvement. However, if "reality" doesn't catch up to "expectations" by mid-year, the bulls could have a problem on their hands.
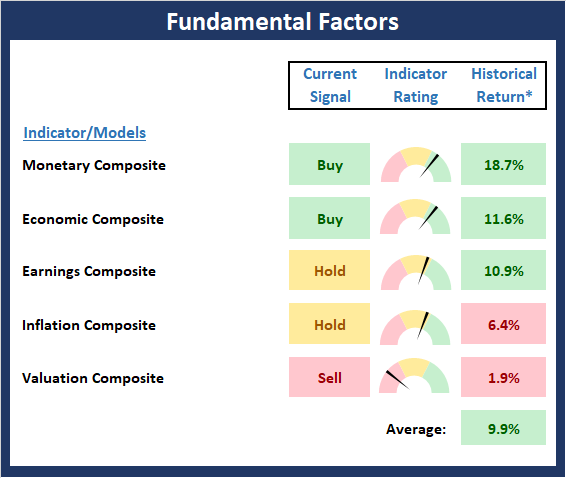
* Source: Ned Davis Research (NDR) as of the date of publication. Historical returns are hypothetical average annual performances calculated by NDR. Past performances do not guarantee future results or profitability - NOT INDIVIDUAL INVESTMENT ADVICE.
View Fundamental Indicator Board Online
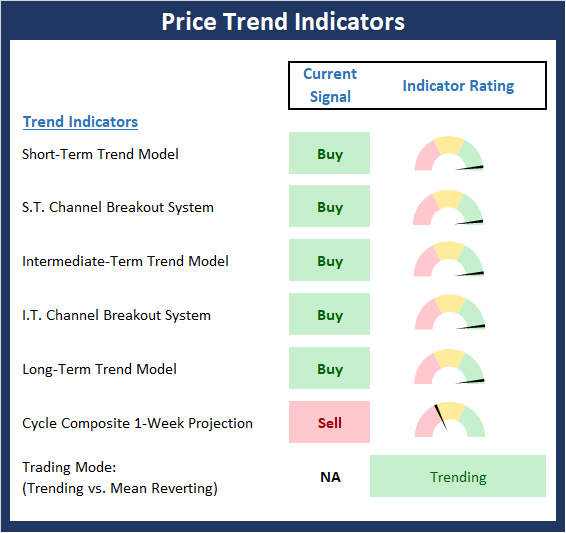
The State of the Trend
After looking at the big-picture models and the fundamental backdrop, I like to look at the state of the trend. This board of indicators is designed to tell us about the overall technical health of the current trend.
With the plethora of fresh all-time highs recently, it is beginning to feel a bit like 2017 here. It seems that the stock market is once again a one-way street and prices have nowhere to go but up. This is what happens when traders start to "discount" a theme. And make no mistake about it; the current theme is all about expectations for economic improvement due to the truce in the nearly two-year old trade war with China. In 2017, it was all about the benefits for tax cuts. But here's hoping that traders don't overdo it again (think January 2018) - that never happens, does it?
NOT INDIVIDUAL INVESTMENT ADVICE.
View Trend Indicator Board Online
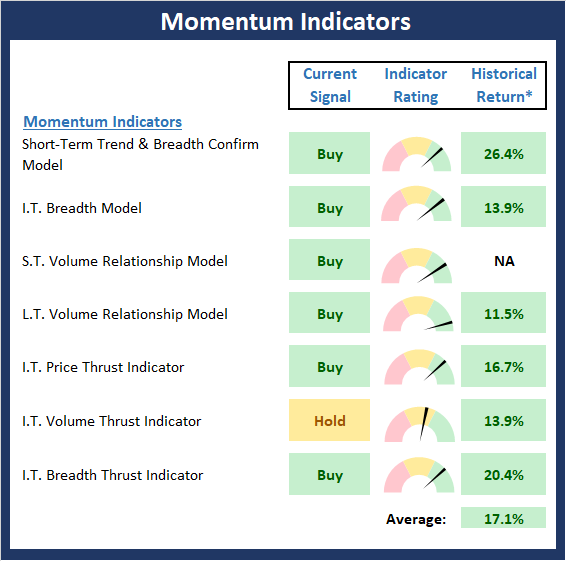
The State of Internal Momentum
Next, we analyze the "oomph" behind the current trend via our group of market momentum indicators/models.
There is some improvement to report on the Momentum board this week as two indicators upticked from neutral to positive - the Short-Term Trend & Breadth Confirm Model and the Intermediate-Term Breadth Thrust Indicators. However, both are pretty twitchy and could easily reverse at the first sign of weakness. But as I mentioned last week, the current state of market momentum remains supportive of the bull case.
* Source: Ned Davis Research (NDR) as of the date of publication. Historical returns are hypothetical average annual performances calculated by NDR. Past performances do not guarantee future results or profitability - NOT INDIVIDUAL INVESTMENT ADVICE.
View Momentum Indicator Board Online
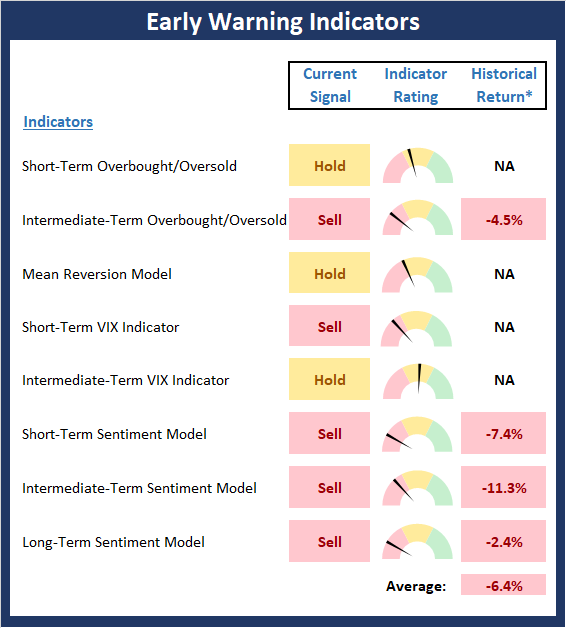
Early Warning Signals
Once we have identified the current environment, the state of the trend, and the degree of momentum behind the move, we then review the potential for a counter-trend move to begin. This batch of indicators is designed to suggest when the table is set for the trend to "go the other way."
The Early Warning board continues scream for some attention. And while I have been arguing that what we're seeing is a "good overbought" condition, the current joyride to the upside is, as I mentioned above, getting a little ridiculous. Although the bulls are clearly large and in charge here, a few days of sloppy action - including a scary down day or two - would go a long way towards making the current bull leg sustainable. As such, dip buyers should continue to stand at the ready with their shopping lists in hand.
* Source: Ned Davis Research (NDR) as of the date of publication. Historical returns are hypothetical average annual performances calculated by NDR. Past performances do not guarantee future results or profitability - NOT INDIVIDUAL INVESTMENT ADVICE.
View Early Warning Indicator Board Online
Thought For The Day:
Unthinking respect for authority is the greatest enemy of truth. -Albert Einstein
Wishing you green screens and all the best for a great day,

David D. Moenning
Founder, Chief Investment Officer
Heritage Capital Research

Disclosures
At the time of publication, Mr. Moenning held long positions in the following securities mentioned: None - Note that positions may change at any time.
Leading Indicators Model: A group of indicators that have historically shown tendencies to lead the market at major turning points.
Intermediate-Term Market Model: A composite model (model of models) focused on trend and momentum indicators which has been designed to provide identify intermediate-term trading opportunities.
Risk/Reward Model: A model-of-models intended to provide an overall view of the state of the risk/reward environment. The model includes tape, monetary, and sentiment indicators as well as 7 big-picture market model readings.
Desert Island Model: If I was stranded on a desert island with access to only one market model to manage money with, this would be the model. The model is a comprehensive model-of-models comprised of trend, momentum, mean reversion, economic, monetary, sentiment, and factor-based indicators/models.
External Factors Model: A model-of-models designed to provide a reading on the "macro state" of the market environment. The model is comprised of indicators/models in the areas of various index yields, industrial production, investors sentiment, and historic volatility.
Short-Term Trend-and-Breadth Signal Explained: History shows the most reliable market moves tend to occur when the breadth indices are in gear with the major market averages. When the breadth measures diverge, investors should take note that a trend reversal may be at hand. This indicator incorporates NDR's All-Cap Dollar Weighted Equity Series and A/D Line. From 1998, when the A/D line is above its 5-day smoothing and the All-Cap Equal Weighted Equity Series is above its 25-day smoothing, the equity index has gained at a rate of +32.5% per year. When one of the indicators is above its smoothing, the equity index has gained at a rate of +13.3% per year. And when both are below, the equity index has lost +23.6% per year.
Channel Breakout System Explained: The short-term and intermediate-term Channel Breakout Systems are modified versions of the Donchian Channel indicator. According to Wikipedia, "The Donchian channel is an indicator used in market trading developed by Richard Donchian. It is formed by taking the highest high and the lowest low of the last n periods. The area between the high and the low is the channel for the period chosen."
Intermediate-Term Trend-and-Breadth Signal Explained: This indicator incorporates NDR's All-Cap Dollar Weighted Equity Series and A/D Line. From 1998, when the A/D line is above its 45-day smoothing and the All-Cap Equal Weighted Equity Series is above its 45-day smoothing, the equity index has gained at a rate of +17.6% per year. When one of the indicators is above its smoothing, the equity index has gained at a rate of +6.5% per year. And when both are below, the equity index has lost -1.3% per year.
Cycle Composite Projections: The cycle composite combines the 1-year Seasonal, 4-year Presidential, and 10-year Decennial cycles. The indicator reading shown uses the cycle projection for the upcoming week.
Trading Mode Indicator: This indicator attempts to identify whether the current trading environment is "trending" or "mean reverting." The indicator takes the composite reading of the Efficiency Ratio, the Average Correlation Coefficient, and Trend Strength models.
Volume Relationship Models: These models review the relationship between "supply" and "demand" volume over the short- and intermediate-term time frames.
Price Thrust Model Explained: This indicator measures the 3-day rate of change of the Value Line Composite relative to the standard deviation of the 30-day average. When the Value Line's 3-day rate of change have moved above 0.5 standard deviation of the 30-day average ROC, a "thrust" occurs and since 2000, the Value Line Composite has gained ground at a rate of +20.6% per year. When the indicator is below 0.5 standard deviation of the 30-day, the Value Line has lost ground at a rate of -10.0% per year. And when neutral, the Value Line has gained at a rate of +5.9% per year.
Volume Thrust Model Explained: This indicator uses NASDAQ volume data to indicate bullish and bearish conditions for the NASDAQ Composite Index. The indicator plots the ratio of the 10-day total of NASDAQ daily advancing volume (i.e., the total volume traded in stocks which rose in price each day) to the 10-day total of daily declining volume (volume traded in stocks which fell each day). This ratio indicates when advancing stocks are attracting the majority of the volume (readings above 1.0) and when declining stocks are seeing the heaviest trading (readings below 1.0). This indicator thus supports the case that a rising market supported by heavier volume in the advancing issues tends to be the most bullish condition, while a declining market with downside volume dominating confirms bearish conditions. When in a positive mode, the NASDAQ Composite has gained at a rate of +38.3% per year, When neutral, the NASDAQ has gained at a rate of +13.3% per year. And when negative, the NASDAQ has lost at a rate of -14.279% per year.
Breadth Thrust Model Explained: This indicator uses the number of NASDAQ-listed stocks advancing and declining to indicate bullish or bearish breadth conditions for the NASDAQ Composite. The indicator plots the ratio of the 10-day total of the number of stocks rising on the NASDAQ each day to the 10-day total of the number of stocks declining each day. Using 10-day totals smooths the random daily fluctuations and gives indications on an intermediate-term basis. As expected, the NASDAQ Composite performs much better when the 10-day A/D ratio is high (strong breadth) and worse when the indicator is in its lower mode (weak breadth). The most bullish conditions for the NASDAQ when the 10-day A/D indicator is not only high, but has recently posted an extreme high reading and thus indicated a thrust of upside momentum. Bearish conditions are confirmed when the indicator is low and has recently signaled a downside breadth thrust. In positive mode, the NASDAQ has gained at a rate of +22.1% per year since 1981. In a neutral mode, the NASDAQ has gained at a rate of +14.5% per year. And when in a negative mode, the NASDAQ has lost at a rate of -6.4% per year.
Short-Term Overbought/sold Indicator: This indicator is the current reading of the 14,1,3 stochastic oscillator. When the oscillator is above 80 and the %K is above the %D, the indicator gives an overbought reading. Conversely, when the oscillator is below 20 and %K is below its %D, the indicator is oversold.
Intermediate-Term Overbought/sold Indicator: This indicator is a 40-day RSI reading. When above 57.5, the indicator is considered overbought and wnen below 45 it is oversold.
Mean Reversion Model: This is a diffusion model consisting of five indicators that can produce buy and sell signals based on overbought/sold conditions.
VIX Indicator: This indicators looks at the current reading of the VIX relative to standard deviation bands. When the indicator reaches an extreme reading in either direction, it is an indication that a market trend could reverse in the near-term.
Short-Term Sentiment Indicator: This is a model-of-models composed of 18 independent sentiment indicators designed to indicate when market sentiment has reached an extreme from a short-term perspective. Historical analysis indicates that the stock market's best gains come after an environment has become extremely negative from a sentiment standpoint. Conversely, when sentiment becomes extremely positive, market returns have been subpar.
Intermediate-Term Sentiment Indicator: This is a model-of-models composed of 7 independent sentiment indicators designed to indicate when market sentiment has reached an extreme from a intermediate-term perspective. Historical analysis indicates that the stock market's best gains come after an environment has become extremely negative from a sentiment standpoint. Conversely, when sentiment becomes extremely positive, market returns have been subpar.
Long-Term Sentiment Indicator: This is a model-of-models composed of 6 independent sentiment indicators designed to indicate when market sentiment has reached an extreme from a long-term perspective. Historical analysis indicates that the stock market's best gains come after an environment has become extremely negative from a sentiment standpoint. Conversely, when sentiment becomes extremely positive, market returns have been subpar.
Absolute Monetary Model Explained: The popular cliche, "Don't fight the Fed" is really a testament to the profound impact that interest rates and Fed policy have on the market. It is a proven fact that monetary conditions are one of the most powerful influences on the direction of stock prices. The Absolute Monetary Model looks at the current level of interest rates relative to historical levels and Fed policy.
Relative Monetary Model Explained: The "relative" monetary model looks at monetary indicators relative to recent levels as well as rates of change and Fed Policy.
Economic Model Explained: During the middle of bull and bear markets, understanding the overall health of the economy and how it impacts the stock market is one of the few truly logical aspects of the stock market. When our Economic model sports a "positive" reading, history (beginning in 1965) shows that stocks enjoy returns in excess of 21% per year. Yet, when the model's reading falls into the "negative" zone, the S&P has lost nearly -25% per year. However, it is vital to understand that there are times when good economic news is actually bad for stocks and vice versa. Thus, the Economic model can help investors stay in tune with where we are in the overall economic cycle.
Inflation Model Explained: They say that "the tape tells all." However, one of the best "big picture" indicators of what the market is expected to do next is inflation. Simply put, since 1962, when the model indicates that inflationary pressures are strong, stocks have lost ground. Yet, when inflationary pressures are low, the S&P 500 has gained ground at a rate in excess of 13%. The bottom line is inflation is one of the primary drivers of stock market returns.
Valuation Model Explained: If you want to get analysts really riled up, you need only to begin a discussion of market valuation. While the question of whether stocks are overvalued or undervalued appears to be a simple one, the subject is actually extremely complex. To simplify the subject dramatically, investors must first determine if they should focus on relative valuation (which include the current level of interest rates) or absolute valuation measures (the more traditional readings of Price/Earnings, Price/Dividend, and Price/Book Value). We believe that it is important to recognize that environments change. And as such, the market's focus and corresponding view of valuations are likely to change as well. Thus, we depend on our Valuation Models to help us keep our eye on the ball.
Disclosures
NOT INVESTMENT ADVICE. The opinions and forecasts expressed herein are those of Mr. David Moenning and Heritage Capital Research and may not actually come to pass. The opinions and viewpoints regarding the future of the markets should not be construed as recommendations. The analysis and information in this report is for informational purposes only. No part of the material presented in this report is intended as an investment recommendation or investment advice. Neither the information nor any opinion expressed constitutes a solicitation to purchase or sell securities or any investment program.
Any investment decisions must in all cases be made by the reader or by his or her investment adviser. Do NOT ever purchase any security without doing sufficient research. There is no guarantee that the investment objectives outlined will actually come to pass. All opinions expressed herein are subject to change without notice. Neither the editor, employees, nor any of their affiliates shall have any liability for any loss sustained by anyone who has relied on the information provided.
Mr. Moenning of Heritage Capital Research is an investment adviser representative of Eastsound Capital Advisors, LLC, a registered investment advisor. The adviser may not transact business in states where it is not appropriately registered, excluded or exempted from registration. Individualized responses to persons that involve either the effecting of transaction in securities, or the rendering of personalized investment advice for compensation, will not be made without registration or exemption.
Mr. Moenning and Heritage Capital Research may at times have positions in the securities referred to and may make purchases or sales of these securities while publications are in circulation. Positions may change at any time.
The analysis provided is based on both technical and fundamental research and is provided "as is" without warranty of any kind, either expressed or implied. Although the information contained is derived from sources which are believed to be reliable, they cannot be guaranteed.
The author neither endorses nor warrants the content of this site, any embedded advertisement, or any linked resource. The author or his managed funds may hold either long or short positions in the referenced securities. Republication rights must be expressly granted by author in writing.
Investments in equities carry an inherent element of risk including the potential for significant loss of principal. Past performance is not an indication of future results.