What If Something Bad Actually Happens?
In case you have somehow missed it, the ten-year anniversary of Lehman's collapse is upon us. The fall of Lehman Brothers, and perhaps more importantly, the fact that Wall Street didn't bail out the firm, is widely viewed as the trigger for the ensuing credit crisis and the "Great Recession."
Given that the economy has recovered and now appears to be humming along, and the fact that the S&P 500 has gained 337% since the crisis ended, there is no shortage of folks looking intently for the next big problem.
To be sure, most folks never see a bubble or crisis coming. Heck, very few investors even understood what was happening during the credit crisis. Thus, I find it mildly reassuring that so many are in search of the next debacle.
But since everyone and their brother is looking for things to worry about, I thought it might be a good idea to run down the growing list of issues traders are fretting over this morning - just in case something bad were to actually happen or you were feeling overly upbeat about the outlook for the markets and/or your portfolio!
The following list of worries is offered in no particular order of importance and represents about 5 minutes of scribbling while waiting for Sunday's football games to begin.
The Shift to Passive: JPMorgan's Marko Kolanovic opined last week that the $3 trillion shift from active and/or value to passive and momentum will be a problem. The trader dubbed "half man/half God" by CNBC, suggests that the lack of assets now available to active/value managers will mean less liquidity during the next market crisis, which, will, in turn, exacerbate the problem. Marko figures this situation will be a contributing factor to the next big bear, which could see the stock market to fall more than 40%.
Quants Rule: Along the same lines, it is important to understand that algos control a great deal of today's trading. It has been awhile since there were humans standing ready to buy or sell a round lot of the shares they made markets in. No, today's trading is controlled by machines, which pull liquidity the minute (oops, I mean, nanosecond) things start to look dicey. The key here is that Flash Crashes and the type of volatility event seen in February are likely to continue if/when something bad actually happens.
European Bond Yields: If there is one thing that keeps me up at night it is the fact that European bond yields trade well below their U.S. counterparts and in many cases, the yields are still negative. The question of course, is how does this end?
Economic Slowdowns: Don't look now fans but the economies of Europe and China (among others) are slowing. This obviously puts a big dent in the global growth story.
Emerging Markets: Here we go again - another emerging markets crisis appears to be upon us. Blame it on politics, inflation, global demand, or trade. But the emerging markets are now verging on bear market territory, which is to say nothing of the debt/currency troubles brewing in many markets.
Global Markets: It is said that the best bull markets are global in scope. So, if you don't make a review of the global stock market charts a part of your weekly routine, take a look a weekly chart of Europe, Japan, China, India, the Pacific Rim, Latin America, etc. Can you say, ouch?
Japan's QE: If you want to be astonished, dig into what the Bank of Japan has been doing. Insert head shaking emoji here.
Trade Wars: The "Art of the Deal" appears to be playing out in front of us on many fronts. I for one, sure hope these trade wars are indeed "easy to win." Because if they become prolonged, there are likely to be unforeseen consequences.
Political Risk: Leaving my personal view of what is happening in Washington out of it, there can be no argument that political risk is part of the game these days.
The Mid-Terms: A subcomponent of the Political Risk category is the uncertainty surrounding the Mid-Term elections. The problem here is that even if you can predict the outcome, you aren't likely to correctly predict what the market will or won't do.
Inflation: Friday's Jobs report showed that wages are starting to rise in a meaningful way. And while the Fed really can't do much on this front, a big worry is that wage inflation will become entrenched in the economy. Insert negative macro extrapolations here.
Seasonality: September is said to be the cruelest month for the stock market. And history shows that October can be a problem at times. Fingers crossed that we can get to November without much ado.
Debt: Another big-picture worry to put alongside negative yields in Europe, Japan's QE, and the potential resurgence of inflation is the monstrosity of debt that has built up in the global financial system. It is probably best to not think too long or hard about the subject as one has to wonder how this gets resolved.
Valuation: By now, my guess is that just about everybody in the game knows that stocks are overvalued from a long-term and/or traditional metric perspective. And if one looks at how the market tends to perform in the ensuing years after the market becomes overvalued, they will find it isn't pretty.
Peak Earnings: Given the corporate tax cuts and the ginormous benefits to companies, many worry that the current gains in earnings are unsustainable.
The Takeaway
Perhaps my biggest concern about the stock market has to do with the combination of the shift to passive and the quants running the markets. For me, the bottom line becomes the title of this week's missive... What if something bad actually happens?
My apologies for what will likely be viewed as a discouraging, "Negative Nancy" start to the week. And since I'm a card-carrying member of the glass-is-at-least-half-full club, it pains me to run through the laundry list of things to fret about.
Yet at the same time, I think it is important to be aware of the potential problems so that one might be able to understand what the heck is going on if one of these issues becomes the focal point of the market.
Finally, let me "talk my book" for a moment. Given the current age of the bull market and the "wall of worry" that stocks continue to climb, I think it makes a lot of sense to have a risk management plan for at least a portion of one's portfolio. If/when something bad does actually happen, I like the idea of having strategies in place that provide at least a fighting chance to reduce exposure to risk the next time the bears come to call.
Have a great week!
Moving On... Now let's turn to the weekly review of my favorite indicators and market models... "But first a word from our sponsor ;-)"...
INTRODUCING: THE ELEVATION STRATEGY
A Tax-Efficient Risk Management Strategy for the U.S. Stock Market
Believed to be unique in the industry, the Elevation strategy is a long-term, risk-managed portfolio solution designed for growth-oriented investors seeking a tax-efficient, risk-managed approach to the stock market. Our tests show that 75% of the Strategy's profitable trades since 3/31/1999 would have qualified as long-term for tax purposes.
The State of the Big-Picture Market Models
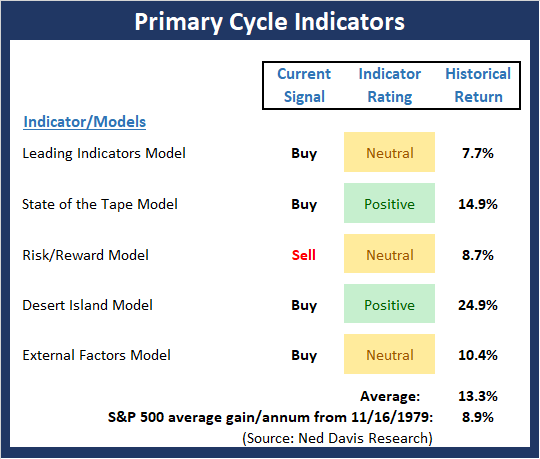
I like to start each week with a review of the state of my favorite big-picture market models, which are designed to help me determine which team is in control of the primary cycle.
View My Favorite Market Models Online
The Bottom Line:
- Despite the market moving lower on a daily basis lately, my Primary Cycle board saw some improvement last week. However, you may want to hold the champagne for now as the increases in the model readings of the Risk/Reward and Desert Island models were literally the smallest amount possible to cause the upgrades. But for now, the board looks and "feels" a bit better.
The State of the Trend
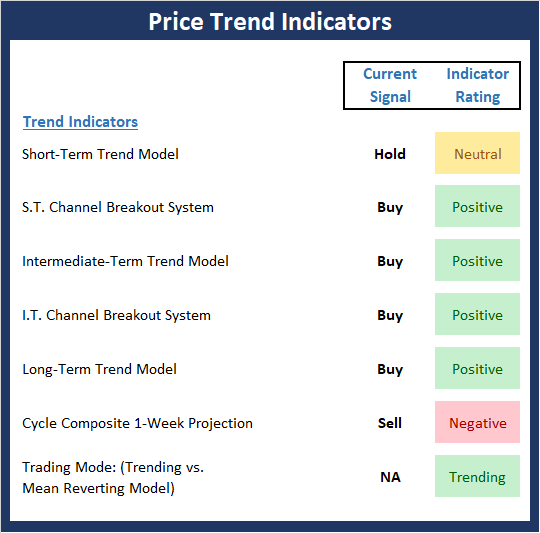
Once I've reviewed the big picture, I then turn to the "state of the trend." These indicators are designed to give us a feel for the overall health of the current short- and intermediate-term trend models.
View Trend Indicator Board Online
The Bottom Line:
- Not surprisingly, there was some deterioration in the Trend Board readings last week. However, despite the string of daily declines, the board remains in pretty decent shape.
The State of Internal Momentum
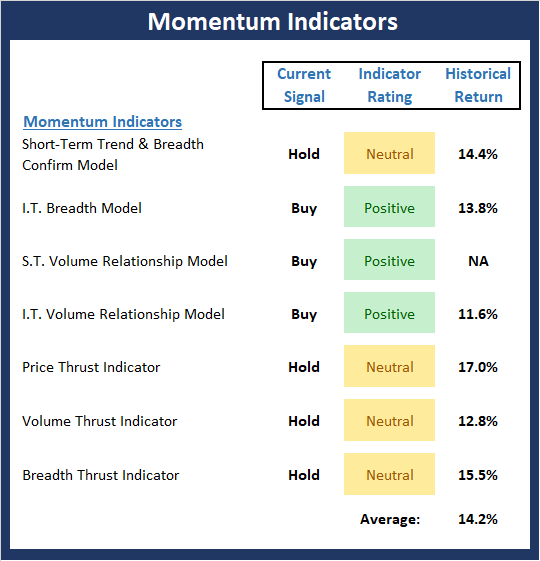
Next up are the momentum indicators, which are designed to tell us whether there is any "oomph" behind the current trend.
View Momentum Indicator Board Online
The Bottom Line:
- The Momentum board also saw some slippage this week as the shorter-term thrust indicators pulled back into the neutral zone. But overall, the board is still in good shape and sports a historical return well above the mean.
The State of the "Trade"
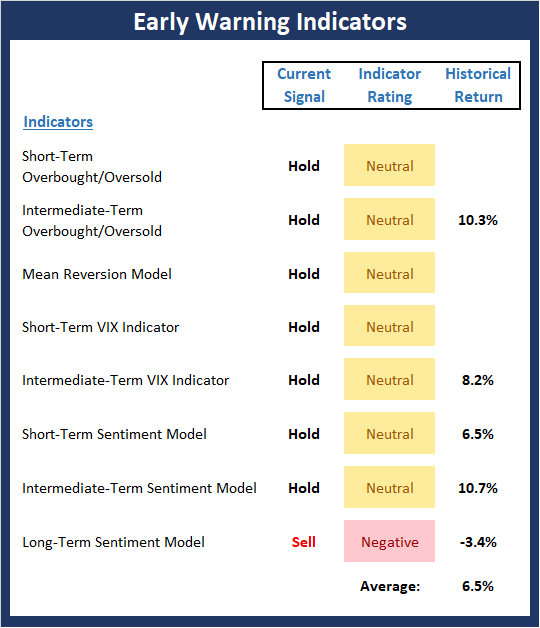
We also focus each week on the "early warning" board, which is designed to indicate when traders might start to "go the other way" -- for a trade.
View Early Warning Indicator Board Online
The Bottom Line:
- The "Early Warning" board provided a timely warning of the recent market weakness. However, those red warning flags are no longer flying, which suggests a more neutral environment. I.E. neither team has an "early warning" edge here.
The State of the Macro Picture
Now let's move on to the market's "external factors" - the indicators designed to tell us the state of the big-picture market drivers including monetary conditions, the economy, inflation, and valuations.
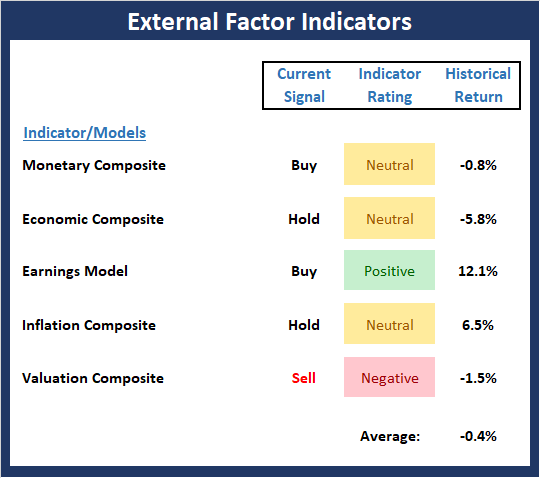
View External Factors Indicator Board Online
The Bottom Line:
- There were no changes this week to the External Factors board. The bottom line here is the board doesn't sport the bright shade of green one would expect to see with the market near all-time highs. At the very least, this should be viewed as a sign that we are late in the game for the current cyclical move.
Thought For The Day:
What the wise man does in the beginning the fool does in the end -Warren Buffett
Wishing you green screens and all the best for a great day,

David D. Moenning
Founder, Chief Investment Officer
Heritage Capital Research
HCR Focuses on a Risk-Managed Approach to Investing
What Risk Management Can and Cannot Do

ANNOUNCEMENT:
HCR Awarded Top Honors in 2018 NAAIM Shark Tank Portfolio Strategy Competition
Each year, NAAIM (National Association of Active Investment Managers) hosts a competition to identify the best actively managed investment strategies. In April, HCR's Dave Moenning took home first place for his flagship risk management strategy.
Disclosures
At the time of publication, Mr. Moenning held long positions in the following securities mentioned: None - Note that positions may change at any time.
Indicators Explained
Short-Term Trend-and-Breadth Signal Explained: History shows the most reliable market moves tend to occur when the breadth indices are in gear with the major market averages. When the breadth measures diverge, investors should take note that a trend reversal may be at hand. This indicator incorporates NDR's All-Cap Dollar Weighted Equity Series and A/D Line. From 1998, when the A/D line is above its 5-day smoothing and the All-Cap Equal Weighted Equity Series is above its 25-day smoothing, the equity index has gained at a rate of +32.5% per year. When one of the indicators is above its smoothing, the equity index has gained at a rate of +13.3% per year. And when both are below, the equity index has lost +23.6% per year.
Channel Breakout System Explained: The short-term and intermediate-term Channel Breakout Systems are modified versions of the Donchian Channel indicator. According to Wikipedia, "The Donchian channel is an indicator used in market trading developed by Richard Donchian. It is formed by taking the highest high and the lowest low of the last n periods. The area between the high and the low is the channel for the period chosen."
Intermediate-Term Trend-and-Breadth Signal Explained: This indicator incorporates NDR's All-Cap Dollar Weighted Equity Series and A/D Line. From 1998, when the A/D line is above its 45-day smoothing and the All-Cap Equal Weighted Equity Series is above its 45-day smoothing, the equity index has gained at a rate of +17.6% per year. When one of the indicators is above its smoothing, the equity index has gained at a rate of +6.5% per year. And when both are below, the equity index has lost -1.3% per year.
Cycle Composite Projections: The cycle composite combines the 1-year Seasonal, 4-year Presidential, and 10-year Decennial cycles. The indicator reading shown uses the cycle projection for the upcoming week.
Trading Mode Indicator: This indicator attempts to identify whether the current trading environment is "trending" or "mean reverting." The indicator takes the composite reading of the Efficiency Ratio, the Average Correlation Coefficient, and Trend Strength models.
Volume Relationship Models: These models review the relationship between "supply" and "demand" volume over the short- and intermediate-term time frames.
Price Thrust Model Explained: This indicator measures the 3-day rate of change of the Value Line Composite relative to the standard deviation of the 30-day average. When the Value Line's 3-day rate of change have moved above 0.5 standard deviation of the 30-day average ROC, a "thrust" occurs and since 2000, the Value Line Composite has gained ground at a rate of +20.6% per year. When the indicator is below 0.5 standard deviation of the 30-day, the Value Line has lost ground at a rate of -10.0% per year. And when neutral, the Value Line has gained at a rate of +5.9% per year.
Volume Thrust Model Explained: This indicator uses NASDAQ volume data to indicate bullish and bearish conditions for the NASDAQ Composite Index. The indicator plots the ratio of the 10-day total of NASDAQ daily advancing volume (i.e., the total volume traded in stocks which rose in price each day) to the 10-day total of daily declining volume (volume traded in stocks which fell each day). This ratio indicates when advancing stocks are attracting the majority of the volume (readings above 1.0) and when declining stocks are seeing the heaviest trading (readings below 1.0). This indicator thus supports the case that a rising market supported by heavier volume in the advancing issues tends to be the most bullish condition, while a declining market with downside volume dominating confirms bearish conditions. When in a positive mode, the NASDAQ Composite has gained at a rate of +38.3% per year, When neutral, the NASDAQ has gained at a rate of +13.3% per year. And when negative, the NASDAQ has lost at a rate of -9.8% per year.
Breadth Thrust Model Explained: This indicator uses the number of NASDAQ-listed stocks advancing and declining to indicate bullish or bearish breadth conditions for the NASDAQ Composite. The indicator plots the ratio of the 10-day total of the number of stocks rising on the NASDAQ each day to the 10-day total of the number of stocks declining each day. Using 10-day totals smooths the random daily fluctuations and gives indications on an intermediate-term basis. As expected, the NASDAQ Composite performs much better when the 10-day A/D ratio is high (strong breadth) and worse when the indicator is in its lower mode (weak breadth). The most bullish conditions for the NASDAQ when the 10-day A/D indicator is not only high, but has recently posted an extreme high reading and thus indicated a thrust of upside momentum. Bearish conditions are confirmed when the indicator is low and has recently signaled a downside breadth thrust. In positive mode, the NASDAQ has gained at a rate of +22.1% per year since 1981. In a neutral mode, the NASDAQ has gained at a rate of +14.5% per year. And when in a negative mode, the NASDAQ has lost at a rate of -6.4% per year.
Short-Term Overbought/sold Indicator: This indicator is the current reading of the 14,1,3 stochastic oscillator. When the oscillator is above 80 and the %K is above the %D, the indicator gives an overbought reading. Conversely, when the oscillator is below 20 and %K is below its %D, the indicator is oversold.
Intermediate-Term Overbought/sold Indicator: This indicator is a 40-day RSI reading. When above 57.5, the indicator is considered overbought and when below 45 it is oversold.
Mean Reversion Model: This is a diffusion model consisting of five indicators that can produce buy and sell signals based on overbought/sold conditions.
VIX Indicator: This indicator looks at the current reading of the VIX relative to standard deviation bands. When the indicator reaches an extreme reading in either direction, it is an indication that a market trend could reverse in the near-term.
Short-Term Sentiment Indicator: This is a model-of-models composed of 18 independent sentiment indicators designed to indicate when market sentiment has reached an extreme from a short-term perspective. Historical analysis indicates that the stock market's best gains come after an environment has become extremely negative from a sentiment standpoint. Conversely, when sentiment becomes extremely positive, market returns have been subpar.
Intermediate-Term Sentiment Indicator: This is a model-of-models composed of 7 independent sentiment indicators designed to indicate when market sentiment has reached an extreme from an intermediate-term perspective. Historical analysis indicates that the stock market's best gains come after an environment has become extremely negative from a sentiment standpoint. Conversely, when sentiment becomes extremely positive, market returns have been subpar.
Long-Term Sentiment Indicator: This is a model-of-models composed of 6 independent sentiment indicators designed to indicate when market sentiment has reached an extreme from a long-term perspective. Historical analysis indicates that the stock market's best gains come after an environment has become extremely negative from a sentiment standpoint. Conversely, when sentiment becomes extremely positive, market returns have been subpar.
Absolute Monetary Model Explained: The popular cliché, "Don't fight the Fed" is really a testament to the profound impact that interest rates and Fed policy have on the market. It is a proven fact that monetary conditions are one of the most powerful influences on the direction of stock prices. The Absolute Monetary Model looks at the current level of interest rates relative to historical levels and Fed policy.
Relative Monetary Model Explained: The "relative" monetary model looks at monetary indicators relative to recent levels as well as rates of change and Fed Policy.
Economic Model Explained: During the middle of bull and bear markets, understanding the overall health of the economy and how it impacts the stock market is one of the few truly logical aspects of the stock market. When our Economic model sports a "positive" reading, history (beginning in 1965) shows that stocks enjoy returns in excess of 21% per year. Yet, when the model's reading falls into the "negative" zone, the S&P has lost nearly -25% per year. However, it is vital to understand that there are times when good economic news is actually bad for stocks and vice versa. Thus, the Economic model can help investors stay in tune with where we are in the overall economic cycle.
Inflation Model Explained: They say that "the tape tells all." However, one of the best "big picture" indicators of what the market is expected to do next is inflation. Simply put, since 1962, when the model indicates that inflationary pressures are strong, stocks have lost ground. Yet, when inflationary pressures are low, the S&P 500 has gained ground at a rate in excess of 13%. The bottom line is inflation is one of the primary drivers of stock market returns.
Valuation Model Explained: If you want to get analysts really riled up, you need only to begin a discussion of market valuation. While the question of whether stocks are overvalued or undervalued appears to be a simple one, the subject is extremely complex. To simplify the subject dramatically, investors must first determine if they should focus on relative valuation (which include the current level of interest rates) or absolute valuation measures (the more traditional readings of Price/Earnings, Price/Dividend, and Price/Book Value). We believe that it is important to recognize that environments change. And as such, the market's focus and corresponding view of valuations are likely to change as well. Thus, we depend on our Valuation Models to help us keep our eye on the ball.
Disclosures
The opinions and forecasts expressed herein are those of Mr. David Moenning and may not actually come to pass. Mr. Moenning's opinions and viewpoints regarding the future of the markets should not be construed as recommendations. The analysis and information in this report is for informational purposes only. No part of the material presented in this report is intended as an investment recommendation or investment advice. Neither the information nor any opinion expressed constitutes a solicitation to purchase or sell securities or any investment program.
Any investment decisions must in all cases be made by the reader or by his or her investment adviser. Do NOT ever purchase any security without doing sufficient research. There is no guarantee that the investment objectives outlined will actually come to pass. All opinions expressed herein are subject to change without notice. Neither the editor, employees, nor any of their affiliates shall have any liability for any loss sustained by anyone who has relied on the information provided.
Mr. Moenning may at times have positions in the securities referred to and may make purchases or sales of these securities while publications are in circulation. Positions may change at any time.
The analysis provided is based on both technical and fundamental research and is provided "as is" without warranty of any kind, either expressed or implied. Although the information contained is derived from sources which are believed to be reliable, they cannot be guaranteed.
Investments in equities carry an inherent element of risk including the potential for significant loss of principal. Past performance is not an indication of future results.