When "Good Action" Isn't And The Newest Problem
Things were not looking good on Friday afternoon. At 3:00 pm eastern, the major stock market indices were at the lows of the day and falling fast. The yield on the 10-year, which is viewed by many as a proxy for the economic outlook, had plunged again, this time closing the day at 0.706% - a move of 23.76% in one day. The headlines kept coming, and they weren't painting a pretty picture. In short, it looked like the DJIA was about to get rocked for another 1,000+ point decline.
But then it happened. A furious rally from the low, that is. A searing, eye-popping move that pushed the Dow up 731 points - or 2.9% - in just 49 minutes. Yowza.
The action meant it wound up being a fairly busy afternoon talking to folks who wanted to know what the heck was going on. My first point on these calls was that the relentless rally could have been expected, as the same trend played out last Thursday/Friday. And given that Wall Street traders love them a good pattern to follow, I was actually looking for a "face ripper" Friday into the close.
My thinking was that the big boys with the really big computers make big money trading millisecond trend-following strategies in this type of environment. So, once one of these relentless trends take hold, the algos tend to simply chase their tail until the closing bell rings.
I opined that it is in everybody's best interest not to panic the masses, whose monthly 401K contributions keep money flowing into the game, too badly. My thinking was that if you can create a positive spin to end the week - you know, headlines such as, "Dow Surges 750 Points In Last Half Hour" - you keep investors in their seats and the game alive.
My admitted conspiracy theory was that by running the indices higher into the close, traders create a "feel good" situation out of a -1.7% decline in the S&P 500. Oh, and the big boys trading at the speed of light make a good buck along the way. Everybody wins, right?
Great Action, Right!
Less cynical analysts could be heard falling all over themselves on TV Friday, espousing the "great action" seen into the close. We were told that the rally was encouraging as the market "held" above last week's low. The indices had advanced on the week. Valuations were improving. And bargain hunters were stepping in.
Or Not
It turns out that there was something else at play on Friday afternoon. A little thing called "forced liquidation." In the VIX complex. In a BIG way.
The concept here is straightforward. Something called a "short squeeze" apparently caught a very large player (rumored to be the 4th largest clearing firm in Chicago) on the wrong side of a short gamma trade. And without getting too geeky, the bottom line is when you are short and then a margin call that you can't meet occurs, your short positions get liquidated. This produces buying to cover the shorts.
In this case, the VIX was sold and stock futures were bought. Rinse and repeat until the position is liquidated. Apparently, it took 49 minutes to liquidate the position.
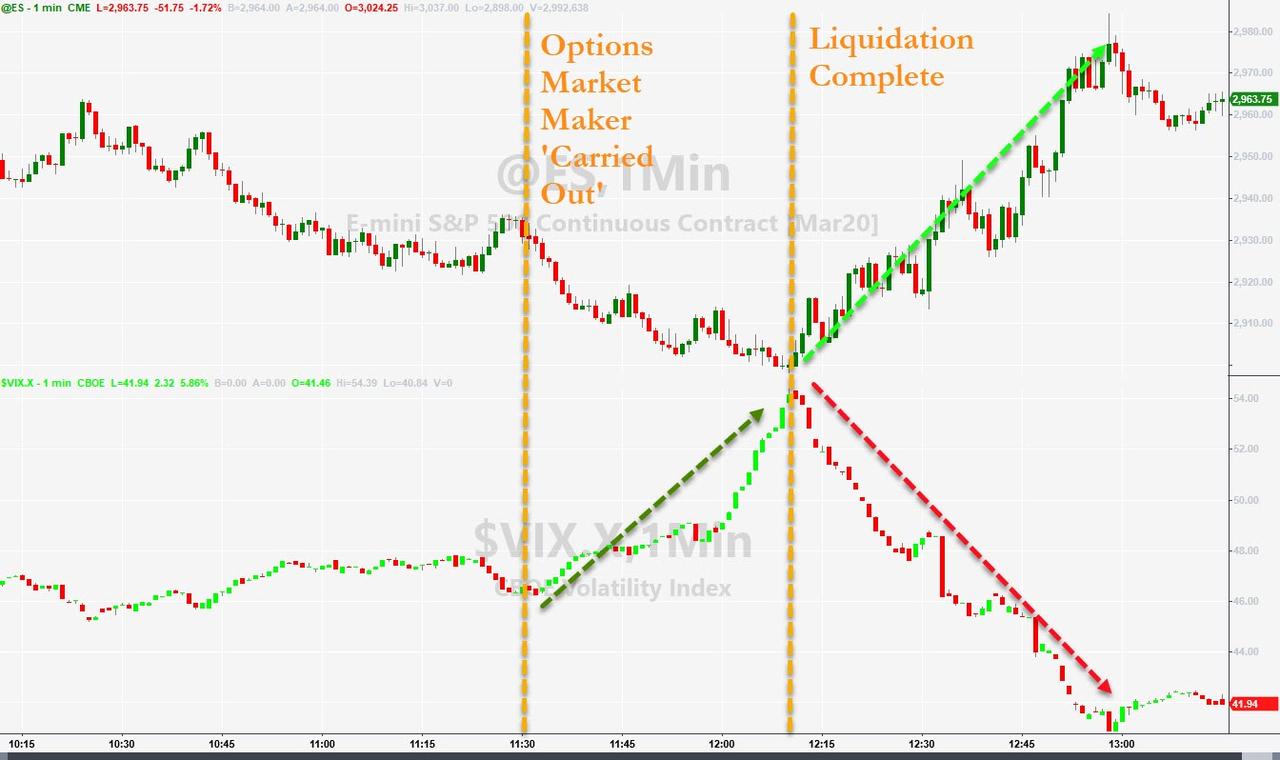
Below is a chart from ZeroHedge.com illustrating the action.
VIX and S&P 500 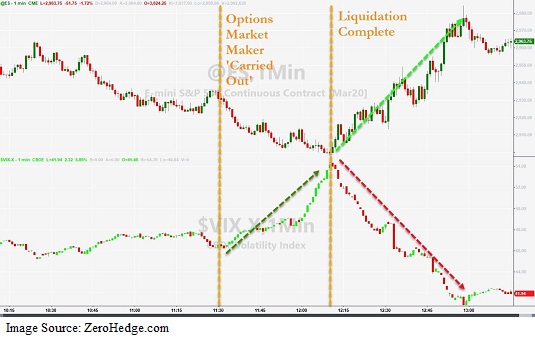
View Larger Chart
According to ZeroHedge, "what happened is that the VIX ramped as a major Chicago market maker was caught in the infamous gamma short squeeze, which forced them to keep buying the VIX as the VIX soared, in the process ending the VIX even higher, only to get margin called out of their position by their clearing firm, puking their entire position while liquidating anything they could, and unleashing the VIX selling avalanche and the 700 Dow point rally."
To be sure, this kind of thing happens often during market crises. Big moves occur that are not "sending a message." No, some big moves are just trades being closed out, whether the trader wanted them closed or not.
I'm of the mind that this and other types of computerized trading is one of the reasons why technical analysis and chart reading are not as valuable today as they once were. In short, what difference does a closing price make if that price was the result of a clearing firm liquidating positions to close out a big trade gone bad?
The answer is, in my humble opinion, next to none. As such, I'd be VERY careful in trying to read too much into the action, especially when it gets wild and woolly.
Remember What's Driving The Action
Finally, let's remember, that it is the COVID-19 news and the economic uncertainty resulting from a hunkered down consumer that is driving the primary trend right now - not technical levels.
Yes, at some point, "enough will be enough" - meaning that market prices will have discounted the appropriate impact to the economy, and in turn, earnings. But in reality, it will likely take time for this to occur. And while I'm a card-carrying member of "the glass is at least half-full" club, I can't help but believe the news from the virus front is going to get worse before it gets better (or in this case, stops getting worse). Therefore, we need to stay patient and keep our eye on the end game here - I.E. How the economy is going to fare.
From my seat, this means keeping some powder dry and managing the risk of the environment. Personally, I don't think we should expect to see a quick, V-bottom turnaround as the Fed can't really save the day here. And while both monetary and fiscal stimulus can help reduce the economic impact, the bottom line is that unless cases stop spreading pronto, this is gonna take a while.
Turning to This Morning's Debacle
This morning's action in the markets is once again, nothing short of wild. Bond yields are plunging (the 10-year has traded at 0.398% - are you kidding me!?!). Oil is crashing. And stocks are diving around the world. The reason, you ask? Besides the increasingly bad news on the virus front in places other than China, we have a new negative input into the game.
Keeping it brief, the fact that oil is crashing again brings another negative component into the mix. Before the latest plunge in crude prices, we only had to deal with the economic impact from COVID-19. Now we have to deal with the potential fallout from crude's rude move.
The problem is basically a replay of 2015/16. Oil in the $30's means shale producers are not profitable. And since the bonds of these companies are typically in the lower end of the scale (think BBB - or the lowest level of investment grade) and highly leveraged, risk of default increases when oil falls. This puts the nightmare scenario of a potential "downgrade cycle" in play.
This is where BBB debt gets downgraded to junk. Which, in turn, causes FORCED SELLING of the new junk debt. And with everyone in the space trying to make the same trade at the same time, market dislocations occur (which is a kinder, gentler term for the word collapse). Rinse and repeat and welcome to the next credit crisis.
To be sure, this is NOT occurring at the present time. But it is uber important to recognize the risk of such an event playing out - globally.
So, my primary point to close this morning's meandering market missive is there is now more to worry about than washing your hands, canceling your business trips, and calculating how far GDP will fall. No, we now have to watch the oil patch and the derivative problems created. Joy.
Weekly Market Model Review
Each week we do a disciplined, deep dive into our key market indicators and models. The overall goal of this exercise is to (a) remove emotion from the investment process, (b) stay "in tune" with the primary market cycles, and (c) remain cognizant of the risk/reward environment.
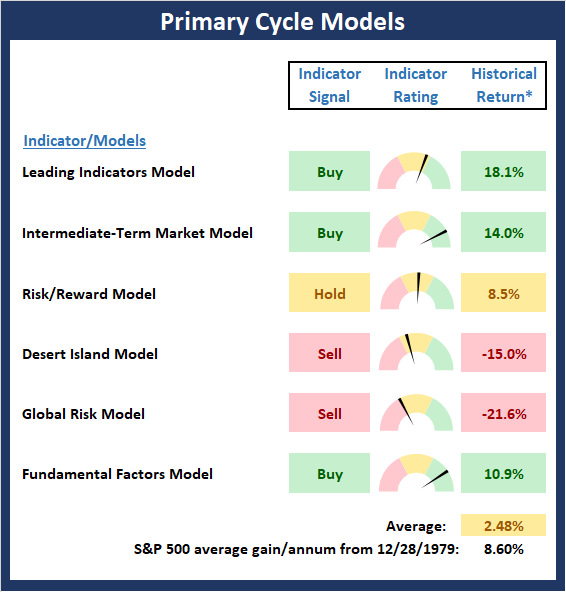
The Major Market Models
We start with six of our favorite long-term market models. These models are designed to help determine the "state" of the overall market.
There are two changes to report on the Primary Cycle board this week. First, the Risk/Reward model moved back to neutral from positive. Then my "Desert Island" model (so named because if I were stranded on a desert island with only one model available, this would be the one I choose) moved from neutral to negative. And with the average historical return for the board now well below average, I have no choice but to downgrade the rating of the board to neutral.
* Source: Ned Davis Research (NDR) as of the date of publication. Historical returns are hypothetical average annual performances calculated by NDR. Past performances do not guarantee future results or profitability - NOT INDIVIDUAL INVESTMENT ADVICE.
View My Favorite Market Models Online
The State of the Fundamental Backdrop
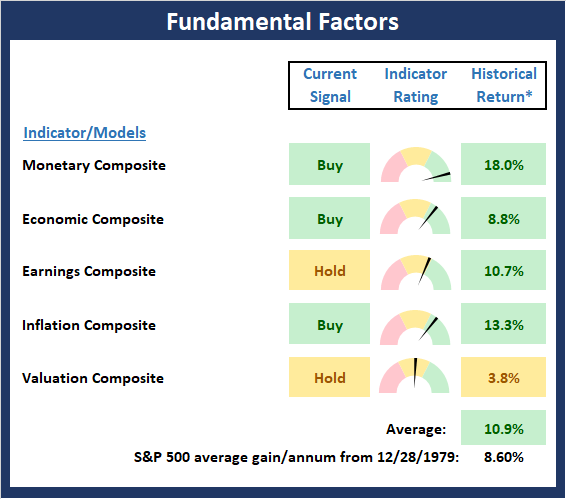
Next, we review the market's fundamental factors in the areas of interest rates, the economy, inflation, and valuations.
The good news is that there are no changes to report on the Fundamental Factors board this week. However, it is worth noting that one the component indicators in the Valuation Model continues to improve as valuations on the Value Line index are now back to where they stood at the bottoms seen in 2019 and August of last year (but still far from the levels seen at the bottom of January 2019.) In short, I consider the status of the Fundamental board as Exhibit A in the argument that the bull market remains intact and the uptrend will resume once the market sorts through/comes to grips with how much the U.S. economy will slow in response to consumers "hunkering down."
* Source: Ned Davis Research (NDR) as of the date of publication. Historical returns are hypothetical average annual performances calculated by NDR. Past performances do not guarantee future results or profitability - NOT INDIVIDUAL INVESTMENT ADVICE.
View Fundamental Indicator Board Online
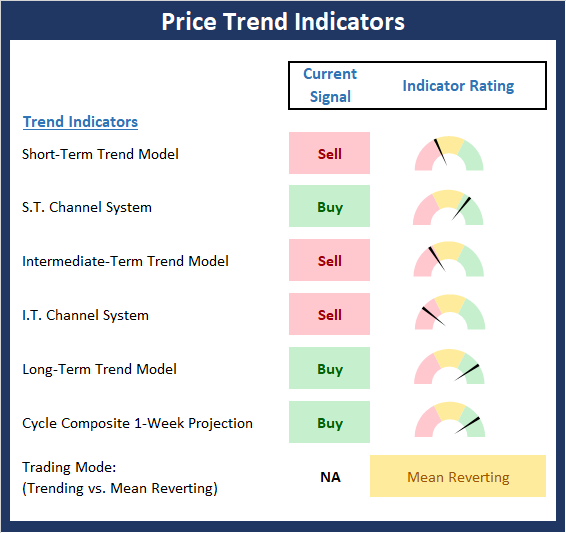
The State of the Trend
After looking at the big-picture models and the fundamental backdrop, I like to look at the state of the trend. This board of indicators is designed to tell us about the overall technical health of the current trend.
While I may be accused of looking on the bright side, I think it's a modest positive that the Price Trend board actually improved a bit last week. The reason for the uptick was the buy signal flashed by our Short-Term Channel System. And as long as the market does not exceed the Feb 28 low, this indicator will remain positive. Speaking of the 2/28 low, this remains a critical technical area on both a closing and intraday basis.
NOT INDIVIDUAL INVESTMENT ADVICE.
View Trend Indicator Board Online
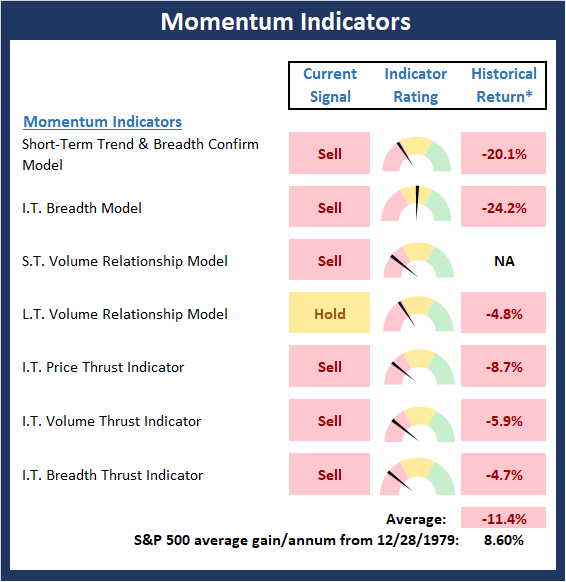
The State of Internal Momentum
Next, we analyze the "oomph" behind the current trend via our group of market momentum indicators/models.
The bad news is there is no longer anything positive on the Momentum Board. And in the category of full and fair disclosure, the L.T. Volume Relationship Model is within a whisker of moving to a sell signal. As such, the bears can claim that they've got market momentum (not to be confused with "Jomentum" of course - LOL) on their side. However, given the veracity of the current dance to the downside, the current state of the momentum board is to be expected.
* Source: Ned Davis Research (NDR) as of the date of publication. Historical returns are hypothetical average annual performances calculated by NDR. Past performances do not guarantee future results or profitability - NOT INDIVIDUAL INVESTMENT ADVICE.
View Momentum Indicator Board Online
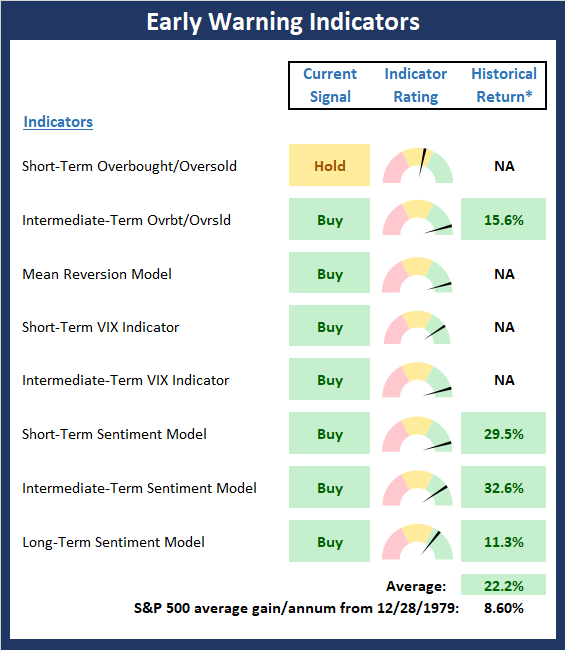
Early Warning Signals
Once we have identified the current environment, the state of the trend, and the degree of momentum behind the move, we then review the potential for a counter-trend move to begin. This batch of indicators is designed to suggest when the table is set for the trend to "go the other way."
The really good news this week is the Early Warning board is now screaming for attention. This suggests that a tradable bounce may be close at hand. However, my take on the situation is that a series of tests to the downside is likely. I say this because the news of the novel coronavirus is just getting started in the U.S. and is likely to get nasty before it improves.
* Source: Ned Davis Research (NDR) as of the date of publication. Historical returns are hypothetical average annual performances calculated by NDR. Past performances do not guarantee future results or profitability - NOT INDIVIDUAL INVESTMENT ADVICE.
View Early Warning Indicator Board Online
Thought For The Day:
The only thing that interferes with my learning is my education. - Albert Einstein
Wishing you green screens and all the best for a great day,

David D. Moenning
Founder, Chief Investment Officer
Heritage Capital Research

Disclosures
At the time of publication, Mr. Moenning held long positions in the following securities mentioned: None - Note that positions may change at any time.
Leading Indicators Model: A group of indicators that have historically shown tendencies to lead the market at major turning points.
Intermediate-Term Market Model: A composite model (model of models) focused on trend and momentum indicators which has been designed to provide identify intermediate-term trading opportunities.
Risk/Reward Model: A model-of-models intended to provide an overall view of the state of the risk/reward environment. The model includes tape, monetary, and sentiment indicators as well as 7 big-picture market model readings.
Desert Island Model: If I was stranded on a desert island with access to only one market model to manage money with, this would be the model. The model is a comprehensive model-of-models comprised of trend, momentum, mean reversion, economic, monetary, sentiment, and factor-based indicators/models.
External Factors Model: A model-of-models designed to provide a reading on the "macro state" of the market environment. The model is comprised of indicators/models in the areas of various index yields, industrial production, investors sentiment, and historic volatility.
Short-Term Trend-and-Breadth Signal Explained: History shows the most reliable market moves tend to occur when the breadth indices are in gear with the major market averages. When the breadth measures diverge, investors should take note that a trend reversal may be at hand. This indicator incorporates NDR's All-Cap Dollar Weighted Equity Series and A/D Line. From 1998, when the A/D line is above its 5-day smoothing and the All-Cap Equal Weighted Equity Series is above its 25-day smoothing, the equity index has gained at a rate of +32.5% per year. When one of the indicators is above its smoothing, the equity index has gained at a rate of +13.3% per year. And when both are below, the equity index has lost +23.6% per year.
Channel Breakout System Explained: The short-term and intermediate-term Channel Breakout Systems are modified versions of the Donchian Channel indicator. According to Wikipedia, "The Donchian channel is an indicator used in market trading developed by Richard Donchian. It is formed by taking the highest high and the lowest low of the last n periods. The area between the high and the low is the channel for the period chosen."
Intermediate-Term Trend-and-Breadth Signal Explained: This indicator incorporates NDR's All-Cap Dollar Weighted Equity Series and A/D Line. From 1998, when the A/D line is above its 45-day smoothing and the All-Cap Equal Weighted Equity Series is above its 45-day smoothing, the equity index has gained at a rate of +17.6% per year. When one of the indicators is above its smoothing, the equity index has gained at a rate of +6.5% per year. And when both are below, the equity index has lost -1.3% per year.
Cycle Composite Projections: The cycle composite combines the 1-year Seasonal, 4-year Presidential, and 10-year Decennial cycles. The indicator reading shown uses the cycle projection for the upcoming week.
Trading Mode Indicator: This indicator attempts to identify whether the current trading environment is "trending" or "mean reverting." The indicator takes the composite reading of the Efficiency Ratio, the Average Correlation Coefficient, and Trend Strength models.
Volume Relationship Models: These models review the relationship between "supply" and "demand" volume over the short- and intermediate-term time frames.
Price Thrust Model Explained: This indicator measures the 3-day rate of change of the Value Line Composite relative to the standard deviation of the 30-day average. When the Value Line's 3-day rate of change have moved above 0.5 standard deviation of the 30-day average ROC, a "thrust" occurs and since 2000, the Value Line Composite has gained ground at a rate of +20.6% per year. When the indicator is below 0.5 standard deviation of the 30-day, the Value Line has lost ground at a rate of -10.0% per year. And when neutral, the Value Line has gained at a rate of +5.9% per year.
Volume Thrust Model Explained: This indicator uses NASDAQ volume data to indicate bullish and bearish conditions for the NASDAQ Composite Index. The indicator plots the ratio of the 10-day total of NASDAQ daily advancing volume (i.e., the total volume traded in stocks which rose in price each day) to the 10-day total of daily declining volume (volume traded in stocks which fell each day). This ratio indicates when advancing stocks are attracting the majority of the volume (readings above 1.0) and when declining stocks are seeing the heaviest trading (readings below 1.0). This indicator thus supports the case that a rising market supported by heavier volume in the advancing issues tends to be the most bullish condition, while a declining market with downside volume dominating confirms bearish conditions. When in a positive mode, the NASDAQ Composite has gained at a rate of +38.3% per year, When neutral, the NASDAQ has gained at a rate of +13.3% per year. And when negative, the NASDAQ has lost at a rate of -14.279% per year.
Breadth Thrust Model Explained: This indicator uses the number of NASDAQ-listed stocks advancing and declining to indicate bullish or bearish breadth conditions for the NASDAQ Composite. The indicator plots the ratio of the 10-day total of the number of stocks rising on the NASDAQ each day to the 10-day total of the number of stocks declining each day. Using 10-day totals smooths the random daily fluctuations and gives indications on an intermediate-term basis. As expected, the NASDAQ Composite performs much better when the 10-day A/D ratio is high (strong breadth) and worse when the indicator is in its lower mode (weak breadth). The most bullish conditions for the NASDAQ when the 10-day A/D indicator is not only high, but has recently posted an extreme high reading and thus indicated a thrust of upside momentum. Bearish conditions are confirmed when the indicator is low and has recently signaled a downside breadth thrust. In positive mode, the NASDAQ has gained at a rate of +22.1% per year since 1981. In a neutral mode, the NASDAQ has gained at a rate of +14.5% per year. And when in a negative mode, the NASDAQ has lost at a rate of -6.4% per year.
Short-Term Overbought/sold Indicator: This indicator is the current reading of the 14,1,3 stochastic oscillator. When the oscillator is above 80 and the %K is above the %D, the indicator gives an overbought reading. Conversely, when the oscillator is below 20 and %K is below its %D, the indicator is oversold.
Intermediate-Term Overbought/sold Indicator: This indicator is a 40-day RSI reading. When above 57.5, the indicator is considered overbought and wnen below 45 it is oversold.
Mean Reversion Model: This is a diffusion model consisting of five indicators that can produce buy and sell signals based on overbought/sold conditions.
VIX Indicator: This indicators looks at the current reading of the VIX relative to standard deviation bands. When the indicator reaches an extreme reading in either direction, it is an indication that a market trend could reverse in the near-term.
Short-Term Sentiment Indicator: This is a model-of-models composed of 18 independent sentiment indicators designed to indicate when market sentiment has reached an extreme from a short-term perspective. Historical analysis indicates that the stock market's best gains come after an environment has become extremely negative from a sentiment standpoint. Conversely, when sentiment becomes extremely positive, market returns have been subpar.
Intermediate-Term Sentiment Indicator: This is a model-of-models composed of 7 independent sentiment indicators designed to indicate when market sentiment has reached an extreme from a intermediate-term perspective. Historical analysis indicates that the stock market's best gains come after an environment has become extremely negative from a sentiment standpoint. Conversely, when sentiment becomes extremely positive, market returns have been subpar.
Long-Term Sentiment Indicator: This is a model-of-models composed of 6 independent sentiment indicators designed to indicate when market sentiment has reached an extreme from a long-term perspective. Historical analysis indicates that the stock market's best gains come after an environment has become extremely negative from a sentiment standpoint. Conversely, when sentiment becomes extremely positive, market returns have been subpar.
Absolute Monetary Model Explained: The popular cliche, "Don't fight the Fed" is really a testament to the profound impact that interest rates and Fed policy have on the market. It is a proven fact that monetary conditions are one of the most powerful influences on the direction of stock prices. The Absolute Monetary Model looks at the current level of interest rates relative to historical levels and Fed policy.
Relative Monetary Model Explained: The "relative" monetary model looks at monetary indicators relative to recent levels as well as rates of change and Fed Policy.
Economic Model Explained: During the middle of bull and bear markets, understanding the overall health of the economy and how it impacts the stock market is one of the few truly logical aspects of the stock market. When our Economic model sports a "positive" reading, history (beginning in 1965) shows that stocks enjoy returns in excess of 21% per year. Yet, when the model's reading falls into the "negative" zone, the S&P has lost nearly -25% per year. However, it is vital to understand that there are times when good economic news is actually bad for stocks and vice versa. Thus, the Economic model can help investors stay in tune with where we are in the overall economic cycle.
Inflation Model Explained: They say that "the tape tells all." However, one of the best "big picture" indicators of what the market is expected to do next is inflation. Simply put, since 1962, when the model indicates that inflationary pressures are strong, stocks have lost ground. Yet, when inflationary pressures are low, the S&P 500 has gained ground at a rate in excess of 13%. The bottom line is inflation is one of the primary drivers of stock market returns.
Valuation Model Explained: If you want to get analysts really riled up, you need only to begin a discussion of market valuation. While the question of whether stocks are overvalued or undervalued appears to be a simple one, the subject is actually extremely complex. To simplify the subject dramatically, investors must first determine if they should focus on relative valuation (which include the current level of interest rates) or absolute valuation measures (the more traditional readings of Price/Earnings, Price/Dividend, and Price/Book Value). We believe that it is important to recognize that environments change. And as such, the market's focus and corresponding view of valuations are likely to change as well. Thus, we depend on our Valuation Models to help us keep our eye on the ball.
Disclosures
NOT INVESTMENT ADVICE. The opinions and forecasts expressed herein are those of Mr. David Moenning and Heritage Capital Research and may not actually come to pass. The opinions and viewpoints regarding the future of the markets should not be construed as recommendations. The analysis and information in this report is for informational purposes only. No part of the material presented in this report is intended as an investment recommendation or investment advice. Neither the information nor any opinion expressed constitutes a solicitation to purchase or sell securities or any investment program.
Any investment decisions must in all cases be made by the reader or by his or her investment adviser. Do NOT ever purchase any security without doing sufficient research. There is no guarantee that the investment objectives outlined will actually come to pass. All opinions expressed herein are subject to change without notice. Neither the editor, employees, nor any of their affiliates shall have any liability for any loss sustained by anyone who has relied on the information provided.
Mr. Moenning of Heritage Capital Research is an investment adviser representative of Eastsound Capital Advisors, LLC, a registered investment advisor. The adviser may not transact business in states where it is not appropriately registered, excluded or exempted from registration. Individualized responses to persons that involve either the effecting of transaction in securities, or the rendering of personalized investment advice for compensation, will not be made without registration or exemption.
Mr. Moenning and Heritage Capital Research may at times have positions in the securities referred to and may make purchases or sales of these securities while publications are in circulation. Positions may change at any time.
The analysis provided is based on both technical and fundamental research and is provided "as is" without warranty of any kind, either expressed or implied. Although the information contained is derived from sources which are believed to be reliable, they cannot be guaranteed.
The author neither endorses nor warrants the content of this site, any embedded advertisement, or any linked resource. The author or his managed funds may hold either long or short positions in the referenced securities. Republication rights must be expressly granted by author in writing.
Investments in equities carry an inherent element of risk including the potential for significant loss of principal. Past performance is not an indication of future results.