Both Teams Appear To Have An Argument
What a difference a week makes in this game, right? At this time last week, we were celebrating the "Goldilocks" economic data and the six-day run higher in stocks that pushed the NASDAQ Composite to a fresh all-time high. However, five days and four big, red candlesticks later, the enthusiasm for the market appears to be waning.
Some are even saying the bull case has eroded a bit as all the talk of political turmoil, more/new tariffs (and of course, the potential for trade wars with folks like China to ensue), inflation, and double tops on the charts kept the sellers active last week. With traders selling into almost every rally attempt, the "pin action" wasn't great and the S&P finished the week almost on top of its 50-day ma. Can you say, "decision time?"
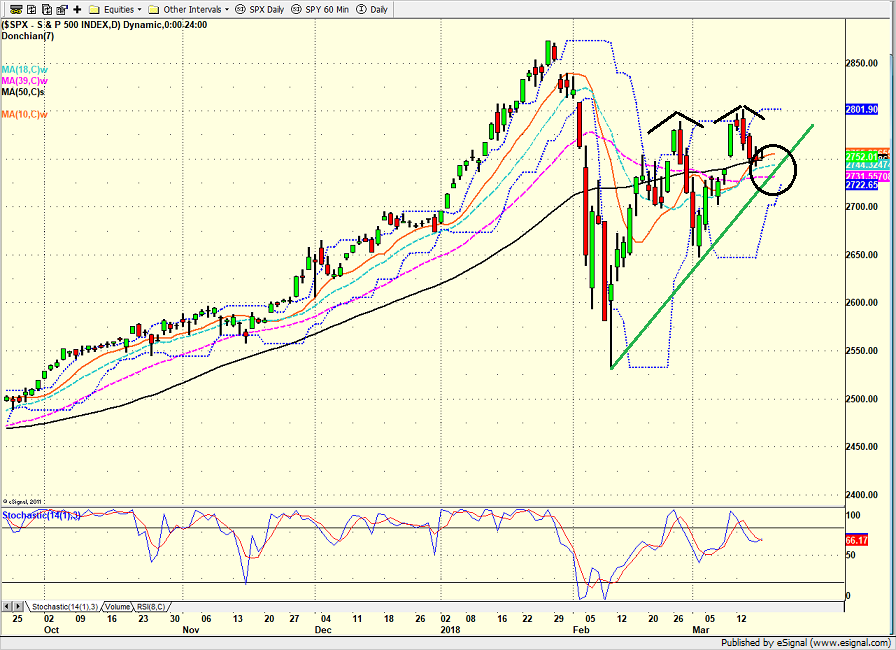
In reviewing the charts, the good news is the uptrend for the S&P 500 that began on Friday, February 9 remains intact. The bad news is that a short-term double top appears to have formed. So, it would appear that both teams have an argument at this point.
S&P 500- Daily 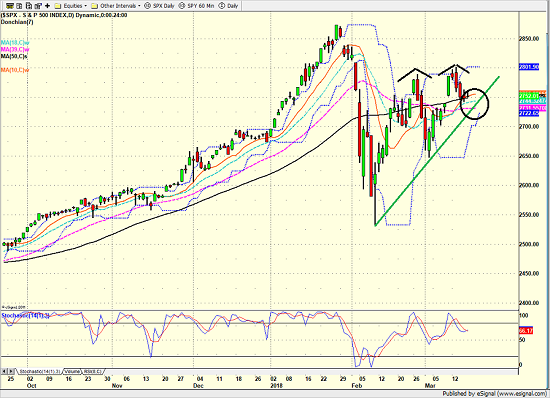
View Larger Image Online
Then there is the abundance of technical stuff (including near-term support, the afore-mentioned 50-day, etc.) that sits just below where the S&P closed on Friday - illustrated by the circle on the chart above.
So, the first point I'll make to start the week is the price action has gotten sloppy and there is a bunch of key levels just below. Therefore, how Ms. Market acts in the near-term will likely be quite telling in terms of the next important move in the market.
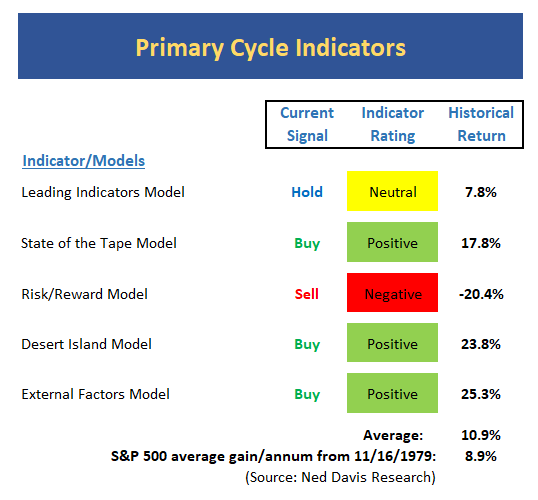
The second point is that while my "Primary Cycle" board below looks to be in pretty darn good shape, my "External Factors" board does not. And while we can argue all the "yea, buts" involved with the external indicators, the key is my favorite longer-term models sport a lot of green while not a single one of the monetary models, the economic composite, the inflation model and the valuation models are positive.
So, for a guy that focuses on managing the risk/reward environment, this presents a bit of a quandary.
My takeaway from this week's review of the indicator boards is that this market has some issues and the ride is likely to be bumpy for a while. But, as I've been saying for some time now, I believe the bulls continue to deserve the benefit of any doubt and the dips (especially the bigger ones) should be bought. For now.
Thought For The Day:
He that takes medicine and neglects diet, wastes the skill of the physician. -Chinese Proverb
Wishing you green screens and all the best for a great day,

David D. Moenning
Founder, Chief Investment Officer
Heritage Capital Research
HCR Focuses on a Risk-Managed Approach to Investing
Must Read: What Risk Management Can and Cannot Do
HCR's Financial Advisor Services
HCR's Individual Investor Services
Questions, comments, or ideas? Contact Us
At the time of publication, Mr. Moenning held long positions in the following securities mentioned: None - Note that positions may change at any time.
The State of the Big-Picture Market Models
It's a new week, so let's start things off with a review of the state of my favorite big-picture market models, which are designed to tell us which team is in control of the prevailing major trend.
View My Favorite Market Models Online
Executive Summary:
- The long-term Leading Indicators model remains on a long-term buy signal. However, the indicator level slipped again last week and is now very close to the sell zone.
- Our recently upgraded "State of the tape" model remains in good shape with a reading of 83%. This tells us to give the bulls the benefit of doubt.
- The Risk/Reward model remains negative and on sell signal. The big question is if the model is "out of whack" or issuing a very loud warning signal. Time will tell, but with this model negative, we have been warned that all is not right with the indicator world.
- My "desert island" model (which combines trend, momentum, and external factors) remains on a buy signal.
- The recently expanded External Factors model remains green, albeit by only a modest margin. For me, this is a good summary of the current environment.
- The Primary Cycle board tells the story here. The overall message of the board is positive, but (a) the board is not hitting on all cylinders and (b) some of the green should be "light green". So, my take is things aren't quite as good as the board might imply.
The State of the Trend
Digging into the details, I like to start my weekly review with a look at the "state of the trend." These indicators are designed to give us a feel for the overall health of the current short- and intermediate-term trend models.
View Trend Indicator Board Online
Executive Summary:
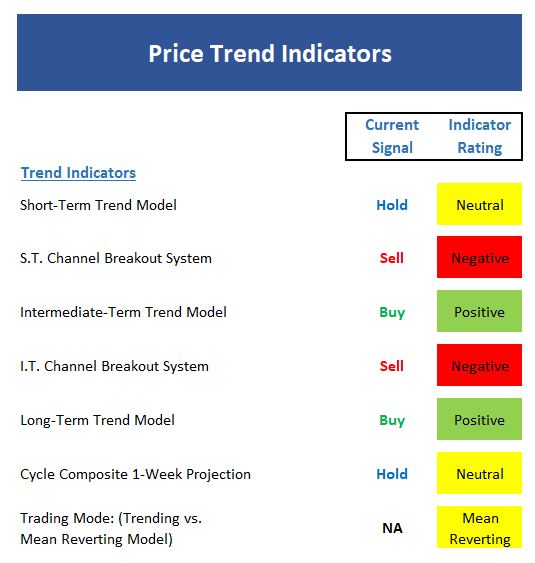
- The short-term trend of the stock market slipped to neutral after a week of selling. And with a confluence of important ma's all in a similar spot here, the near-term price action takes on added importance.
- With stocks in a mean-reverting mode, a timely sell signal was produced by our channel breakout system. To review, this system bought on 3/5 and sold on 3/13 - so a nice trade was captured during this sideways market environment.
- The intermediate-term Trend Model remains green to start the week, but not by much. A weekly close below 2752 will flip this indicator to red.
- The intermediate-term Channel Breakout System remains on a sell signal. A close above 2801 would produce a new buy signal next week.
- The long-term Trend Model remains positive. This tell us this is a bull market until proven otherwise.
- The Cycle Composite points sideways this week and down into the beginning of April.
- From an intermediate-term perspective, the market remains in a mean-reverting mode.
- In sum, the market appears to be establishing both a new trading range and equilibrium point.
The State of Internal Momentum
Next up are the momentum indicators, which are designed to tell us whether there is any "oomph" behind the current trend.
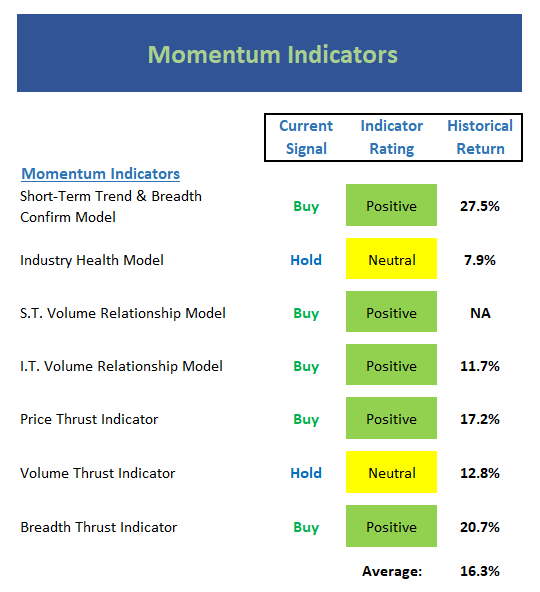
View Momentum Indicator Board Online
Executive Summary:
- The short-term Trend and Breadth Confirm Model remains positive to start week. Normally, this tells us to lean bullish. However, given that this indicator has been in flip-flop mode for a while now, I'm keeping my enthusiasm curbed.
- The Industry Health Model remains stuck in the neutral zone. It is interesting to note that the historical returns within this zone have been a bit below the historical mean since 1980 (7.84% vs. 8.84%)
- The short-term Volume Relationship model improved enough to flip the indicator green. However, the margin between positive and negative is slim at this point.
- The intermediate-term Volume Relationship Model remains positive and continues to argue that this is a bull market until proven otherwise.
- The intermediate-term Price Thrust Indicator remains positive.
- The Volume Thrust Indicator continues to hang out in the neutral zone.
- The Breadth Thrust Indicator remains on its 2/23 buy signal.
- Although there is a lot of green on the momentum board, the "oomph" that traditionally accompanies meaningful rallies has been absent.
The State of the "Trade"
We also focus each week on the "early warning" board, which is designed to indicate when traders might start to "go the other way" -- for a trade.
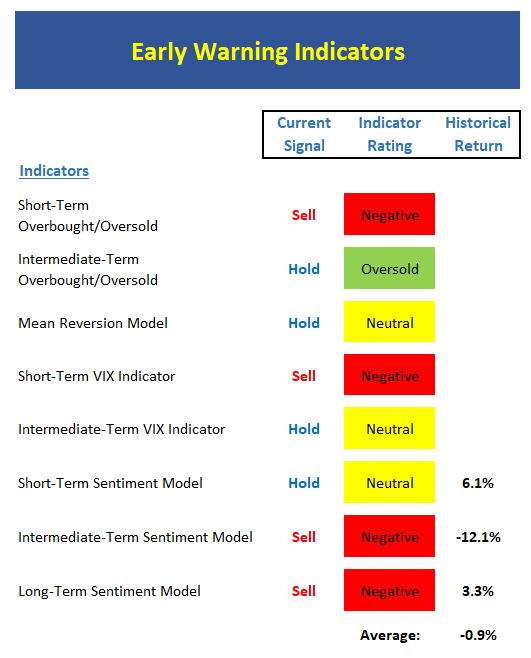
View Early Warning Indicator Board Online
Executive Summary:
- From a near-term perspective, stocks reached an overbought condition and reversed, which triggers a near-term sell signal.
- However, from an intermediate-term view, stocks remain modestly oversold. And since the best moves tend to occur when the overbought/sold indicators are aligned, some sloppy action is to be expected.
- The Mean Reversion Model closed out its 2/14 buy signal on Monday and is now dead neutral.
- The short-term VIX indicator produced sell signal on Monday 3/12.
- Our longer-term VIX Indicator got within a hair of the sell zone and then reversed - so the indicator is now neutral. Missed it by "that much."
- From a short-term perspective, market sentiment remains neutral but is quickly approaching the overly optimistic zone.
- The intermediate-term Sentiment Model remains in the red zone to start the week.
- The Long-Term Sentiment Model reading continues to move further into the negative zone.
- The Early Warning board suggests that the bears might have a slight edge at this time.
The State of the Macro Picture
Now let's move on to the market's "external factors" - the indicators designed to tell us the state of the big-picture market drivers including monetary conditions, the economy, inflation, and valuations.
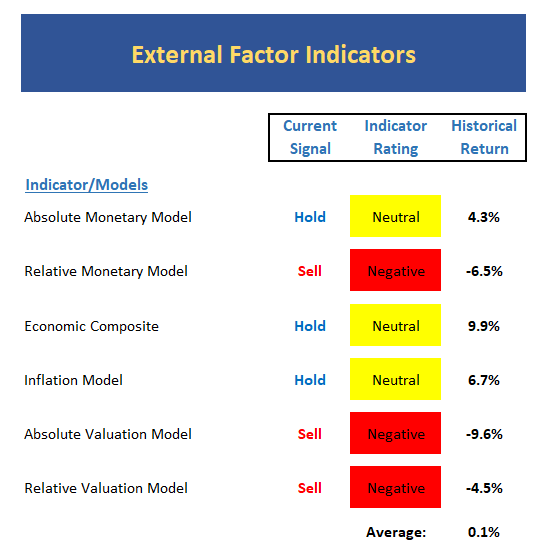
View External Factors Indicator Board Online
Executive Summary:
- The Absolute Monetary model continues to hover near the sell zone but has not yet produced a negative signal. I think this is a very good summary of the overall rate environment. I.E. Bonds appear to be on the cusp of a bear market, but as of yet, the big, bad bear has yet to begin.
- The Relative Monetary Model remains negative and on a sell signal.
- The Economic Model continues to suggest a strong economic environment. However, the economic model designed to call the stock market slipped to neutral last week. As such, we are downgrading the outlook.
- *** New Signal *** I've been saying for some time that our inflation model has been projecting a low inflation environment. However, the model moved to neutral last week, which is more in line with the market narrative that inflation pressures are building. For me, this is an important development.
- The Absolute Valuation model remains steadfastly negative.
- Our Relative Valuation Model is also negative.
- A quick glance at the External Factors board doesn't exactly give one the warm fuzzies at the present time and the historical return is only fractionally positive. This is a warning flag.
Sample Tactical Allocation Model
Below is an EXAMPLE (and ONLY an EXAMPLE) of how one might incorporate the indicator boards. The approach shown below is designed to provide the current equity allocation for a balanced tactical asset allocation model with a base target of 60/40 stocks/bonds.
The overall intent of the model is to keep equity exposure in line with current conditions.
Beginning February 2018, the model will be updated monthly.
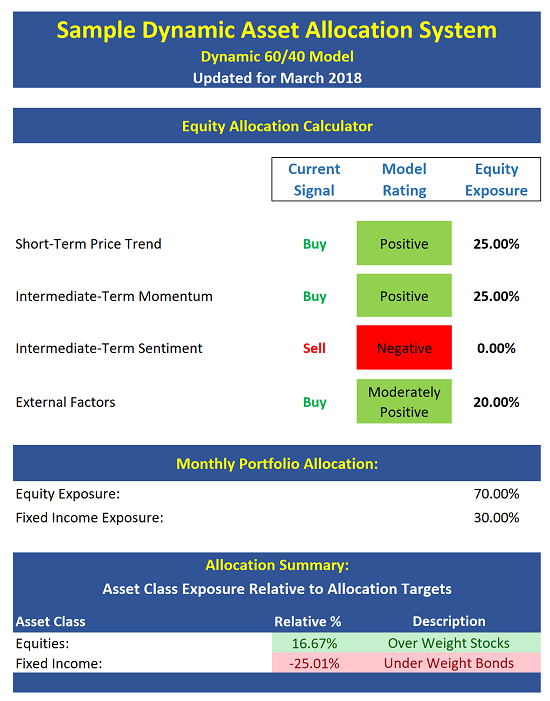
The model above is for illustrative and informational purposes only and does not in any way represent any investment recommendation. The model is merely a sample of how indicators can be grouped to create a guide to market exposure based on the inputs from multiple indicators/models.
Indicators Explained
Short-Term Trend-and-Breadth Signal Explained: History shows the most reliable market moves tend to occur when the breadth indices are in gear with the major market averages. When the breadth measures diverge, investors should take note that a trend reversal may be at hand. This indicator incorporates NDR's All-Cap Dollar Weighted Equity Series and A/D Line. From 1998, when the A/D line is above its 5-day smoothing and the All-Cap Equal Weighted Equity Series is above its 25-day smoothing, the equity index has gained at a rate of +32.5% per year. When one of the indicators is above its smoothing, the equity index has gained at a rate of +13.3% per year. And when both are below, the equity index has lost +23.6% per year.
Channel Breakout System Explained: The short-term and intermediate-term Channel Breakout Systems are modified versions of the Donchian Channel indicator. According to Wikipedia, "The Donchian channel is an indicator used in market trading developed by Richard Donchian. It is formed by taking the highest high and the lowest low of the last n periods. The area between the high and the low is the channel for the period chosen."
Intermediate-Term Trend-and-Breadth Signal Explained: This indicator incorporates NDR's All-Cap Dollar Weighted Equity Series and A/D Line. From 1998, when the A/D line is above its 45-day smoothing and the All-Cap Equal Weighted Equity Series is above its 45-day smoothing, the equity index has gained at a rate of +17.6% per year. When one of the indicators is above its smoothing, the equity index has gained at a rate of +6.5% per year. And when both are below, the equity index has lost -1.3% per year.
Industry Health Model Explained: Designed to provide a reading on the technical health of the overall market, Big Mo Tape takes the technical temperature of more than 100 industry sectors each week. Looking back to early 1980, when the model is rated as "positive," the S&P has averaged returns in excess of 23% per year. When the model carries a "neutral" reading, the S&P has returned over 11% per year. But when the model is rated "negative," stocks fall by more than -13% a year on average.
Cycle Composite Projections: The cycle composite combines the 1-year Seasonal, 4-year Presidential, and 10-year Decennial cycles. The indicator reading shown uses the cycle projection for the upcoming week.
Trading Mode Indicator: This indicator attempts to identify whether the current trading environment is "trending" or "mean reverting." The indicator takes the composite reading of the Efficiency Ratio, the Average Correlation Coefficient, and Trend Strength models.
Volume Relationship Models: These models review the relationship between "supply" and "demand" volume over the short- and intermediate-term time frames.
Price Thrust Model Explained: This indicator measures the 3-day rate of change of the Value Line Composite relative to the standard deviation of the 30-day average. When the Value Line's 3-day rate of change have moved above 0.5 standard deviation of the 30-day average ROC, a "thrust" occurs and since 2000, the Value Line Composite has gained ground at a rate of +20.6% per year. When the indicator is below 0.5 standard deviation of the 30-day, the Value Line has lost ground at a rate of -10.0% per year. And when neutral, the Value Line has gained at a rate of +5.9% per year.
Volume Thrust Model Explained: This indicator uses NASDAQ volume data to indicate bullish and bearish conditions for the NASDAQ Composite Index. The indicator plots the ratio of the 10-day total of NASDAQ daily advancing volume (i.e., the total volume traded in stocks which rose in price each day) to the 10-day total of daily declining volume (volume traded in stocks which fell each day). This ratio indicates when advancing stocks are attracting the majority of the volume (readings above 1.0) and when declining stocks are seeing the heaviest trading (readings below 1.0). This indicator thus supports the case that a rising market supported by heavier volume in the advancing issues tends to be the most bullish condition, while a declining market with downside volume dominating confirms bearish conditions. When in a positive mode, the NASDAQ Composite has gained at a rate of +38.3% per year, When neutral, the NASDAQ has gained at a rate of +13.3% per year. And when negative, the NASDAQ has lost at a rate of -8.5% per year.
Breadth Thrust Model Explained: This indicator uses the number of NASDAQ-listed stocks advancing and declining to indicate bullish or bearish breadth conditions for the NASDAQ Composite. The indicator plots the ratio of the 10-day total of the number of stocks rising on the NASDAQ each day to the 10-day total of the number of stocks declining each day. Using 10-day totals smooths the random daily fluctuations and gives indications on an intermediate-term basis. As expected, the NASDAQ Composite performs much better when the 10-day A/D ratio is high (strong breadth) and worse when the indicator is in its lower mode (weak breadth). The most bullish conditions for the NASDAQ when the 10-day A/D indicator is not only high, but has recently posted an extreme high reading and thus indicated a thrust of upside momentum. Bearish conditions are confirmed when the indicator is low and has recently signaled a downside breadth thrust. In positive mode, the NASDAQ has gained at a rate of +22.1% per year since 1981. In a neutral mode, the NASDAQ has gained at a rate of +14.5% per year. And when in a negative mode, the NASDAQ has lost at a rate of -6.4% per year.
Short-Term Overbought/sold Indicator: This indicator is the current reading of the 14,1,3 stochastic oscillator. When the oscillator is above 80 and the %K is above the %D, the indicator gives an overbought reading. Conversely, when the oscillator is below 20 and %K is below its %D, the indicator is oversold.
Intermediate-Term Overbought/sold Indicator: This indicator is a 40-day RSI reading. When above 57.5, the indicator is considered overbought and when below 45 it is oversold.
Mean Reversion Model: This is a diffusion model consisting of five indicators that can produce buy and sell signals based on overbought/sold conditions.
VIX Indicator: This indicator looks at the current reading of the VIX relative to standard deviation bands. When the indicator reaches an extreme reading in either direction, it is an indication that a market trend could reverse in the near-term.
Short-Term Sentiment Indicator: This is a model-of-models composed of 18 independent sentiment indicators designed to indicate when market sentiment has reached an extreme from a short-term perspective. Historical analysis indicates that the stock market's best gains come after an environment has become extremely negative from a sentiment standpoint. Conversely, when sentiment becomes extremely positive, market returns have been subpar.
Intermediate-Term Sentiment Indicator: This is a model-of-models composed of 7 independent sentiment indicators designed to indicate when market sentiment has reached an extreme from an intermediate-term perspective. Historical analysis indicates that the stock market's best gains come after an environment has become extremely negative from a sentiment standpoint. Conversely, when sentiment becomes extremely positive, market returns have been subpar.
Long-Term Sentiment Indicator: This is a model-of-models composed of 6 independent sentiment indicators designed to indicate when market sentiment has reached an extreme from a long-term perspective. Historical analysis indicates that the stock market's best gains come after an environment has become extremely negative from a sentiment standpoint. Conversely, when sentiment becomes extremely positive, market returns have been subpar.
Absolute Monetary Model Explained: The popular cliché, "Don't fight the Fed" is really a testament to the profound impact that interest rates and Fed policy have on the market. It is a proven fact that monetary conditions are one of the most powerful influences on the direction of stock prices. The Absolute Monetary Model looks at the current level of interest rates relative to historical levels and Fed policy.
Relative Monetary Model Explained: The "relative" monetary model looks at monetary indicators relative to recent levels as well as rates of change and Fed Policy.
Economic Model Explained: During the middle of bull and bear markets, understanding the overall health of the economy and how it impacts the stock market is one of the few truly logical aspects of the stock market. When our Economic model sports a "positive" reading, history (beginning in 1965) shows that stocks enjoy returns in excess of 21% per year. Yet, when the model's reading falls into the "negative" zone, the S&P has lost nearly -25% per year. However, it is vital to understand that there are times when good economic news is actually bad for stocks and vice versa. Thus, the Economic model can help investors stay in tune with where we are in the overall economic cycle.
Inflation Model Explained: They say that "the tape tells all." However, one of the best "big picture" indicators of what the market is expected to do next is inflation. Simply put, since 1962, when the model indicates that inflationary pressures are strong, stocks have lost ground. Yet, when inflationary pressures are low, the S&P 500 has gained ground at a rate in excess of 13%. The bottom line is inflation is one of the primary drivers of stock market returns.
Valuation Model Explained: If you want to get analysts really riled up, you need only to begin a discussion of market valuation. While the question of whether stocks are overvalued or undervalued appears to be a simple one, the subject is extremely complex. To simplify the subject dramatically, investors must first determine if they should focus on relative valuation (which include the current level of interest rates) or absolute valuation measures (the more traditional readings of Price/Earnings, Price/Dividend, and Price/Book Value). We believe that it is important to recognize that environments change. And as such, the market's focus and corresponding view of valuations are likely to change as well. Thus, we depend on our Valuation Models to help us keep our eye on the ball.
Disclosures
The opinions and forecasts expressed herein are those of Mr. David Moenning and may not actually come to pass. Mr. Moenning's opinions and viewpoints regarding the future of the markets should not be construed as recommendations. The analysis and information in this report is for informational purposes only. No part of the material presented in this report is intended as an investment recommendation or investment advice. Neither the information nor any opinion expressed constitutes a solicitation to purchase or sell securities or any investment program.
Any investment decisions must in all cases be made by the reader or by his or her investment adviser. Do NOT ever purchase any security without doing sufficient research. There is no guarantee that the investment objectives outlined will actually come to pass. All opinions expressed herein are subject to change without notice. Neither the editor, employees, nor any of their affiliates shall have any liability for any loss sustained by anyone who has relied on the information provided.
Mr. Moenning may at times have positions in the securities referred to and may make purchases or sales of these securities while publications are in circulation. Positions may change at any time.
The analysis provided is based on both technical and fundamental research and is provided "as is" without warranty of any kind, either expressed or implied. Although the information contained is derived from sources which are believed to be reliable, they cannot be guaranteed.
Investments in equities carry an inherent element of risk including the potential for significant loss of principal. Past performance is not an indication of future results.