Early Warning Wednesday for 7.15.20: It's Complicated
Good Morning. Since it's Wednesday, it's time to review our Early Warning indicator boards.
The Process: Once we have identified the state of the big-picture environment, the current trend, and the degree of momentum behind the move, we then look at the potential for a countertrend move to develop. This batch of indicators is designed to suggest when the "table is set" for the trend to "go the other way."
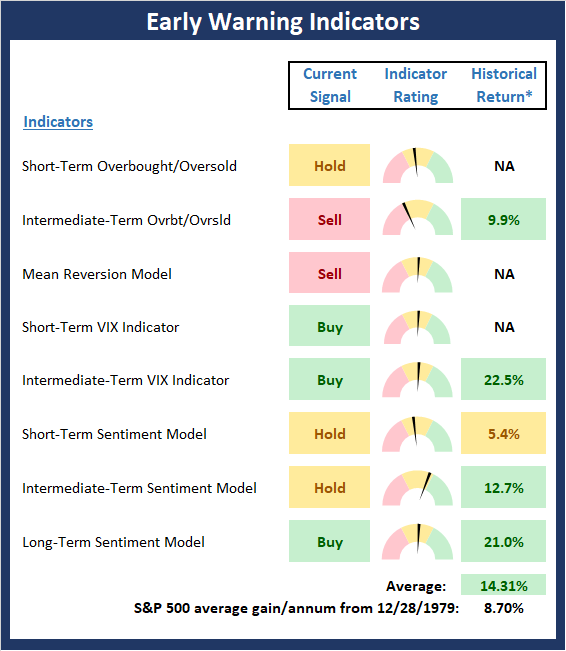
* Source: Ned Davis Research (NDR) as of the date of publication. Historical returns are hypothetical average annual performances calculated by NDR. Past performances do not guarantee future results or profitability - NOT INDIVIDUAL INVESTMENT ADVICE.
View Early Warning Indicator Board Online
My Take...
The Early Warning board continues to be a mixed bag as neither team appears to hold an edge at the present time. This probably sounds a little odd given that a great many analysts consider the current market to be very overbought. However, the current situation is complicated. From my seat is important to recognize that we are dealing with a bifurcated market, in which the major indices (save the NASDAQ) have been stuck in a trading range while the NASDAQ Composite and NASDAQ 100 indices have been on an impressive roll and are indeed overbought - and due for a rest. So, while the table may be set for a pause in the NDX, the bulls would appear to have some room to run in the S&P 500, and especially in the indices that require an economic recovery to work such as the DJIA, Russell 2000, Midcaps, etc.
Stochastic Review
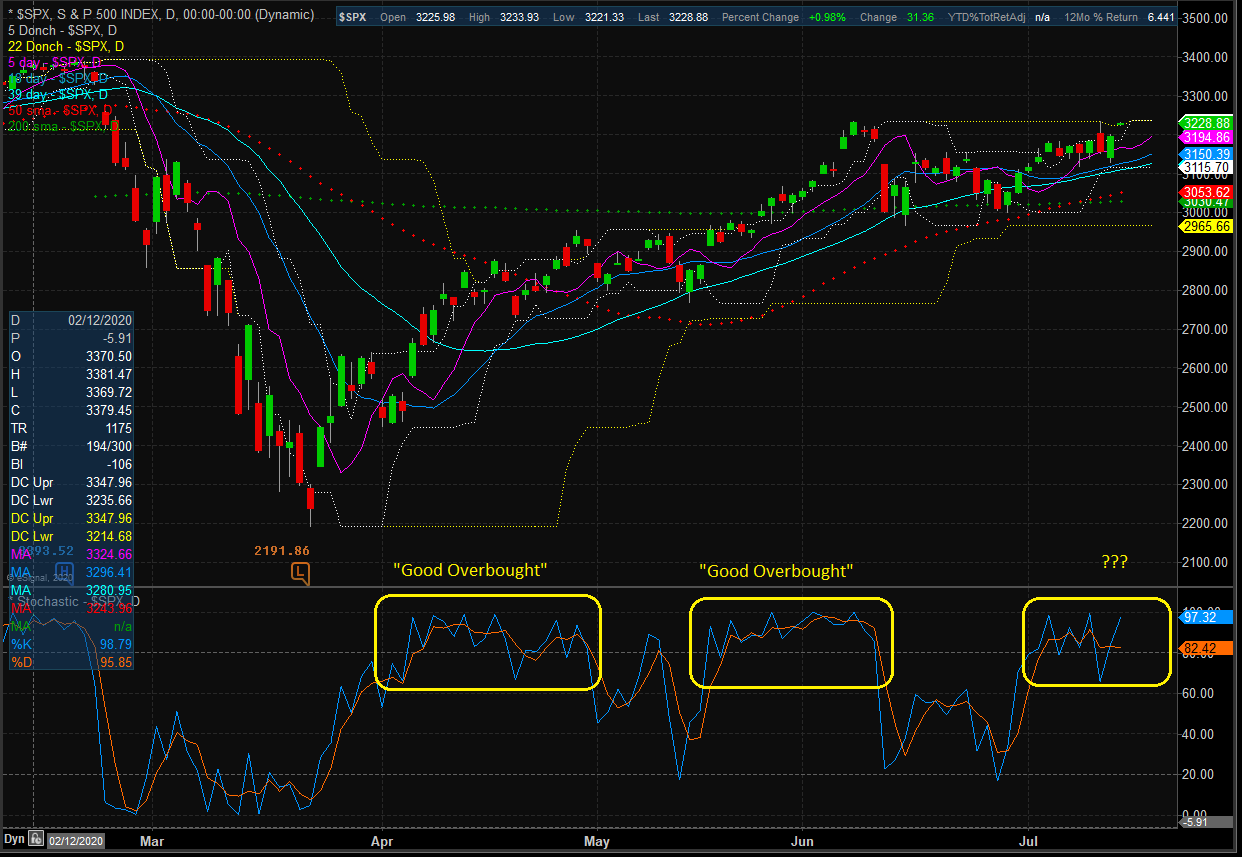
Over the years, I have found that reviewing the basic stochastics is perhaps the simplest way to determine when an index or security may be ripe to "go the other way" for a while. I like to keep it simple here by using a 14 day %K (with 1 day smoothing) and a 3 day %D. It's not fancy, but it tends to be an effective tool that I rely on.
S&P 500 - Daily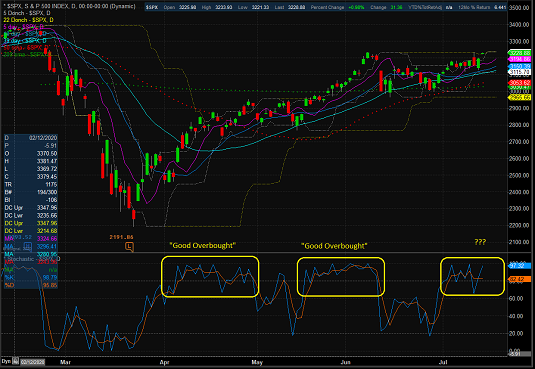
View Larger Chart
In the chart above, it is clear that the stochastics remain in overbought territory. However, it appears that a "good overbought" condition is developing. As opposed to a traditional overbought condition, which tends to lead to countertrend moves, a "good overbought" condition is where a market "gets overbought and stays overbought." The bottom line is I see this as a "rally continuation" sign which tends to have bullish tendencies. So, unless the bears can get something going quickly, my take is that we now have a "good overbought" condition on our hands.
Thought For The Day:
"Never ascribe to malice, that which can be explained by incompetence." --Napoleon
Wishing you green screens and all the best for a great day,

David D. Moenning
Founder, Chief Investment Officer
Heritage Capital Research

Disclosures
At the time of publication, Mr. Moenning held long positions in the following securities mentioned: None - Note that positions may change at any time.
Early Warning Models Explained
Short-Term Overbought/sold Indicator: This indicator is the current reading of the 14,1,3 stochastic oscillator. When the oscillator is above 80 and the %K is above the %D, the indicator gives an overbought reading. Conversely, when the oscillator is below 20 and %K is below its %D, the indicator is oversold.
Intermediate-Term Overbought/sold Indicator: This indicator is a 40-day RSI reading. When above 57.5, the indicator is considered overbought and wnen below 45 it is oversold.
Mean Reversion Model: This is a diffusion model consisting of five indicators that can produce buy and sell signals based on overbought/sold conditions.
VIX Indicator: This indicators looks at the current reading of the VIX relative to a series of Donchian Channel bands. When the indicator reaches an extreme reading in either direction, it is an indication that a market trend could reverse in the near-term.
Short-Term Sentiment Indicator: This is a model-of-models composed of 18 independent sentiment indicators designed to indicate when market sentiment has reached an extreme from a short-term perspective. Historical analysis indicates that the stock market's best gains come after an environment has become extremely negative from a sentiment standpoint. Conversely, when sentiment becomes extremely positive, market returns have been subpar.
Intermediate-Term Sentiment Indicator: This is a model-of-models composed of 7 independent sentiment indicators designed to indicate when market sentiment has reached an extreme from a intermediate-term perspective. Historical analysis indicates that the stock market's best gains come after an environment has become extremely negative from a sentiment standpoint. Conversely, when sentiment becomes extremely positive, market returns have been subpar.
Long-Term Sentiment Indicator: This is a model-of-models composed of 6 independent sentiment indicators designed to indicate when market sentiment has reached an extreme from a long-term perspective. Historical analysis indicates that the stock market's best gains come after an environment has become extremely negative from a sentiment standpoint. Conversely, when sentiment becomes extremely positive, market returns have been subpar.
NOT INVESTMENT ADVICE. The opinions and forecasts expressed herein are those of Mr. David Moenning and Heritage Capital Research and may not actually come to pass. The opinions and viewpoints regarding the future of the markets should not be construed as recommendations. The analysis and information in this report is for informational purposes only. No part of the material presented in this report is intended as an investment recommendation or investment advice. Neither the information nor any opinion expressed constitutes a solicitation to purchase or sell securities or any investment program.
Any investment decisions must in all cases be made by the reader or by his or her investment adviser. Do NOT ever purchase any security without doing sufficient research. There is no guarantee that the investment objectives outlined will actually come to pass. All opinions expressed herein are subject to change without notice. Neither the editor, employees, nor any of their affiliates shall have any liability for any loss sustained by anyone who has relied on the information provided.
Mr. Moenning of Heritage Capital Research is an investment adviser representative of Eastsound Capital Advisors, LLC, a registered investment advisor. The adviser may not transact business in states where it is not appropriately registered, excluded or exempted from registration. Individualized responses to persons that involve either the effecting of transaction in securities, or the rendering of personalized investment advice for compensation, will not be made without registration or exemption.
Mr. Moenning and Heritage Capital Research may at times have positions in the securities referred to and may make purchases or sales of these securities while publications are in circulation. Positions may change at any time.
The analysis provided is based on both technical and fundamental research and is provided "as is" without warranty of any kind, either expressed or implied. Although the information contained is derived from sources which are believed to be reliable, they cannot be guaranteed.
The author neither endorses nor warrants the content of this site, any embedded advertisement, or any linked resource. The author or his managed funds may hold either long or short positions in the referenced securities. Republication rights must be expressly granted by author in writing.
Investments in equities carry an inherent element of risk including the potential for significant loss of principal. Past performance is not an indication of future results.