The Most Interesting (Chart) In The World
As I may have mentioned a time or three, I don't usually write on Friday mornings. After penning an almost daily missive on the state of the market since the late 1990's, I figure I can a day off every now and again.
However, in running through my charts, I was struck by the current state of the S&P 500. No, make that awestruck!
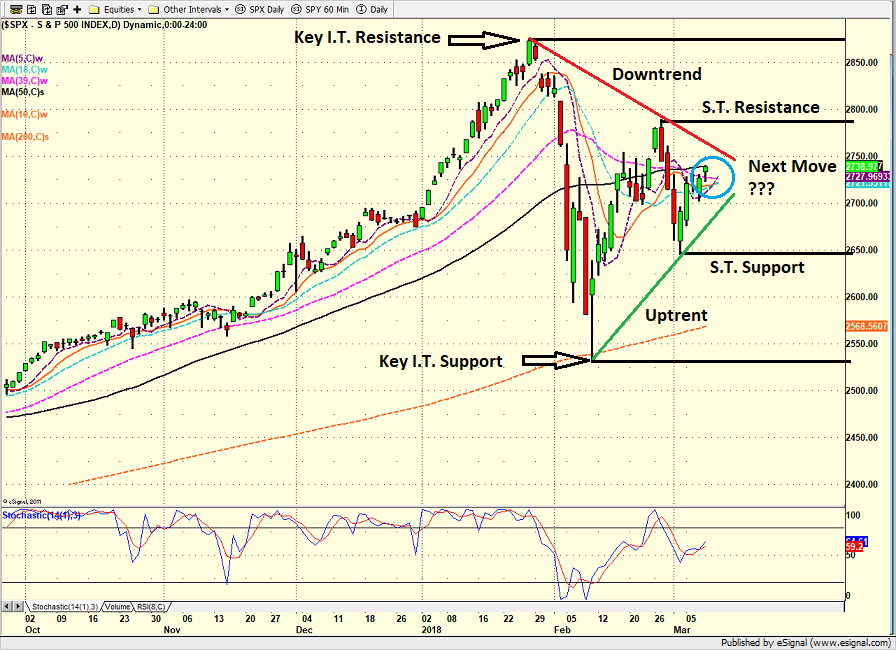
In short, the daily candlestick chart of the S&P 500 is one for the ages right now. The symmetry is simply amazing. The trends are clear. The support/resistance zones for both the short- and intermediate-term time frames are, well, perfection. And the confluence of moving averages - all in the same place, at the same time - accompanied by yesterday's close right in the thick of it all makes the chart picture, well, the epitome of an equilibrium point.
Frankly, I'm not a professional chartist nor a CMT. But I came up in the business drawing lines on charts with a pencil and a ruler. And in 1983, we calculated moving averages with a legal pad and a calculator. And I NEVER, EVER make a move without consulting a chart. The bottom line is I'm kinda old school and I like my technical analysis to be simple and straightforward.
However, the reason I'm tap, tap, tapping on the keyboard this morning is I'm not sure I've ever seen a technical picture that is so perfectly clear. This is the type of chart that technical analysis textbooks should use as illustrations.
S&P 500- Daily 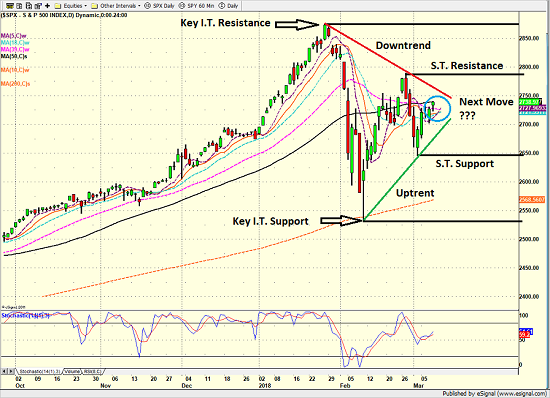
View Larger Image Online
You've got key intermediate-term (labeled as "I.T." on the chart) support and resistance zones. You've got clear-cut short-term support/resistance zones. You've got a very nice downtrend line going, as well as a corresponding uptrend line. You've got the weighted 5-, 10-, 18-, 39-, and 50-day moving averages (which I like to slide forward a few days) all hovering around the same tight little area. And then the coup de grace is that the S&P closed yesterday right AT the 50-day. Can you say stuck in the middle with you?!?
Price Action vs. News Cycle
My view of technical analysis is price represents the manifestation of crowd psychology in motion and all the rest of it merely is a way of keeping score between the bulls and the bears.
In this case, what we've got is traders duking it out over what the outcome of the trade war/negotiations is going to be. Will he, or won't he? Will it affect the global economy or not? Will politics spoil the good economic mojo happening right now? Etc.
Here's my take. The chart seems to be telling us that the game is a total draw at this point.
So, if you are like me and aren't smart enough to figure out the answers to the questions posed above, you can always just use the action on the chart as your guide. For example, if the S&P breaks down below the uptrend line and/or the short-term support zone, the bears are winning. And if the key I.T. support zone gives way - and holds - the bears will be in control of the game.
And vice versa on the upside.
Finally, my apologies to the professional technicians that may be (or more accurately, may have been) reading. This was not meant to be a comprehensive review of the technical picture but rather a rudimentary use of the craft.
However, for me anyway, the picture REALLY tells the story right now.
Publishing Note: I am traveling next week and will publish reports as my schedule permits.
Thought For The Day:
"How to make God laugh - Tell him your future plans." -Woody Allen
Wishing you green screens and all the best for a great day,

David D. Moenning
Founder, Chief Investment Officer
Heritage Capital Research
HCR Focuses on a Risk-Managed Approach to Investing
Must Read: What Risk Management Can and Cannot Do
HCR's Financial Advisor Services
HCR's Individual Investor Services
Questions, comments, or ideas? Contact Us
At the time of publication, Mr. Moenning held long positions in the following securities mentioned: none - Note that positions may change at any time.
Disclosures
The opinions and forecasts expressed herein are those of Mr. David Moenning and may not actually come to pass. Mr. Moenning's opinions and viewpoints regarding the future of the markets should not be construed as recommendations. The analysis and information in this report is for informational purposes only. No part of the material presented in this report is intended as an investment recommendation or investment advice. Neither the information nor any opinion expressed constitutes a solicitation to purchase or sell securities or any investment program.
Any investment decisions must in all cases be made by the reader or by his or her investment adviser. Do NOT ever purchase any security without doing sufficient research. There is no guarantee that the investment objectives outlined will actually come to pass. All opinions expressed herein are subject to change without notice. Neither the editor, employees, nor any of their affiliates shall have any liability for any loss sustained by anyone who has relied on the information provided.
Mr. Moenning may at times have positions in the securities referred to and may make purchases or sales of these securities while publications are in circulation. Positions may change at any time.
The analysis provided is based on both technical and fundamental research and is provided "as is" without warranty of any kind, either expressed or implied. Although the information contained is derived from sources which are believed to be reliable, they cannot be guaranteed.
Investments in equities carry an inherent element of risk including the potential for significant loss of principal. Past performance is not an indication of future results.