The Recent Action Is Encouraging
Don't look now fans, but the S&P 500 has closed higher in five of the last seven sessions and appears to be in the early stages of an uptrend. Of course, our furry friends in the bear camp disagree, pointing to the downtrend line that has been visible on the chart of the S&P since the last all-time high was set on January 26.
The bulls counter with the fact that yesterday's price action moved the needle in their favor as all three major stock market indices closed above their respective 50-day moving averages. Personally, I don't put much stock in simple moving averages (I prefer a weighted average that is moved forward a few days as an indicator of trend). However, the press - and a great many traders - seem to follow the biggies such as the 50-, 100-, 150, and 200-day simple moving averages.
The good news is the S&P 500, Dow Jones Industrial Average, S&P Midcap 400, S&P Smallcap, and the NASDAQ Composite all closed above their respective 50-day moving averages yesterday. And with the exception of the DJIA, all the major indices start today above the big moving averages (the Dow still has some work to do to recover its 100-day).
S&P 500 - Daily 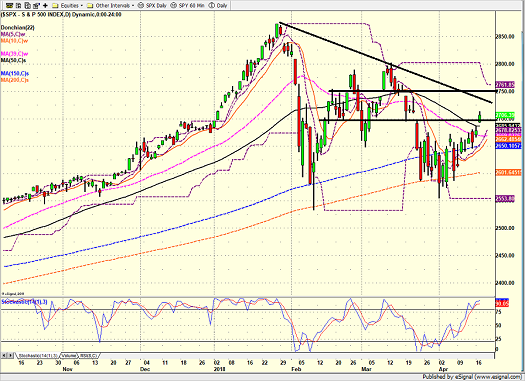
View Larger Image Online
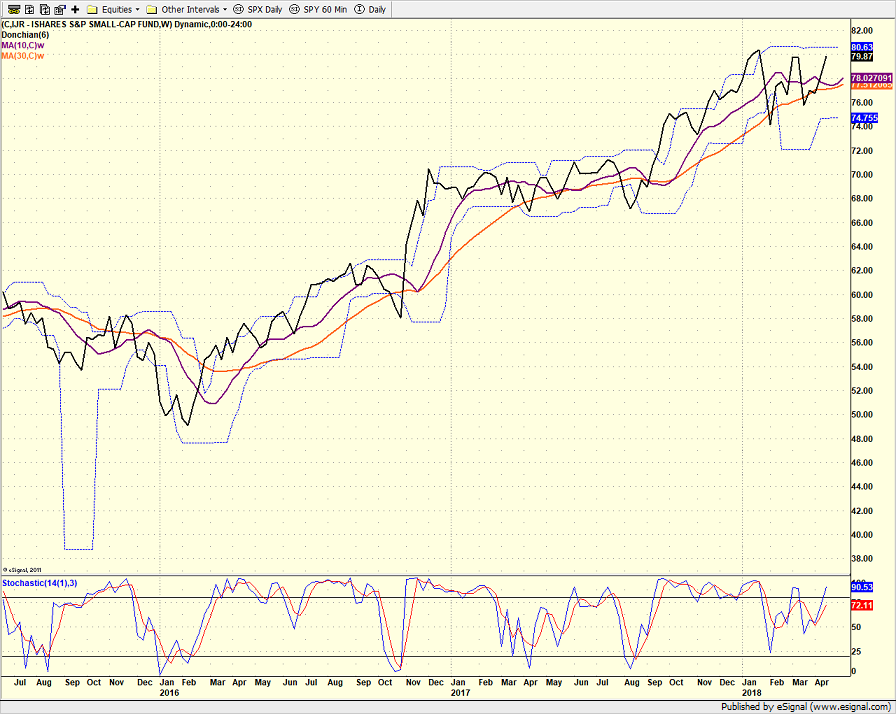
It is also encouraging to note that the S&P Smallcap Index - which would not be impacted as greatly by a trade war - is back to within a stone's throw of its all-time high and is the current market leader.
iShares S&P Small-Cap ETF - Weekly 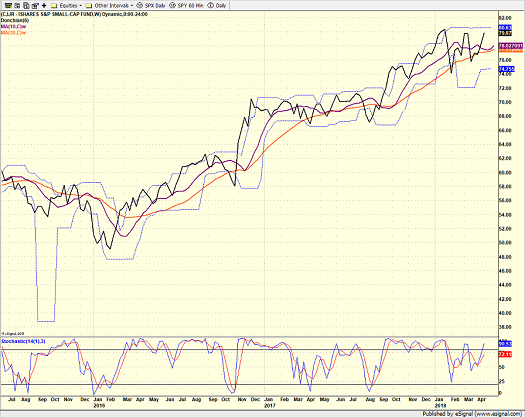
View Larger Image Online
Thus, our heroes in horns argue that the technical picture of the stock market is much improved over where things stood even a week ago.
But (you knew that was coming, right?), the bears push back with the idea that the jury is still out on whether or not the current move is sustainable. They point to the overhead resistance on the chart (the two horizontal black lines I've drawn on the chart of the S&P) and the downtrend on the S&P (regardless of the fact that there is no such corresponding downtrend on the charts of any of the other major stock market indices) as reasons to suggest that the corrective phase may not yet have ended.
Oh, and then there is history.
Those seeing the glass as at least half empty also cling tightly to the chart below. A study done by Ned Davis Research Group shows the average price action of (a) corrections in the S&P 500 (the green line), (b) the start of new bear markets (the red dashed line), and (c) the current price action since the correction began (which I have modified slightly to update the price action since NDR tweeted out this chart).
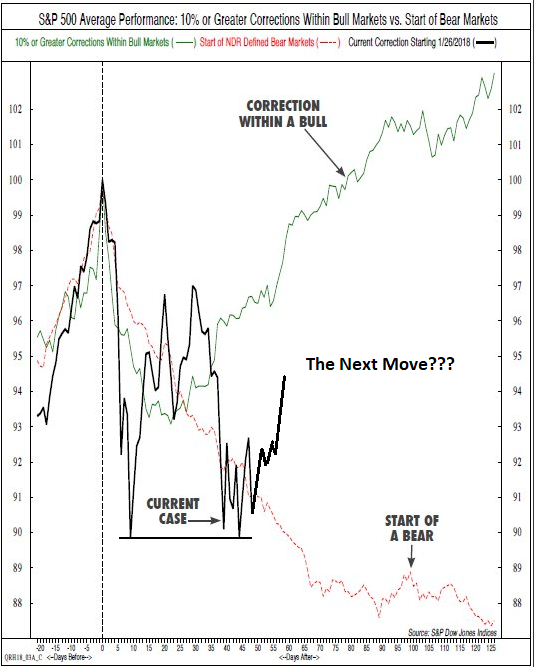
View Image Online Source: Ned Davis Research Group
The dilemma here is quite obvious. Two weeks ago, it appeared that the S&P 500 was traveling along the "Start of a Bear" path, which didn't bode well. However, since the recent test and retest of the S&P's important moving averages, the picture has changed. And the bottom line is that if we are using history as our guide, the next move will likely be very important.
Of course, the positive action in the small caps and the readings of our major market models would seem to tip the scales in favor of the bulls right now. And then there is the possibility that what we're seeing now is the makings of a new trading range.
But in any event, the recent action is encouraging. Well, until the next headline, rumor, or tweet-storm hits, that is.
Thought For The Day:
Think of FEAR as "F"alse "E"vidence "A"ppearing "Real" -Wayne Dyer
Wishing you green screens and all the best for a great day,

David D. Moenning
Founder, Chief Investment Officer
Heritage Capital Research
HCR Focuses on a Risk-Managed Approach to Investing
Must Read: What Risk Management Can and Cannot Do
HCR's Financial Advisor Services
HCR's Individual Investor Services
Questions, comments, or ideas? Contact Us
At the time of publication, Mr. Moenning held long positions in the following securities mentioned: none - Note that positions may change at any time.
Disclosures
The opinions and forecasts expressed herein are those of Mr. David Moenning and may not actually come to pass. Mr. Moenning's opinions and viewpoints regarding the future of the markets should not be construed as recommendations. The analysis and information in this report is for informational purposes only. No part of the material presented in this report is intended as an investment recommendation or investment advice. Neither the information nor any opinion expressed constitutes a solicitation to purchase or sell securities or any investment program.
Any investment decisions must in all cases be made by the reader or by his or her investment adviser. Do NOT ever purchase any security without doing sufficient research. There is no guarantee that the investment objectives outlined will actually come to pass. All opinions expressed herein are subject to change without notice. Neither the editor, employees, nor any of their affiliates shall have any liability for any loss sustained by anyone who has relied on the information provided.
Mr. Moenning may at times have positions in the securities referred to and may make purchases or sales of these securities while publications are in circulation. Positions may change at any time.
The analysis provided is based on both technical and fundamental research and is provided "as is" without warranty of any kind, either expressed or implied. Although the information contained is derived from sources which are believed to be reliable, they cannot be guaranteed.
Investments in equities carry an inherent element of risk including the potential for significant loss of principal. Past performance is not an indication of future results.