A Goldilocks Moment?
The State of the Market
Jamie Dimon attracted a lot of attention last week with his summary of the current economic/market environment. In his highly anticipated annual shareholder letter, the JPMorgan Chase (JPM) CEO wrote that we are looking at a "Goldilocks moment" and that "the U.S. economy will likely boom." Talk about cutting to the chase!
Dimon feels the current environment could lead to sustained economic growth accompanied by slow inflation and gradually rising interest rates. "We don't know what the future holds, and it is possible that we will have a Goldilocks moment — fast and sustained growth, inflation that moves up gently (but not too much) and interest rates that rise (but not too much)." Goldilocks indeed.
Expanding a bit, Dimon also wrote, "I have little doubt that with excess savings, new stimulus, huge deficit spending, more QE, a new potential infrastructure bill, a successful vaccine and euphoria around the end of the pandemic, the U.S. economy will likely boom," and that "this "boom could easily run into 2023."
I don't know about you, but this sounds pretty positive to me. And since Mr. Dimon was instrumental in turning things around in March 2008 by reminding us that banks in the U.S. were actually making money (the change to the mark-to-market accounting rules didn't hurt either), the bottom line is I have been listening intently to JPM's CEO ever since.
Then there is the recent batch of eye-opening economic stats from the Institute for Supply Management, which makes it hard not to be optimistic regarding the outlook for the economy. March's ISM Manufacturing Index came in at a 37-year high, which confirms that the manufacturing sector is en fuego. And the Non-Manufacturing index, which is a measure of the services sector of the economy (which, of course accounts for the vast majority of economic activity in the U.S.), was reported at the highest level - ever. As such, the ISM Composite Index also came in at the highest reading on record - besting the old mark by some 7.5%. Impressive.
Also on the economic front, we learned last week that Job Openings hit their highest level ever and that the IMF upgraded its growth forecast for 2021 to 6% from 5.5%.
Oh, and a guy named Powell, who is in charge of a bunch of central bankers here in the U.S., had some good stuff to say on "60 Minutes" last night. Powell told CBS's Scott Pelley, "We feel like we're at a place where the economy is about to start growing much more quickly."
Next, it is important to note that the quarterly earnings parade will start to roll next week. According to FactSet, EPS for S&P 500 companies are expected to grow by 24% year-over-year. And in case you don't follow such things, I can attest that Wall Street analysts have been very busy upping their earnings estimates for companies this year.
Finally, I find it interesting that even the worry over rising in interest rates seems to be fading. While just about everybody on the planet (including one Mr. Dimon) expects rates to rise this year, the current narrative is that rates are now rising "for the right reasons." In short, the consensus seems to be that rates are rising due to the anticipated improvement in the economy and increased supply, and NOT because inflation is expected to get "too hot."
So, with all of this good stuff hitting the wires recently, is it any wonder that the S&P 500 closed out the week at an all-time record high?
Yet at the same time, all of the above has me wondering if the porridge might actually be getting a little hot for Goldi's taste at the present time. After all, the news is all good here (save the worrisome increase in COVID cases in certain places, of course) and nearly everybody knows the bull case with the S&P 500 now up over 10% on the year when dividends are included.
Couple this with an overbought condition, sentiment readings that are starting to reach the upper bounds, and valuations that are nothing short of extreme, and well, the table looks like it might be getting set for the bears to come out of hibernation at some point. (Note the abundance of red on our Early Warning Indicator Board below.)
This is not to say that the bull market is about to end. No, from my perch, the backdrop for stocks continues to lean bullish (as evidenced by all the green in the Primary Cycle Indicator Board - see below). However, when everything starts to look a little too good, sloppy periods, pullbacks, pauses, and/or corrections tend to ensue.
While I readily admit that this market certainly seems to want to head higher - perhaps even substantially so - we should probably keep in mind that countertrend moves can happen at any time, and for any reason.
The point here is that while Goldilocks appears to be in the house, we shouldn't be surprised if things cool off for a bit in the near future. You know, just long enough for the porridge to become "just right" again.
Here's hoping you have a great week. Now let's turn to our weekly model update...
Publishing Note: I am traveling next Monday and will not publish a report.
The Big-Picture Market Models
We start with six of our favorite long-term market models. These models are designed to help determine the "state" of the overall market.
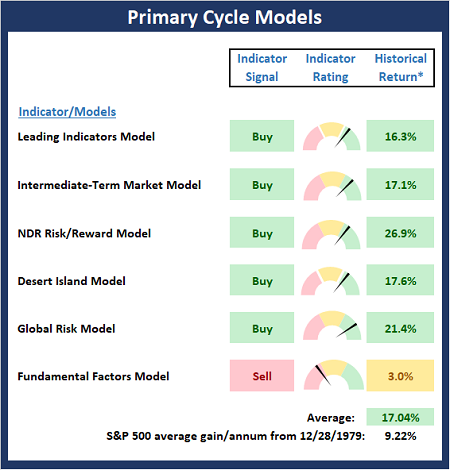
* Source: Ned Davis Research (NDR) as of the date of publication. Historical returns are hypothetical average annual performances calculated by NDR.
The Fundamental Backdrop
Next, we review the market's fundamental factors including interest rates, the economy, earnings, inflation, and valuations.
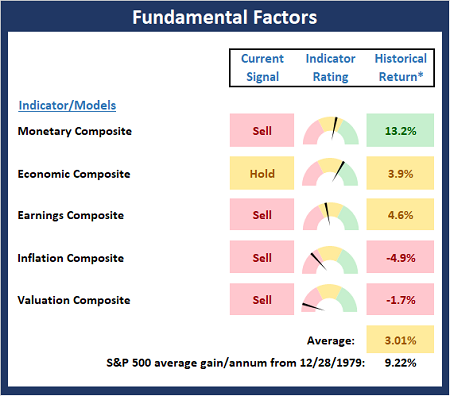
* Source: Ned Davis Research (NDR) as of the date of publication. Historical returns are hypothetical average annual performances calculated by NDR.
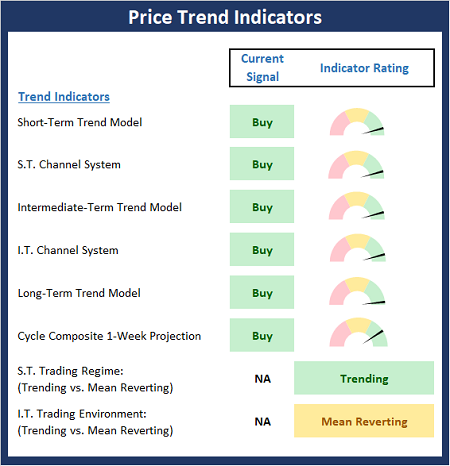
The State of the Trend
After reviewing the big-picture models and the fundamental backdrop, I like to look at the state of the current trend. This board of indicators is designed to tell us about the overall technical health of the market's trend.
The State of Internal Momentum
Next, we analyze the momentum indicators/models to determine if there is any "oomph" behind the current move.
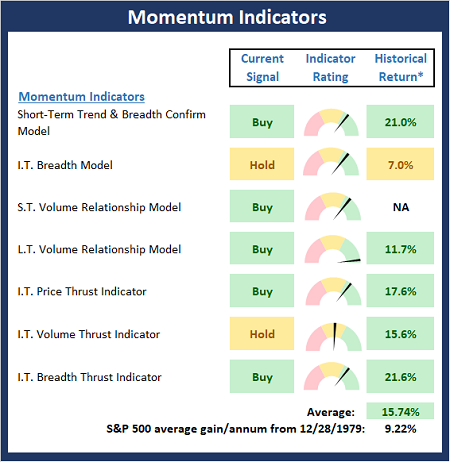
* Source: Ned Davis Research (NDR) as of the date of publication. Historical returns are hypothetical average annual performances calculated by NDR.
Early Warning Signals
Finally, we look at our early warning indicators to gauge the potential for counter-trend moves. This batch of indicators is designed to suggest when the table is set for the trend to "go the other way."
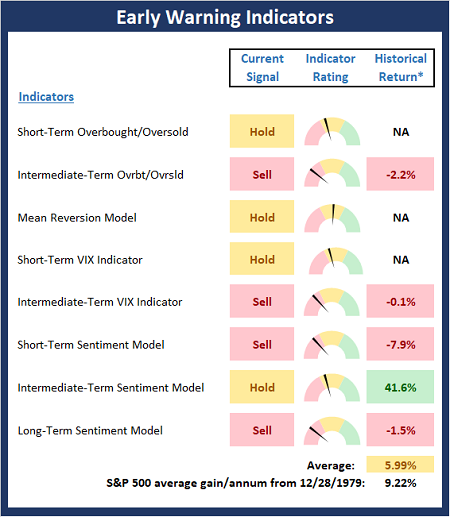
* Source: Ned Davis Research (NDR) as of the date of publication. Historical returns are hypothetical average annual performances calculated by NDR.
Thought for the Day:
There is no right way to do the wrong thing. -Waylon Jennings
Wishing you green screens and all the best for a great day,

David D. Moenning
Founder, Chief Investment Officer
Heritage Capital Research, a Registered Investment Advisor

Disclosures
At the time of publication, Mr. Moenning held long positions in the following securities mentioned: JPM - Note that positions may change at any time.
NOT INDIVIDUAL INVESTMENT ADVICE. IMPORTANT FURTHER DISCLOSURES