A Matter of Timing
With the exceptions of an ugly day/afternoon here and there, the tenor of the market appears to have improved so far in calendar year 2023. And with both the "Santa Claus/Year-End" and the "First Five Days" indicators positive, investors can't be blamed for looking on the bright side these days.
In reality though, you can probably dispose of all the historical analogs, analyst outlooks, and group-think predictions into the nearest round file as the next major trend - in either direction - is likely to be driven by the outlook/expectation for the state of the economy.
From my seat, this will likely wind up being a matter of timing. As in, will the economy hold up long enough for the Fed to recognize that inflationary pressures are falling so that they can "pivot" away from their antagonistic mode? Or will John and Jane Q Public decide to put their collective heads in the sand and stop spending in anticipation of the most predicted economic recession in history?
To be sure, monetary policy works with a significant lag, (the thinking is approximately 9-12 months). In short, this is why most every analyst on the street is calling for a recession in the second half of 2023. The Fed started tightening aggressively last spring and then hiked hard for the next 2 quarters, so naturally everybody assumes that the negative impacts on the economy will show up sometime in late summer/early fall. Makes sense.
However, so far at least, consumers aren't buying the doom-and-gloom inflationary/pain scenario the Fed is selling. Let's face it; with gasoline prices back at reasonable levels, home values up nicely, and plenty of cash on hand - thanks in no small part to the government pumping $10 trillion or so into peoples' checking accounts - the John Public family hasn't really changed any of their spending behavior.
Speaking generally, of course, Corporate America is in a similar position as it relates to their balance sheets. I'm not sure which particular stat is the most accurate, but it looks like there is a bunch of cash on hand here. And the bottom line is if companies have cash available it is much easier for them to weather any storms that may blow in (hurricanes, or otherwise).
And this, dear reader, is why I am struggling to buy the bear argument here. If this is a recession, I'll take it! Give me this type of recession every single time going forward, please!
This is not to say that investors should expect nothing blue skies ahead. No, there is still a fair amount of uncertainty out there on the economic/macro front.
And lest we forget, the Fed is on a mission. As I've opined for a couple decades now, it is important to recognize that the Fed tends to get what they want - especially when they are "on a mission."
This means we should NOT expect any "pivot" messaging from even the most dovish Fed officials. No, their message has been clear: "Hike fast and hard. Then hold rates high for a LONG time. Do not waver. Hold firm and stay the course - until inflation returns to target."
Remember, "messaging" is one of the Fed's 3 tools. And right now, this tool looks like a hammer. So, while our inflationary pressure indicators are falling hard and are currently in the "mile disinflation" zone, the Fed is unlikely to relent on their messaging.
Yes, they see the same data we do. And no, they aren't stupid. Nor are they being "stubborn" here. The gameplan for Powell & Co is simple. Don't waver. Keep up the hawkish narrative as long as possible in order to keep the inflation expectations genie trapped in the bottle. Right now, nobody is thinking, "gee, I should buy this now because it's just going to get more expensive later." And this is what the Fed wants.
It is also clear that the markets don't believe the Fed will keep their word here as the futures continue to project that the Fed Funds rate will start to fall in the back half of 2023 - regardless of what the FOMC officials are saying in public.
Getting back to the "timing" issue, I believe the key question is how soon inflation will begin to decline "enough" for the Fed to be reasonable and avoid wrecking the economy. Cutting to the chase, IF inflation pressures continue to fall, then the Fed is likely to back off and the economy could very well be just fine.
But... If something comes out of the woodwork to cause inflation to stay "sticky high," then there could be trouble and the economy could easily experience a "real" recession. Again, for me, it's a matter of timing.
My take is the timing situation looks favorable right now and that a soft(ish) landing is the base case here. So, from my perch, this means that stocks may, at some point, begin the process of looking ahead. We shall see.
Now let's review the "state of the market" through the lens of our market models...
Primary Cycle Models
Below is a group of big-picture market models, each of which is designed to identify the primary trend of the overall "state of the stock market."
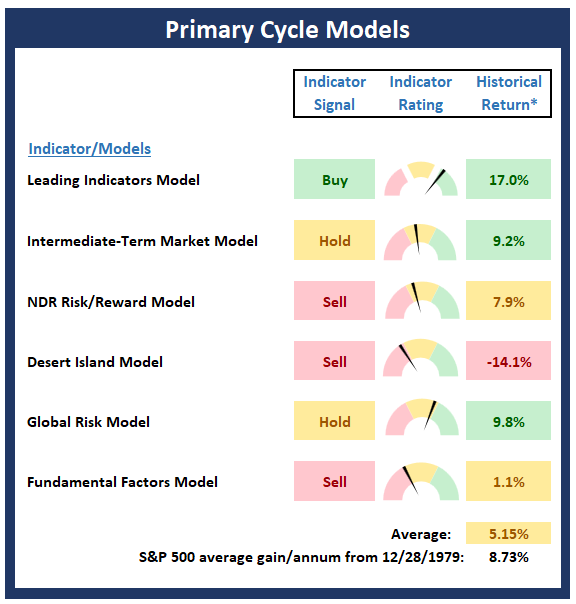
* Source: Ned Davis Research (NDR) as of the date of publication. Historical returns are hypothetical average annual performances calculated by NDR.
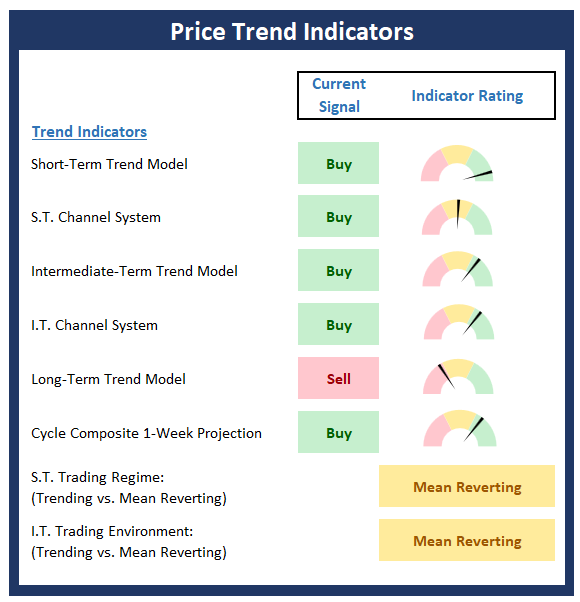
Trend Analysis:
Below are the ratings of key price trend indicators. This board of indicators is designed to tell us about the overall technical health of the market's trend.
Key Price Levels
- S&P 500 Near-Term Support Zone: 3890
- S&P 500 Near-Term Resistance Zone: 4015
- S&P 500 50-day Simple MA: 3928
- MA Direction: Rising
- S&P 500 200-day Simple MA: 3968
- MA Direction: Declining
Market Momentum Indicators
Below is a summary of key internal momentum indicators, which help determine if there is any "oomph" behind a move in the market.
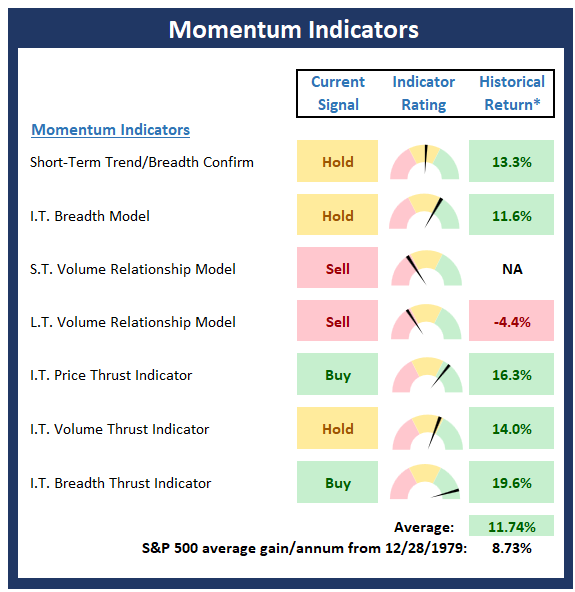
* Source: Ned Davis Research (NDR) as of the date of publication. Historical returns are hypothetical average annual performances calculated by NDR.
Early Warning Indicators
Below is a summary of key early warning indicators, which are designed to suggest when the market may be ripe for a reversal on a short-term basis.
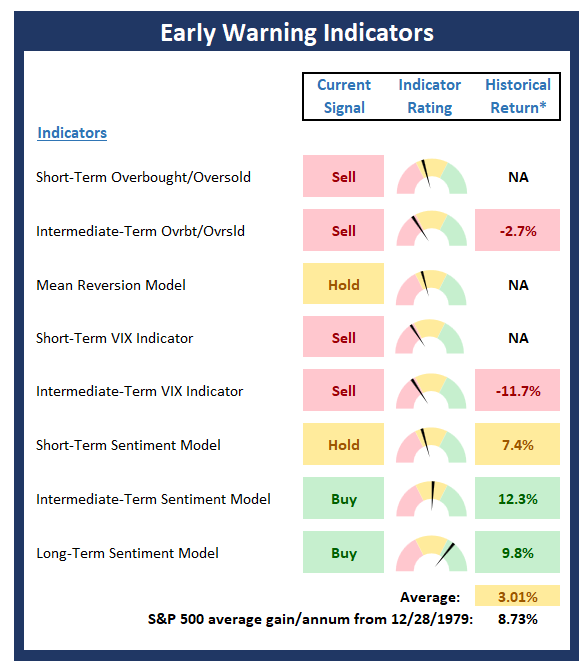
* Source: Ned Davis Research (NDR) as of the date of publication. Historical returns are hypothetical average annual performances calculated by NDR.
Fundamental Factor Indicators
Below is a summary of key external factors that have been known to drive stock prices on a long-term basis.
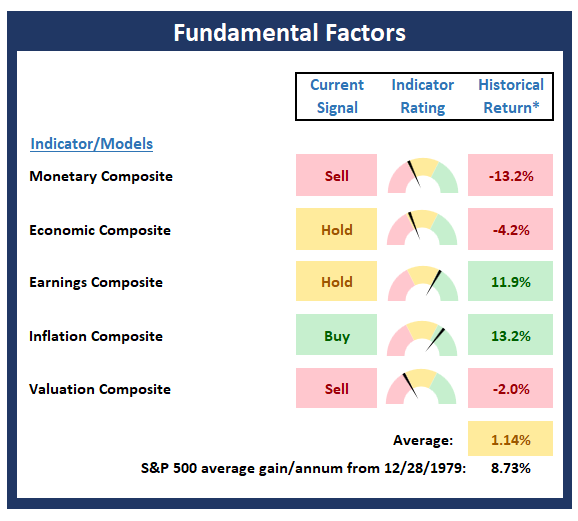
* Source: Ned Davis Research (NDR) as of the date of publication. Historical returns are hypothetical average annual performances calculated by NDR.
Thought for the Day:
The difference between the impossible and the possible lies in a man's determination. -Tommy Lasorda
Wishing you green screens and all the best for a great day,

David D. Moenning
Founder, Chief Investment Officer
Heritage Capital Research, a Registered Investment Advisor

Disclosures
At the time of publication, Mr. Moenning held long positions in the following securities mentioned: None - Note that positions may change at any time.
NOT INDIVIDUAL INVESTMENT ADVICE. IMPORTANT FURTHER DISCLOSURES