A New Bull Market?

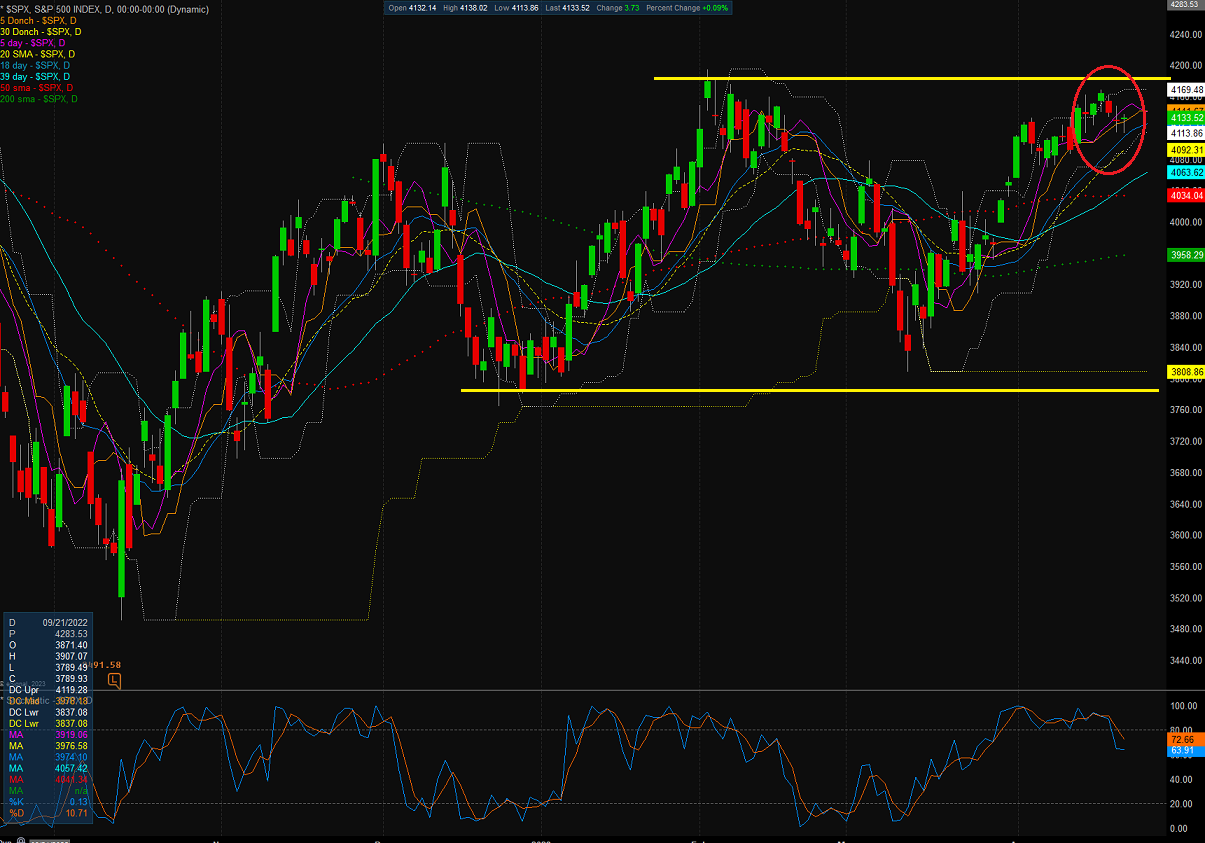
The stock market appears to have spent the vast majority of the last week or so doing, well, a lot of nothing. In short, after the S&P 500 moved to the high end of the recent trading range, which, as our heroes in horns tell us, is certainly an encouraging sign, traders decided to hit the pause button.
From a technical perspective, the key is that, so far at least, the venerable market index has been unable to "break on through to the other side", which, of course, would be a bullish development. And then on the flipside, those seeing the market's glass as half empty tell us that a failure to break out to the upside would almost certainly ensure a trip to the lower bounds of the range.
S&P 500 Daily
View Full Size Chart
Our furry friends in the bear camp contend that stocks are tracing out a "double top" formation and thus, the current rally is doomed to fail.
The Negative Nancy crowd contends that stocks have lost touch with reality. That the economy is slowing quickly. That a credit crunch is on the way. That a banking crisis is heating up. That valuations are sky high. That the good 'ol USofA is about to default on its debt. And that a nasty recession is sure to follow. Joy.
The bulls counter with the idea that a softish landing remains the base case scenario. Our heroes in horns point to the strong jobs market, the resilient, free spending consumer, and the still-strong housing market as reasons to justify their upbeat view on the economy. They also contend that inflation is clearly heading in the right direction. That the Fed is about to pause. That stress on banks is receding. That VIX levels are trending lower. And that earnings continue to be "just fine, thank you."
And this, dear readers, is the stuff that trading ranges are made of. As I opined last week, my take is the debate in the market continues unabated.
Waiting on the Big Boys
Although the only way to resolve the debate playing out in the market is with a heaping helping of hindsight, my take is that the recent rally in stocks suggests investors are looking beyond all the "known" worries and ahead to better days. But with a slew of very big-name companies such as GOOGL, MSFT, META, AMZN, V, BA, EBAY, MA, CMCSA, MRK, BMY, LLY, CAT, ABBV, HON, INTC, GILD, ATVI, CHTR, XOM, and CVX all reporting next week, my contention is that traders are taking a break here and waiting on the earnings.
My thinking is the "theme" from the big-name earnings report could very well drive the next meaningful, intermediate term move in the stock market. Be it up or down. If earnings remain decent (as in "not as bad as feared") then I could see stocks breaking out to the upside. And if we hear a bunch of worrisome words from these CEO's then, well, a trip back down within the range would make some sense.
But, from a big-picture standpoint, I believe the market action remains constructive and that, more importantly, some of my main indicators suggest that we may be seeing the beginnings of an important regime change.
A New Bull Market?
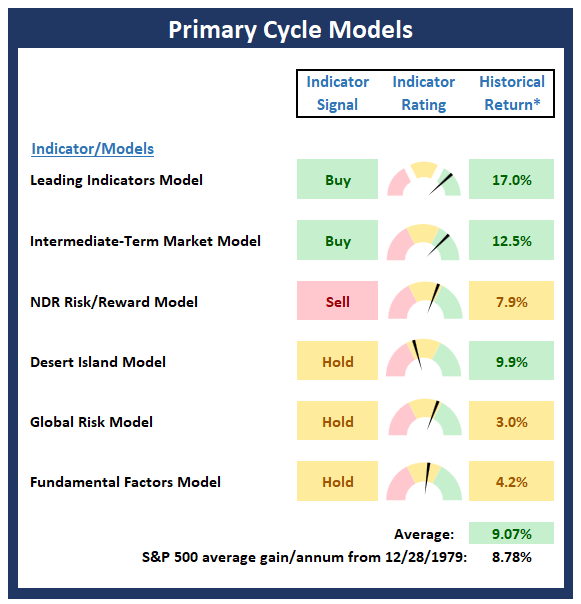
As Exhibit A in my argument, I will direct your attention to what I deem to be an important improvement in my Primary Market Models board. This board contains my favorite "big picture" market models, which are all independently built to identify the state of the primary market cycle. As in bull versus bear.
Long-time readers know that our indicator boards have been built to provide the "state of the market" with only a brief glance at the colors on the board.
So, I think it's time to do a quick comparison of the Primary Cycle Boards from the last two weeks. Let's start with last week's board, shown below.
* Source: Ned Davis Research (NDR) as of the date of publication. Historical returns are hypothetical average annual performances calculated by NDR.
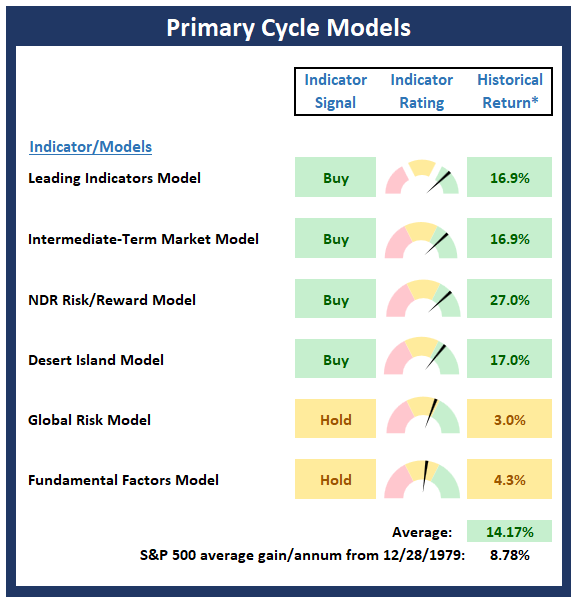
Now let's move on to this week's board...
* Source: Ned Davis Research (NDR) as of the date of publication. Historical returns are hypothetical average annual performances calculated by NDR.
I'm probably not the only one that can see that there is no longer any red on this week's Primary Cycle board. Oh, and there is also a lot more green. While it probably goes without saying, this is a good thing.
The key here is that two more of my favorite long-term, big-picture market models flashed buy signals last week. To be sure, these are NOT great "timing" indicators. No, these are what I like to call "confirmation" indicators, designed to identify which team is in control.
So, with four out of the six models on "buy" signals and the historical annualized returns of the S&P 500 now above +14%, I'm going to argue that maybe, just maybe, we may have a new bull market on our hands.
The Fly in the Ointment
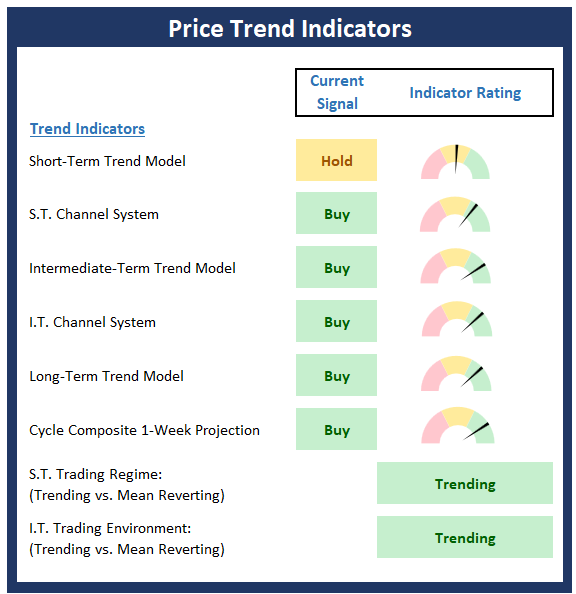
To be sure, the improvement in the Primary Cycle Board is encouraging for anyone seeing the market's glass as at least half full. And then with the abundance of green on Price Trend Indicators board (see below), one can't be blamed for being downright optimistic about the outlook for the stock market.
But... (You knew that was coming, right?) There are a couple flies in the ointment that should give one pause - at least for now.
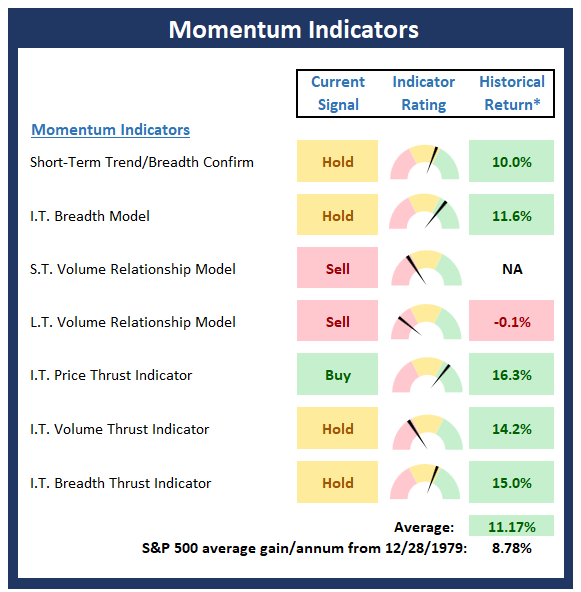
First is the status of the Momentum Indicator Board, which helps determine if there is any "oomph" behind a move in the market. Cutting to the chase, the best moves in the stock market are (a) global in nature and (b) accompanied by strong momentum.
We can certainly make a checkmark next to the "global in nature" box given that the EAFE index (using EFA as a proxy) is outperforming the S&P 500 so far this year (EFA is up +11.6% YTD as of Friday's close vs SPY +8.1%). But unfortunately, the state of market momentum - at least as far as our Momentum Board goes - leaves a lot to be desired.
* Source: Ned Davis Research (NDR) as of the date of publication. Historical returns are hypothetical average annual performances calculated by NDR.
So... With the Momentum Board displaying a distinct lack of green in the Current Signal column, investors may want to curb their enthusiasm here. Because the bottom line is this indicator board is best used as confirmation of the price action. Thus, my take is that momentum has not (yet?) confirmed the rally and as such, some caution in a market that is overbought and bumping into resistance is certainly warranted.
Before you get too depressed about this, remember that there is still plenty of time for confirmation to occur. This is longer-term, big-picture stuff. So, if the bulls can get their act together and create some "oomph" to the upside at some point soon, the Momentum Board could certainly catch up. But at this stage of the game, this situation should be viewed as a yellow flag.
The Bottom Line
In sum, the conditions in the stock market have improved and the price action is in pretty good shape. In addition, my big-picture market models suggest that a new bull market may be getting started. But, as detailed above, with momentum not confirming at this point, it is probably best to keep some powder dry - just in case.
Now let's review the "state of the market" through the lens of our market models...
Primary Cycle Models
Below is a group of big-picture market models, each of which is designed to identify the primary trend of the overall "state of the stock market."
* Source: Ned Davis Research (NDR) as of the date of publication. Historical returns are hypothetical average annual performances calculated by NDR.
Trend Analysis:
Below are the ratings of key price trend indicators. This board of indicators is designed to tell us about the overall technical health of the market's trend.
Market Momentum Indicators
Below is a summary of key internal momentum indicators, which help determine if there is any "oomph" behind a move in the market.
* Source: Ned Davis Research (NDR) as of the date of publication. Historical returns are hypothetical average annual performances calculated by NDR.
Early Warning Indicators
Below is a summary of key early warning indicators, which are designed to suggest when the market may be ripe for a reversal on a short-term basis.
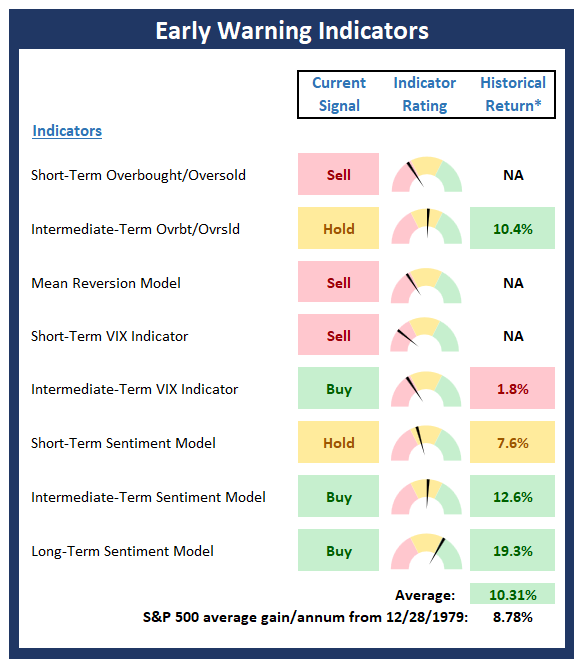
* Source: Ned Davis Research (NDR) as of the date of publication. Historical returns are hypothetical average annual performances calculated by NDR.
Fundamental Factor Indicators
Below is a summary of key external factors that have been known to drive stock prices on a long-term basis.
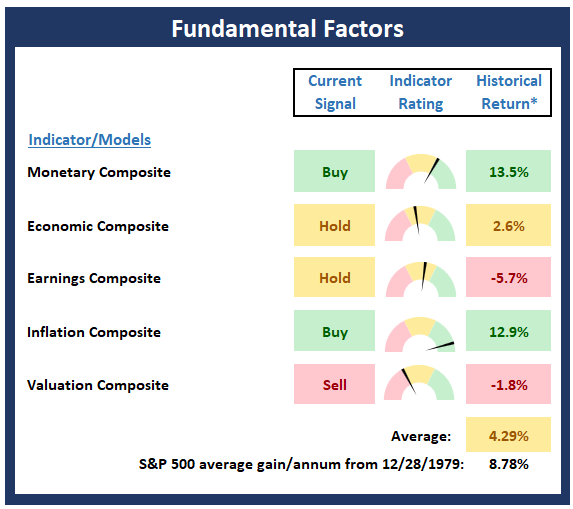
* Source: Ned Davis Research (NDR) as of the date of publication. Historical returns are hypothetical average annual performances calculated by NDR.
Thought for the Day:
Turn every bit of adversity into fuel for improvement -Nassim Taleb
Wishing you green screens and all the best for a great day,

David D. Moenning
Founder, Chief Investment Officer
Heritage Capital Research, a Registered Investment Advisor

Disclosures
At the time of publication, Mr. Moenning held long positions in the following securities mentioned: SPY, EFA, MSFT, META, AMZN, V, BA, XOM - Note that positions may change at any time.
NOT INDIVIDUAL INVESTMENT ADVICE. IMPORTANT FURTHER DISCLOSURES