A November to Remember

The State of the Market
A November to remember is showing no signs of letting up in the early going Tuesday. Already the best month in history save October 1987, the month's impressive returns look to expand further today. For those of you keeping score at home, the S&P 500 sports a gain of 6.4% for the month through Monday's close while the small caps (using the Russell 2000 ETF - IWM as a proxy) are on fire with the rotation trade pushing the market's "troops" up nearly 3X its blue-chip brethren.
The impetus for today's buying appears to be two-fold. First, traders seem to be breathing a sigh of relief that a Constitutional crisis no longer appears likely relating to the transfer of Presidential power. In case you missed it, the Trump Administration announced Monday evening that the GSA would begin to cooperate with the President-elect transition. While not exactly a concession, this does appear to be an admission that the Trump era is coming to a close.
The second reason du jour for further rallying in stocks looks to be the announcement that Biden has selected Janet Yellen to be Secretary of the Treasury. The reasons for the positive response here are pretty straightforward. First, the former Fed Chair is a notorious dove (I.E. she won't be calling for higher rates anytime soon). In addition, she has stated publicly that pulling back on spending at this time would be a mistake. As such, her views dovetail nicely with those of Jay Powell's.
The thinking here from a stock market perspective is that the Yellen/Powell team would likely seek a stimulus package at the high end of (or perhaps exceeding) the current range. And while Mitch McConnell's bunch will likely object, the stock market tends to like money flowing into the hands of consumers and, in turn, the U.S. economy.
So for now anyway, it appears that the stock market will continue to look beyond the near-term problems the economy is likely to encounter as well as the anticipated surge in COVID cases, hospitalizations, and deaths after the Thanksgiving holiday. Always cold-hearted by nature, Ms. Market looks to be ignoring the COVID situation (i.e. something everyone already knows) and instead is looking ahead to a time when the majority of Americans have been vaccinated and economic activity begins to normalize.
The State of the Trend Indicators
In keeping with last week's less-is-more theme, let me simply say that the Trend Board remains in pretty good shape here.
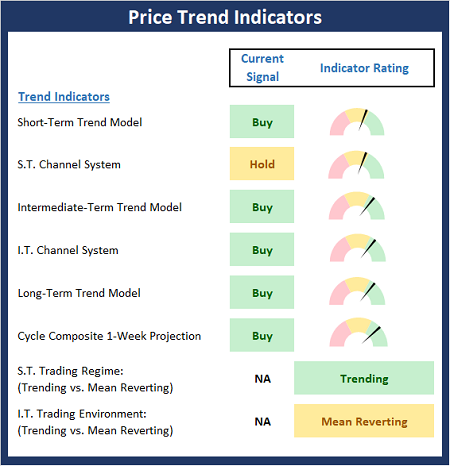
About The Trend Board Indicators: The models/indicators on the Trend Board are designed to determine the overall technical health of the current stock market trend in terms of the short- and intermediate-term time frames.
My Take on the State of the Charts...
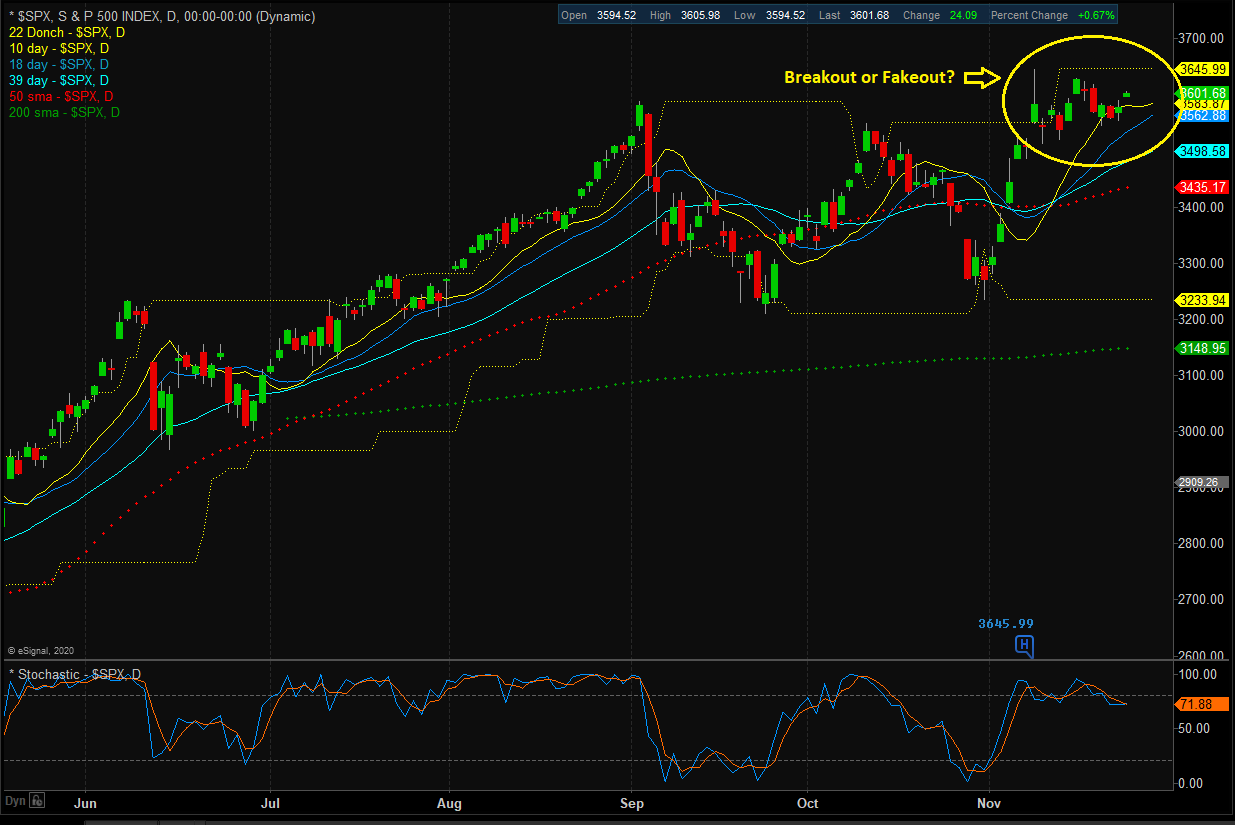
For the last couple weeks, I've been suggesting that the real key to the chart action would be the move either above or below the bounds of the recent trading range. And while last week at this time it appeared that a breakout to the upside was underway, such a move is now in question. Well, as far as the S&P 500 is concerned, that is. Over in small-cap-land, the picture is much clearer.
S&P 500 - Daily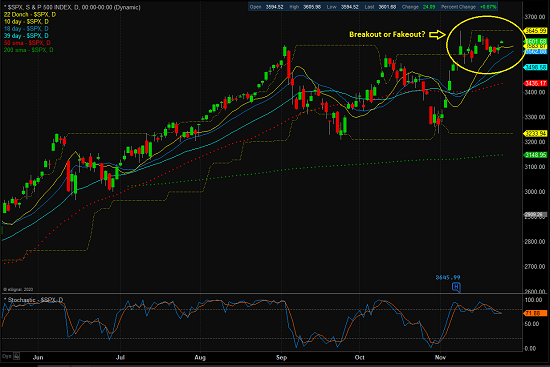
View Full Size Chart
Below is a chart of the Russell 2000 ETF (IWM), which is considered to be the primary proxy for the action in the small-cap space. As you can clearly see, this chart broke out of its range last month and is currently romping higher.
Russell 2000 Small-cap ETF (IWM) - Daily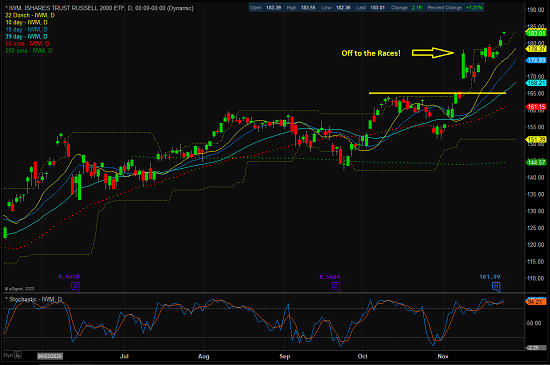
View Full Size Chart
As such, it is easy to argue that market leadership has shifted from the megacap FANMAG names to the "rotation trade." As you likely recall, smaller companies tend to do best when the economy emerges from recession. Or in this case, emerges from a pandemic that has put the kibosh on a good swath of the economy. So, from my seat, it looks like traders are currently discounting the end of the COVID crisis.
Next, let's check in on the state of the market's internal momentum indicators.
The Momentum board appears to be confirming the price action. In short, this is a desired result.
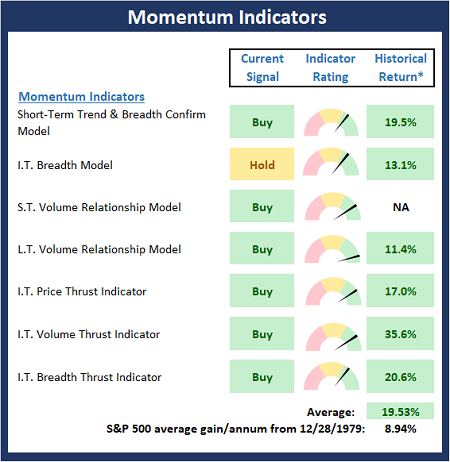
* Source: Ned Davis Research (NDR) as of the date of publication. Historical returns are hypothetical average annual performances calculated by NDR.
Publishing Note: I will be putting away the keyboard for the rest of this holiday-shortened week. Happy Thanksgiving!
Thought For The Day:
The five most dangerous words in business are: Everybody else is doing it. -Warren Buffett
Wishing you green screens and all the best for a great day,

David D. Moenning
Founder, Chief Investment Officer
Heritage Capital Research, an SEC Registered Investment Advisor

Disclosures
At the time of publication, Mr. Moenning held long positions in the following securities mentioned: IWM - Note that positions may change at any time.
NOT INDIVIDUAL INVESTMENT ADVICE. IMPORTANT FURTHER DISCLOSURES