All About The Expectations

The S&P 500 closed out the week just off fresh all-time highs. But, to many investors, the rally is definitely a head-scratcher. So, if you find yourself wondering how stocks can be correcting lower one minute and then back at all-time highs the next, here's my quick take on the situation.
Despite increasing talk about the status of the inflation surge and rising prices/costs just about everywhere you look, traders appear to be looking on the bright side. As in the state of the earnings season - as well as projected EPS growth into next year.
To back up my assessment, I'd like to offer a couple charts.
First is a chart our furry friends in the bear camp are sure to enjoy. As you can easily see, the percentage of small business owners who have either raised worker compensation or plan to raise compensation in the next three months, has surged.
Worker Compensation Surging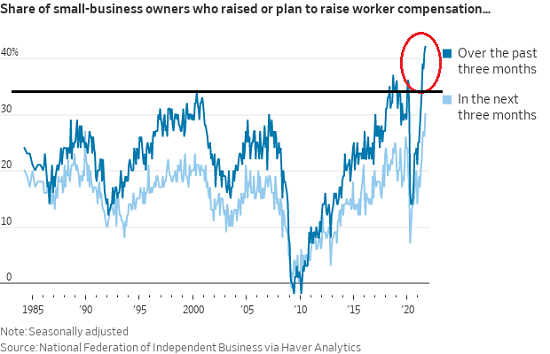
Image Source: WSJ
The problem, of course, is that worker compensation is a key component to inflation. Oh, and as any business owner knows, worker compensation costs only go one direction - up. As such, one can argue that these costs are unlikely to be "transitory." 'Nuf said.
At the same time, those looking at this glass as half-full can argue that increased compensation means more money in consumers' pockets. Which, in turn, leads to increased spending. And more spending (I.E. increased economic activity) ultimately means more earnings for the companies selling the stuff/services.
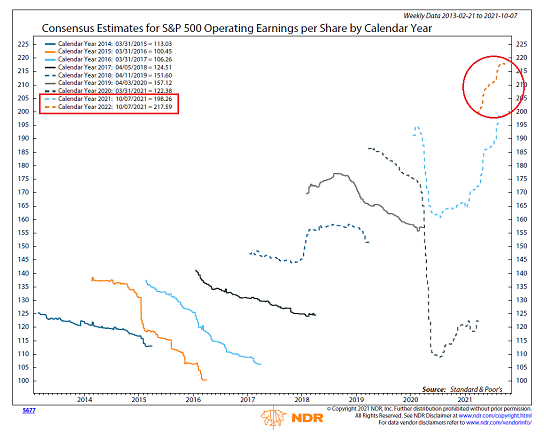
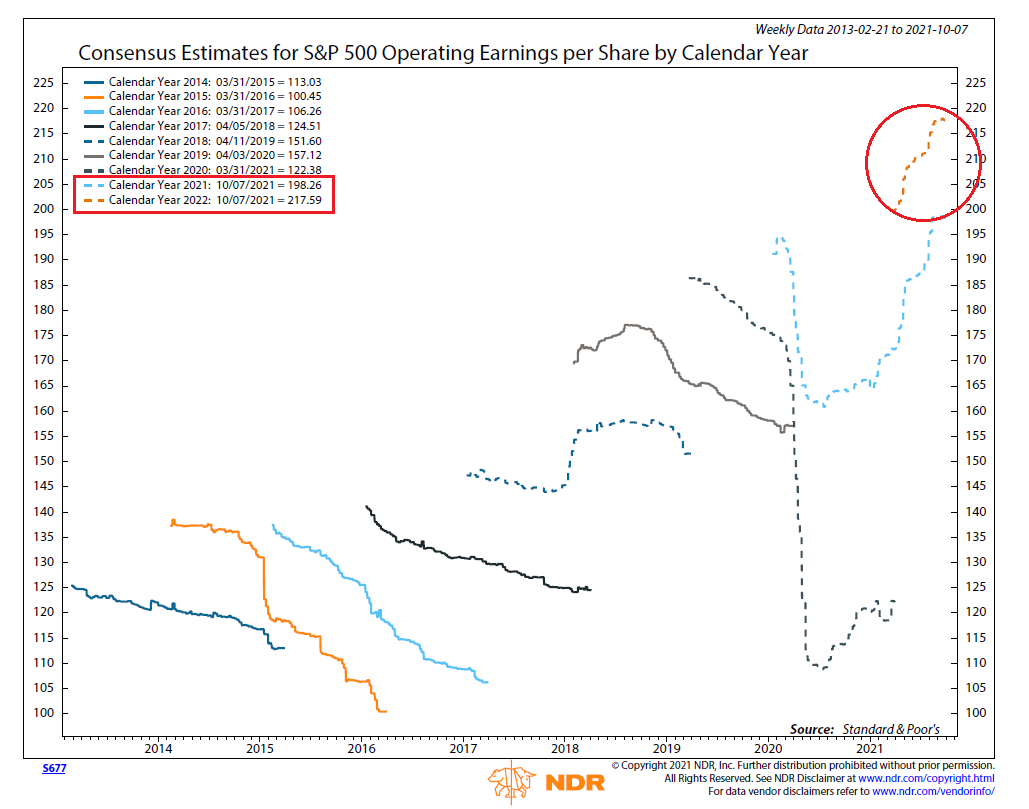
Below is my Exhibit B on this fine Monday morning. This chart from Ned Davis Research Group, shows the consensus estimates for the S&P 500 earnings per share (operating earnings), plotted over time.
View Full Size Chart
* Source: Ned Davis Research
As we have discussed in the past, analysts are usually too optimistic about next year's earnings. As such, the consensus estimates tend to move lower over time. This is seen by the downwardly sloping lines shown for most calendar years. (Examples: 2014, 2015, 2016, 2017 and 2019).
However, look at 2021 and 2022. As COVID shuttered the economy, analysts quickly slashed EPS estimates. But then the economy reopened and analysts have been scrambling to keep up with the surprisingly strong rebound in earnings ever since.
For me, this situation is pretty straightforward. As I've learned over the years, rising earnings expectations tends to result in rising stock prices. Period.
And as the chart illustrates, 2022 EPS estimates are currently 9.7% higher than 2021's. So, from my perhaps overly simplistic view, I'm not surprised to see stocks continuing to move higher.
Can this change? Of course! Are valuations a concern? Sure. Can inflation or corporate tax hikes change the expectations? You betcha. Will EPS estimates march higher indefinitely? Uh, no. Can something come out of the woodwork to interrupt the bull run? Always.
But my current view is that as long as earnings estimates trend higher, stock prices can move up too. Thus, I will continue to monitor this chart each and every week - and I promise to report back when/if the picture changes.
Now let's get the new week started with a review the "state of the market" from a modeling perspective...
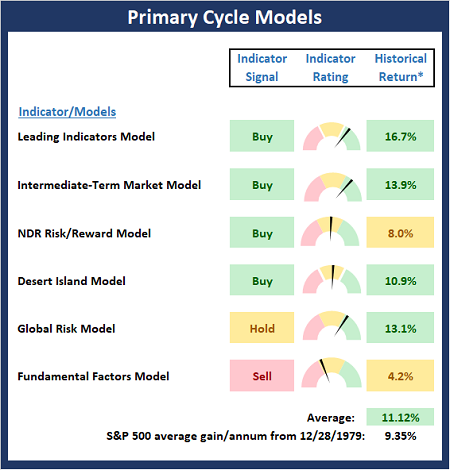
The Big-Picture Market Models
We start with six of our favorite long-term market models. These models are designed to help determine the "state" of the overall market.
* Source: Ned Davis Research (NDR) as of the date of publication. Historical returns are hypothetical average annual performances calculated by NDR.
Current Take: Big Picture Models
There is some movement to report on Primary Cycle Board this week as the Fundamental Factors Composite moved into negative territory. Granted, not by much - but negative all the same. However, the overall reading from the big-picture market models suggests that we continue to favor the bulls.
The Fundamental Backdrop
Next, we review the market's fundamental factors including interest rates, the economy, earnings, inflation, and valuations.
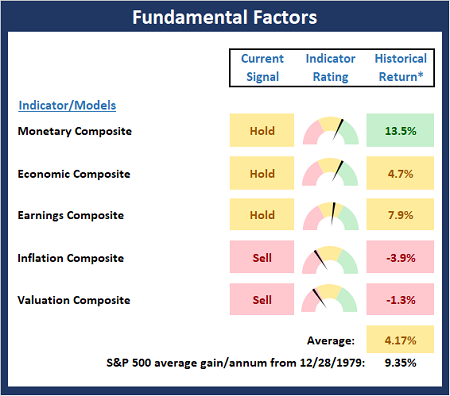
* Source: Ned Davis Research (NDR) as of the date of publication. Historical returns are hypothetical average annual performances calculated by NDR.
Current Take: Fundamental Models
There were two changes to the Fundamental Board this week as both our Monetary and Inflation Composites moved lower. The Monetary Composite went from Buy to Hold and the Inflation Models moved from Hold to Sell. As I've been saying, the board reminds us that while the bulls remain in control, there are issues to contend with.
The State of the Trend
After reviewing the big-picture models and the fundamental backdrop, I like to look at the state of the current trend. This board of indicators is designed to tell us about the overall technical health of the market's trend.
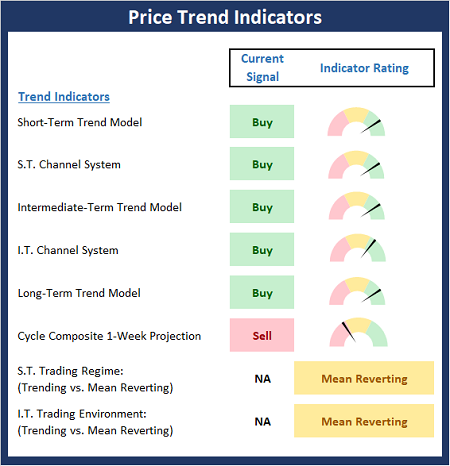
Current Take: Trend Models
The Trend Board improved a bit last week as the Short-Term Channel System moved from neutral to positive with the move to new all-time highs. Bottom Line: The board indicates the bulls are in possession of the ball right now.
The State of Internal Momentum
Next, we analyze the momentum indicators/models to determine if there is any "oomph" behind the current move.
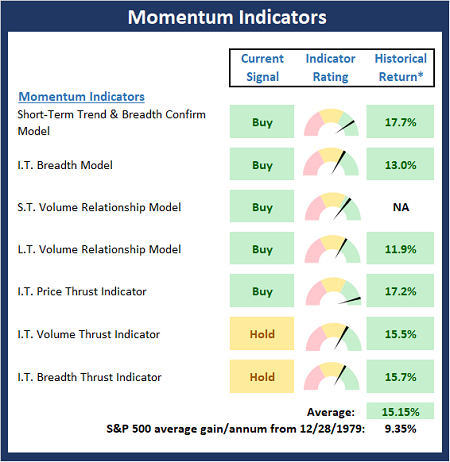
* Source: Ned Davis Research (NDR) as of the date of publication. Historical returns are hypothetical average annual performances calculated by NDR.
Current Take: Momentum Models
The Momentum Board saw some additional improvement last week as the Short-Term Volume Relationship model upticked. Bottom Line: The board suggests the bulls have taken control.
Early Warning Indicators
Finally, we look at our early warning indicators to gauge the potential for countertrend moves. This batch of indicators is designed to suggest when the table is set for the trend to "go the other way."
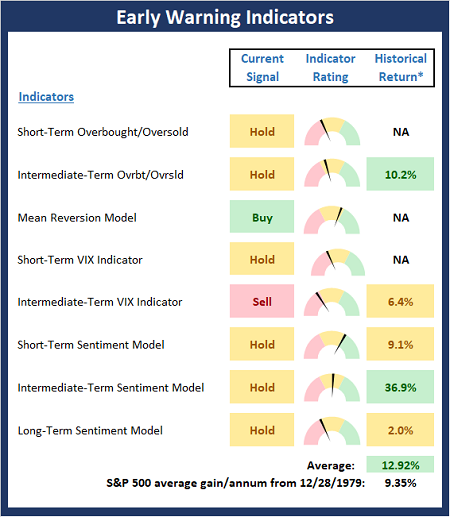
* Source: Ned Davis Research (NDR) as of the date of publication. Historical returns are hypothetical average annual performances calculated by NDR.
Current Take: Early Warning Models
Last week, we noted the Early Warning Board had moved toward the neutral zone - a trend that continued again this week. For example, our Intermediate-Term VIX Indicator flashed a sell signal and both the Short- and Intermediate-Term Sentiment models also slipped a notch. As such, the board suggests that a pause in the upside action wouldn't be surprising in the near-term.
Thought for the Day:
There are two kinds of forecasters. Those who don't know and those who don't know they don't know. -J. Kenneth Galbraith
Wishing you green screens and all the best for a great day,

David D. Moenning
Founder, Chief Investment Officer
Heritage Capital Research, a Registered Investment Advisor

Disclosures
At the time of publication, Mr. Moenning held long positions in the following securities mentioned: None - Note that positions may change at any time.
NOT INDIVIDUAL INVESTMENT ADVICE. IMPORTANT FURTHER DISCLOSURES