All About The Stimulus
Executive Summary:
I'm often asked why I keep a 1-minute chart of the S&P 500 on my screen at all times. Since I don't trade on a short-term basis, it can be argued that the minute-to-minute movement of the market should be ignored. However, by watching the intraday action closely, the drivers of the market oftentimes become quite clear.
Such was the case yesterday afternoon as the President's announcement on Twitter that he was ending negotiations for further economic stimulus - stimulus that Fed Chairman Powell had practically begged for earlier in the day - sent stock prices into a freefall. Within 9 minutes of the tweet, the DJIA dove 548 points. And less than 20 minutes after the tweet, the Dow had fallen 625 points. Therefore, it was pretty clear that the market cares about additional economic stimulus - a lot.
Of course, the President's about-face on the topic of stimulus later in the evening appeared to cause the opposite effect as stock futures moved higher and the market has popped higher at the open, with the Dow rallying about 450 points as I type. So, from my perch, it is clear the primary driver of the market at this point in time is not the election, not earnings, not the outlook for inflation, but rather the state of additional stimulus.
My take is if a deal to put money in the hands of Americans who are suffering, airlines, restaurants, and small businesses can get done, then stocks can look ahead to better days. But if the stimulus becomes a political standoff, my guess is a test of the 200-day could be on the table.
Next, let's take a look at our Early Warning board for additional clues about the near-term action...
The State of the "Early Warning" Indicators
The Early Warning board is now in no-man's land. While I can argue that stocks are moving toward an overbought condition, sentiment is moving the other way, and the VIX indicators are neutral. One glance at the board below tells the whole story here as neither team has an edge. Thus, my take is that it's "game on" for control of the ball and the next meaningful move in the stock market.
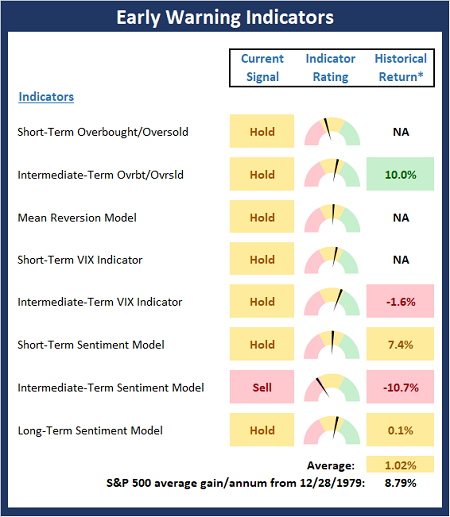
* Source: Ned Davis Research (NDR) as of the date of publication. Historical returns are hypothetical average annual performances calculated by NDR. Past performances do not guarantee future results or profitability - NOT INDIVIDUAL INVESTMENT ADVICE.
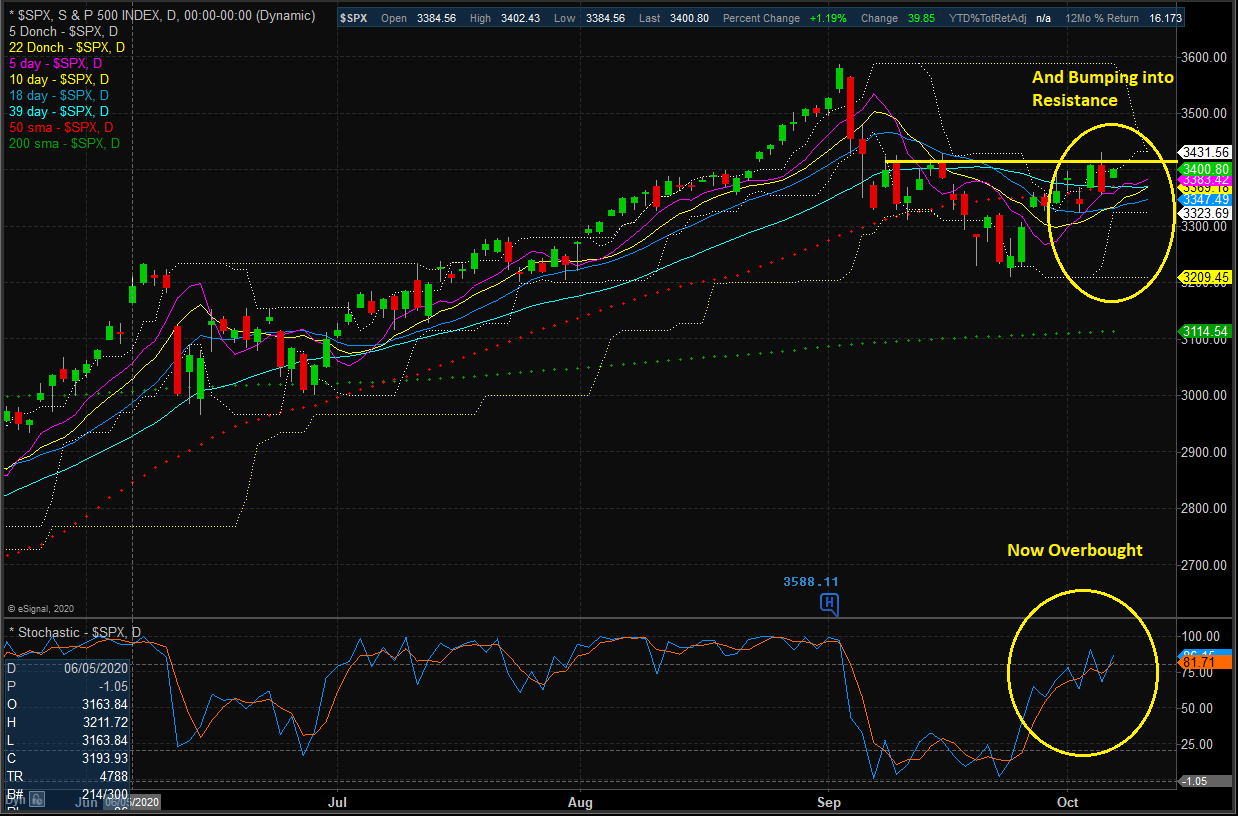
Stochastic Review
As you can see on the chart below, the stochastics are now in overbought territory. And with the S&P now bumping into overhead resistance, the argument can be made that it could be time for the bears to make a run. However, my feeling is that we're seeing a battle for control right at a critical technical juncture. As such, the near-term action once again takes on added importance. At the very least, we should expect volatility to stick around until the uncertainties over the stimulus and the prospects of a contested election are resolved.
S&P 500 - Daily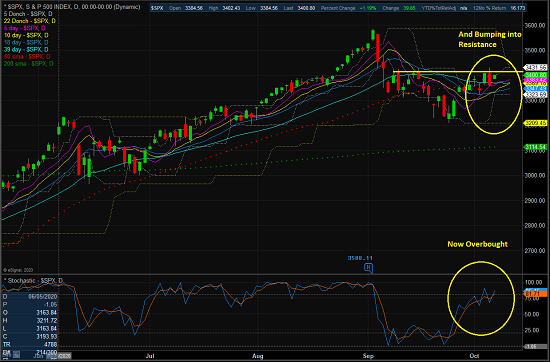
View Large Chart Online
Publishing Note: I am traveling through early next week and will publish reports as time permits.
Thought For The Day:
The great question is not whether you have failed, but whether you are content with failure. -Chinese Proverb
Wishing you green screens and all the best for a great day,

David D. Moenning
Founder, Chief Investment Officer
Heritage Capital Research

Disclosures
At the time of publication, Mr. Moenning held long positions in the following securities mentioned: None - Note that positions may change at any time.
Early Warning Models Explained
Short-Term Overbought/sold Indicator: This indicator is the current reading of the 14,1,3 stochastic oscillator. When the oscillator is above 80 and the %K is above the %D, the indicator gives an overbought reading. Conversely, when the oscillator is below 20 and %K is below its %D, the indicator is oversold.
Intermediate-Term Overbought/sold Indicator: This indicator is a 40-day RSI reading. When above 57.5, the indicator is considered overbought and when below 45 it is oversold.
Mean Reversion Model: This is a diffusion model consisting of five indicators that can produce buy and sell signals based on overbought/sold conditions.
VIX Indicator: This indicator looks at the current reading of the VIX relative to a series of Donchian Channel bands. When the indicator reaches an extreme reading in either direction, it is an indication that a market trend could reverse in the near-term.
Short-Term Sentiment Indicator: This is a model-of-models composed of 18 independent sentiment indicators designed to indicate when market sentiment has reached an extreme from a short-term perspective. Historical analysis indicates that the stock market's best gains come after an environment has become extremely negative from a sentiment standpoint. Conversely, when sentiment becomes extremely positive, market returns have been subpar.
Intermediate-Term Sentiment Indicator: This is a model-of-models composed of 7 independent sentiment indicators designed to indicate when market sentiment has reached an extreme from a intermediate-term perspective. Historical analysis indicates that the stock market's best gains come after an environment has become extremely negative from a sentiment standpoint. Conversely, when sentiment becomes extremely positive, market returns have been subpar.
Long-Term Sentiment Indicator: This is a model-of-models composed of 6 independent sentiment indicators designed to indicate when market sentiment has reached an extreme from a long-term perspective. Historical analysis indicates that the stock market's best gains come after an environment has become extremely negative from a sentiment standpoint. Conversely, when sentiment becomes extremely positive, market returns have been subpar.
NOT INVESTMENT ADVICE. The opinions and forecasts expressed herein are those of Mr. David Moenning and Heritage Capital Research and may not actually come to pass. The opinions and viewpoints regarding the future of the markets should not be construed as recommendations. The analysis and information in this report is for informational purposes only. No part of the material presented in this report is intended as an investment recommendation or investment advice. Neither the information nor any opinion expressed constitutes a solicitation to purchase or sell securities or any investment program.
Any investment decisions must in all cases be made by the reader or by his or her investment adviser. Do NOT ever purchase any security without doing sufficient research. There is no guarantee that the investment objectives outlined will actually come to pass. All opinions expressed herein are subject to change without notice. Neither the editor, employees, nor any of their affiliates shall have any liability for any loss sustained by anyone who has relied on the information provided.
Mr. Moenning of Heritage Capital Research is an investment adviser representative of Eastsound Capital Advisors, LLC, a registered investment advisor. The adviser may not transact business in states where it is not appropriately registered, excluded or exempted from registration. Individualized responses to persons that involve either the effecting of transaction in securities, or the rendering of personalized investment advice for compensation, will not be made without registration or exemption.
Mr. Moenning and Heritage Capital Research may at times have positions in the securities referred to and may make purchases or sales of these securities while publications are in circulation. Positions may change at any time.
The analysis provided is based on both technical and fundamental research and is provided "as is" without warranty of any kind, either expressed or implied. Although the information contained is derived from sources which are believed to be reliable, they cannot be guaranteed.
The author neither endorses nor warrants the content of this site, any embedded advertisement, or any linked resource. The author or his managed funds may hold either long or short positions in the referenced securities. Republication rights must be expressly granted by author in writing.
Investments in equities carry an inherent element of risk including the potential for significant loss of principal. Past performance is not an indication of future results.