All About The Vaccine (Today)
The State of the Market
When I began writing back my oftentimes meandering morning market missive (back in 1998), the original purpose was to identify the primary driving forces of the stock market on a daily basis. The thinking was if I knew what was driving the market from a short-term perspective, I wasn't likely to get fooled when the environment shifted in a meaningful way. For example, there are times when the Fed drives stock prices. There are times when the economic outlook drives the action. The list goes on and on... Inflation. Rates. Earnings. Valuations. Wars. Credit conditions. And of course, the news/tweets of the day.
To be sure, it is the latter that is driving stock prices at the present time. In case you missed it, the really good news of the day is the preliminary results from Moderna's (MNRA) Stage 3 vaccine trial, which was 94.5% effective. This means that only 5 out of 95 people participating in the trial who developed Covid-19 got sick after being vaccinated. The other 90 people developing Covid had received the placebo.
This is the second consecutive Monday in which traders have been greeted with really good news on the vaccine front. And by now, everyone knows the drill. When we get good virus news, the "recovery" stocks are bought with both hands and the "stay at home" stocks are used as a source of funds. Then when we get bad news on the virus - you know, like an exponential increase in cases, hospitalizations, and deaths - traders go the other way with their trades on the day.
If you find it odd that stocks would be rallying to record highs in the face if what is likely to be a very grim winter with Covid-19, you aren't alone. But the key is to remember that the stock market is (everyone join in) "a discounting mechanism of future expectations."
So, the question of the day is if the vaccine can be widely distributed within the time for which the stock market tends to look ahead to. While we can argue about this until the cows come home, I believe the market looks ahead by about six to nine months. So, six months from mid-November is mid-May and nine months puts us at mid-August. Both of which are time frames that folks like Dr. Fauci have suggested the vast majority of the population could be vaccinated within.
So... It is easy to argue that stocks are justified in looking ahead to more normal days. Yes, things are likely to get ugly on the virus front between now and New Year's Eve. And yes, further lockdowns could throw the "look ahead to better days" trade for a loop. But for today anyway, the game is to reduce your Covid winners and to buy those cyclical/value stocks that have taken such a beating this year.
For me, the next big question is if this "rotation" is just a trade or the start of a meaningful shift. There are LOTS of opinions on this subject, and many of the analysts I respect are arguing in favor of a meaningful. As such, I need to keep my mind and eyes open. But unless you make your living trading on a very short-term basis, I think the key here is to recognize that the bulls are in control of the ball and are looking ahead to better days.
Now let's turn to the state of my favorite big-picture market models...
The Big-Picture Market Models
There are no changes to report on the Primary Cycle board this week. In short, this tells me to give our Heroes in Horns the benefit of any/all doubt. So, as I've been opining for some time now, I believe the board supports the idea that stocks remain in a cyclical bull market and that investors with a longer-term time horizon should continue to (a) stay onboard the bull train and (b) be prepared to "buy the dips" whenever bad news comes along.
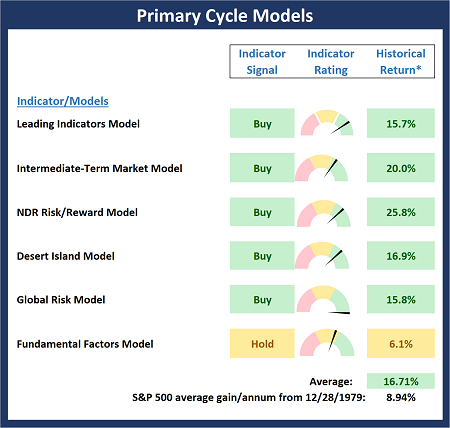
* Source: Ned Davis Research (NDR) as of the date of publication. Historical returns are hypothetical average annual performances calculated by NDR.
Checking On The "Primary" Cycles
While I don't often make portfolio adjustments based on the long-term trends in the stock market (aka the "primary cycles"), I have found over the years that checking in on state of the cycles and the weekly/monthly charts helps to keep the big-picture in perspective.
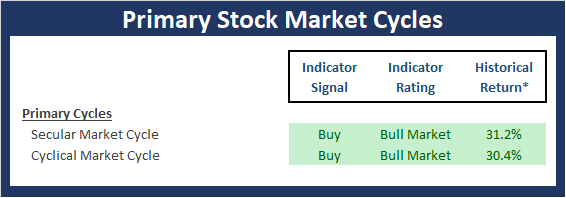
* Source: Ned Davis Research (NDR) as of the date of publication. Historical returns are hypothetical average annual performances calculated by NDR.
The Secular Market Cycle
Definition: A secular bull market is a period in which stock prices rise at an above-average rate for an extended period (think 5 years or longer) and suffer only relatively short intervening declines. A secular bear market is an extended period of flat or declining stock prices. Secular bull or bear markets typically consist of multiple cyclical bull and bear markets. Below is a monthly chart of the S&P 500 Index illustrating the current cycle, which we estimate began on March 9, 2009.
S&P 500 - Monthly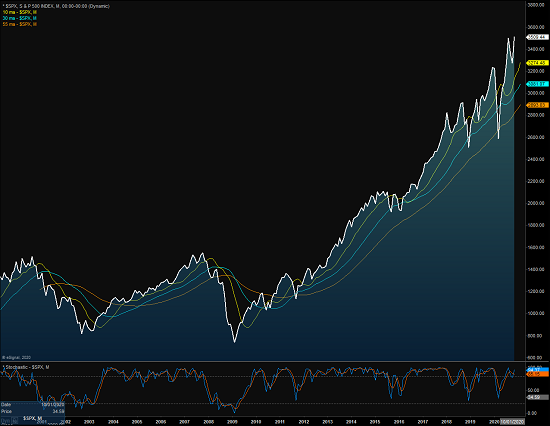
View Full Size Chart Online
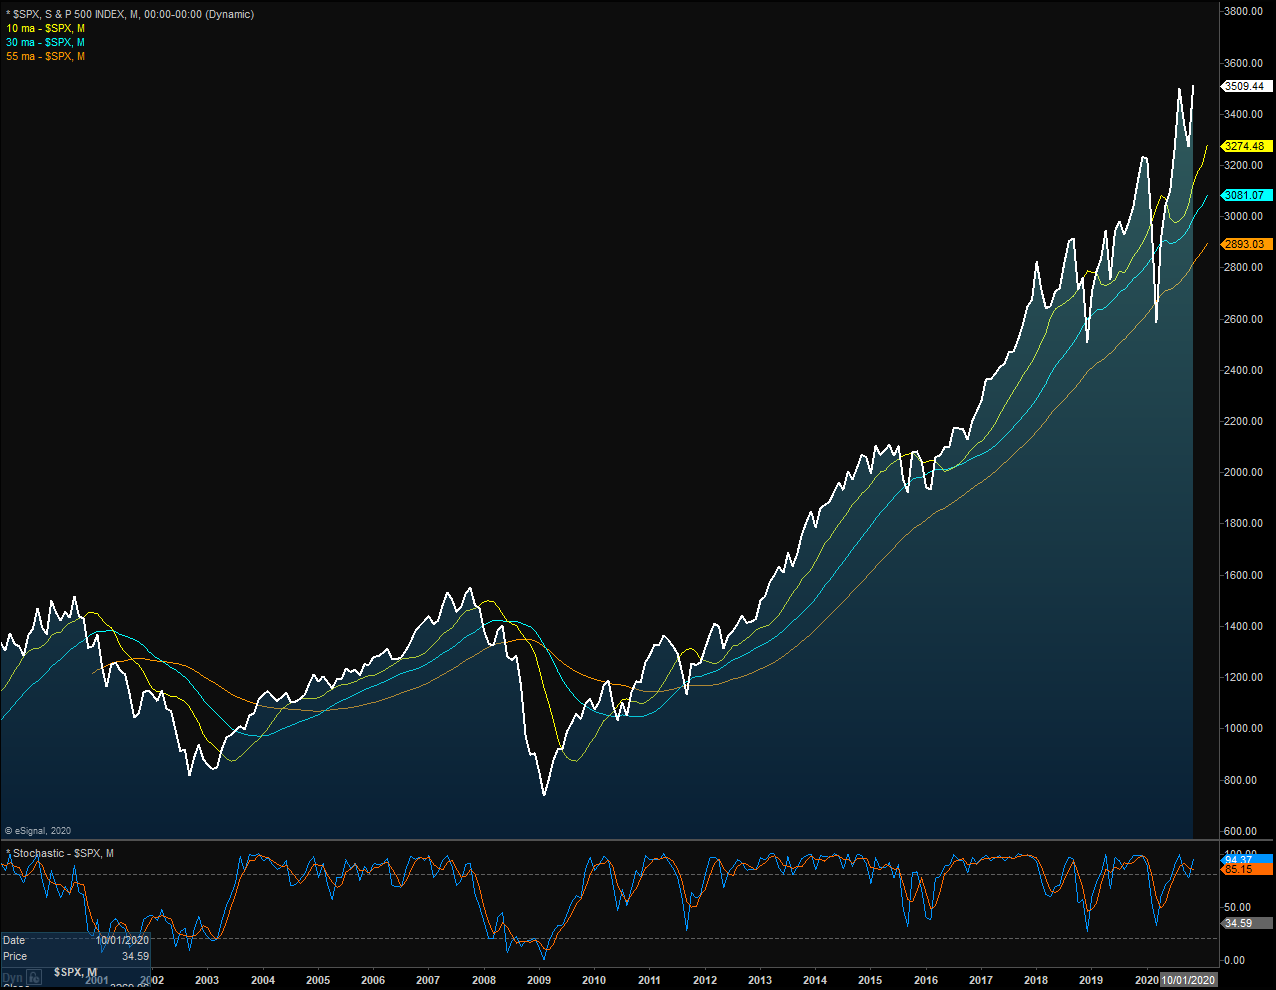
The Cyclical Market Cycle
Definition: A cyclical bull market requires a 30% rise in the DJIA after 50 calendar days or a 13% rise after 155 calendar days. Reversals of 30% in the Value Line Geometric Index since 1965 also qualify. A cyclical bear market requires a 30% drop in the DJIA after 50 calendar days or a 13% decline after 145 calendar days. Reversals of 30% in the Value Line Geometric Index also qualify. Below is a weekly chart of the S&P 500 illustrating the current cycle, which we estimate began on March 24, 2020.
S&P 500 - Weekly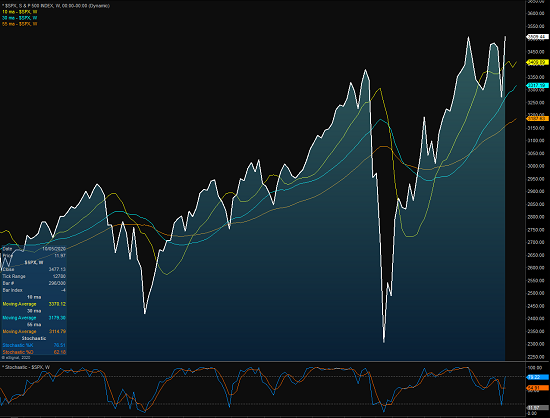
View Full Size Chart Online
Thought For The Day:
Simplicity is the ultimate sophistication. -Leonardo da Vinci
Wishing you green screens and all the best for a great day,

David D. Moenning
Founder, Chief Investment Officer
Heritage Capital Research, an SEC Registered Investment Advisor

Disclosures
At the time of publication, Mr. Moenning held long positions in the following securities mentioned: none - Note that positions may change at any time.
NOT INDIVIDUAL INVESTMENT ADVICE. IMPORTANT FURTHER DISCLOSURES