Are Valuations A Problem Here (Or Not)?
Executive Summary:
Monetary conditions, which includes Fed policy, remain exceptionally/historically favorable. Both economic data and corporate earnings have been coming in better than expected. Inflation, while showing some signs of life recently, isn't likely to be a problem for stocks in the foreseeable future. And while valuations are clearly high, this is a fairly common occurrence in post-recession market cycles (see explanation below). Thus, my take is the fundamentals continue to support the bull case.
My Take on the State of the Fundamental Backdrop...
There are no changes to report on the Fundamental Factors board this week. As I've been saying, I believe the uber-friendly monetary conditions basically trump everything else on the board here.
On the inflation front, while this week's releases definitely got the bond market's attention (the yield on the U.S. 10-Year moved from 0.54% to 0.72% this week), the stock market remains sanguine on the subject due to the idea that the Fed is likely to let the economy "run hot" for quite some time in order to bring unemployment down to desired levels. In sum, my take is the board is more positive than the block colors might indicate at first glance.

* Source: Ned Davis Research (NDR) as of the date of publication. Historical returns are hypothetical average annual performances calculated by NDR. Past performances do not guarantee future results or profitability - NOT INDIVIDUAL INVESTMENT ADVICE.
View Fundamental Indicator Board Online
The clear negative on the board is the valuation section. With the guage reading pegged at 0%, there can be little argument that the reading is worrisome. Below are three charts that support the negative readings seen on the valuation composite.
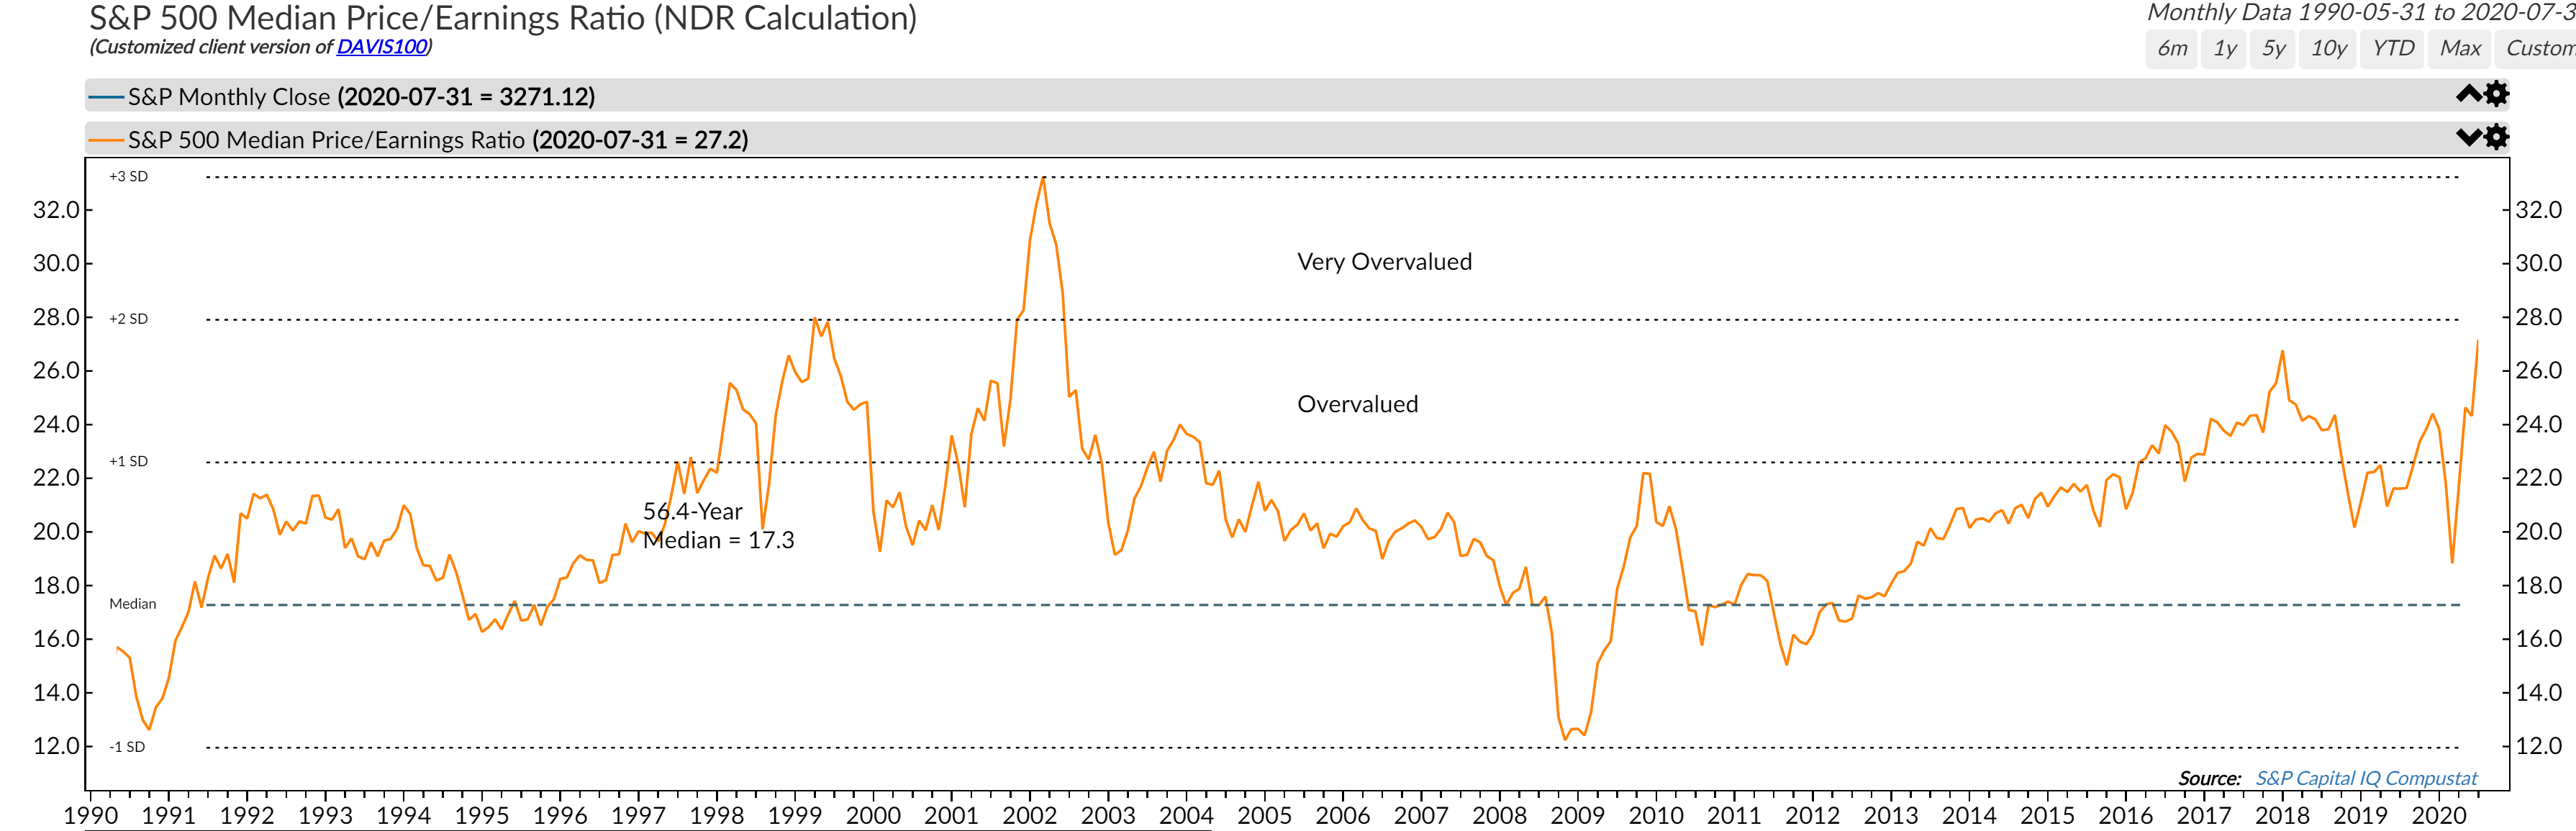
First up is the Median Price-to-Earnings Ratio for the S&P 500.
Median P/E Ratio - S&P 500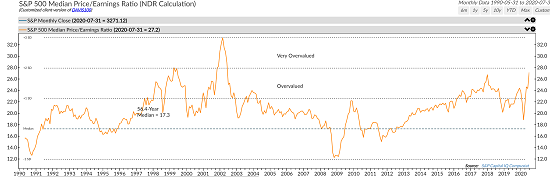
View Chart Online
Image Source: Ned Davis Research Group
For those not familiar with the concept, the Median P/E Ratio looks at the P/E ratio of the median stock within the index - i.e. half above and half below. As such, this provides a nice cross section reading of the index.
As you can see on the chart, the current reading is clearly elevated and is only eclipsed by the readings seen in 1999 and again in 2002.
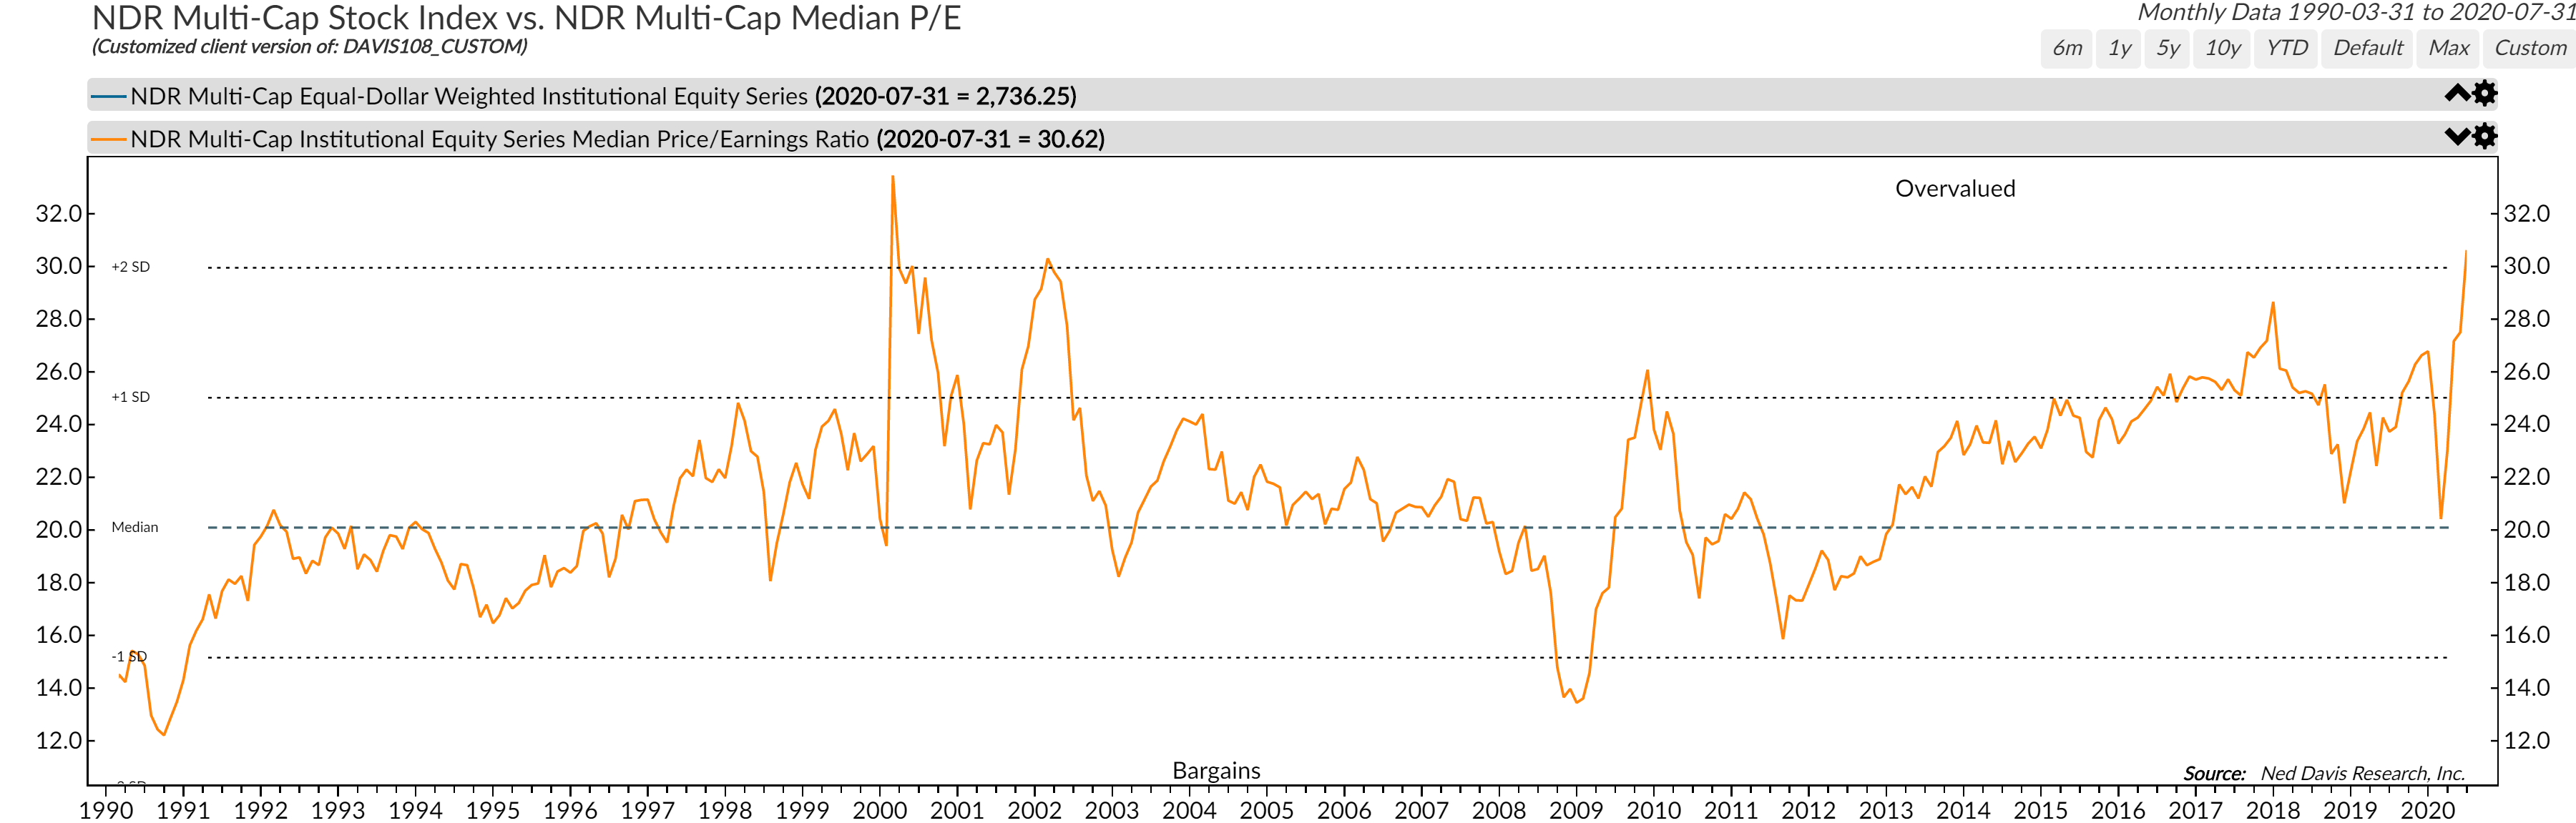
Next up is a chart of the same median P/E concept applied to a much broader, multi-cap universe of the approximately 1500 stocks large enough for institutional investors to own.
Median P/E Ratio - Multicap Universe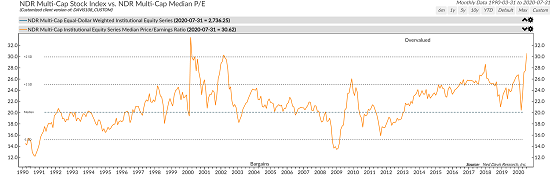
View Chart Online
Image Source: Ned Davis Research Group
The takeaway here is that the broad market valuation looks to be even hotter than the S&P's with the only higher reading seen during the tech bubble of late 1999/2000.
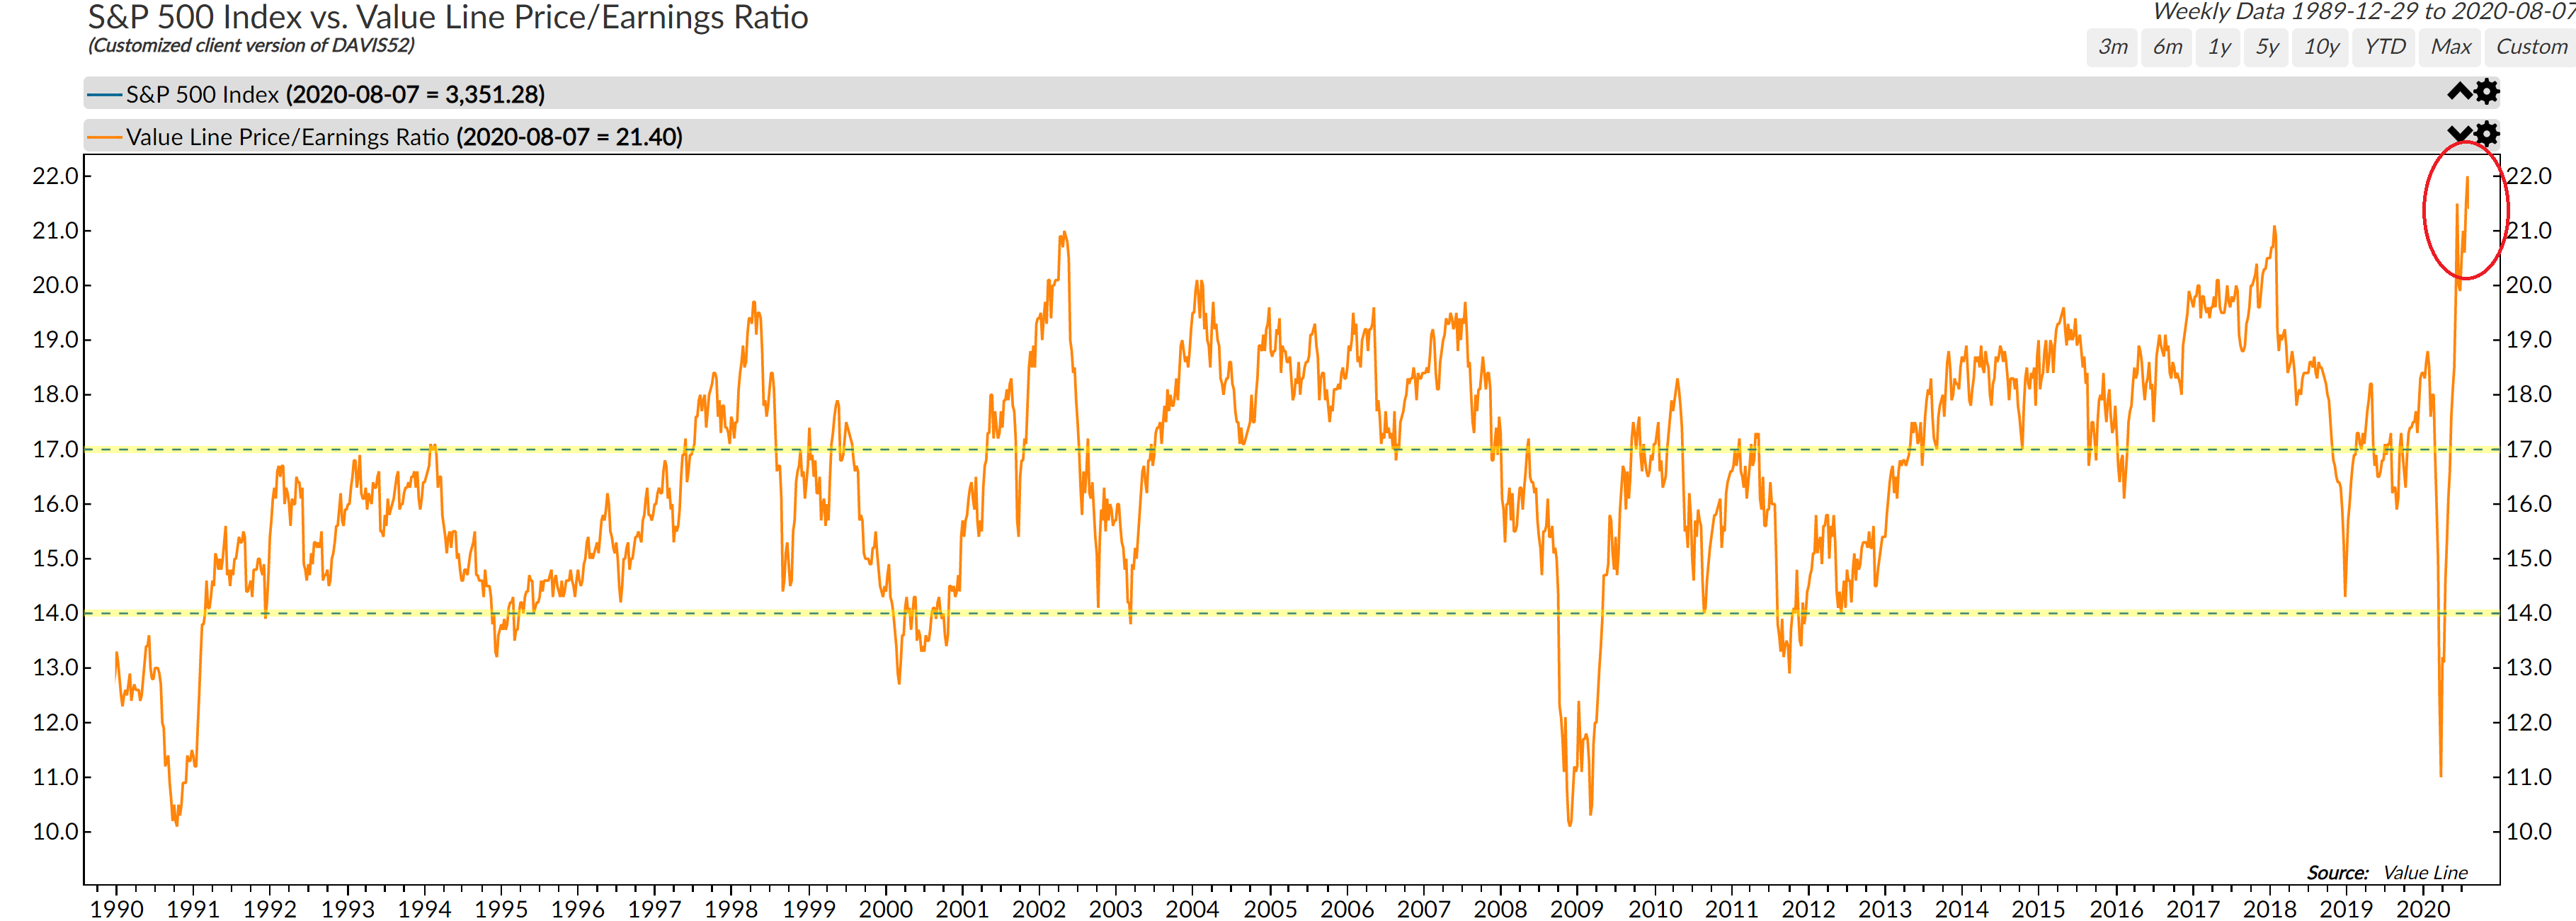
Finally, let's look at the traditional P/E ratio of an even broader index - the Value Line Composite.
P/E Ratio - Value Line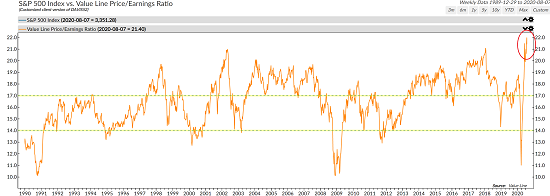
View Chart Online
Image Source: Ned Davis Research Group
If the word "Yikes!" comes to mind when looking at this chart, join the club. The bottom line is that the current spike has pushed the P/E to the highest levels - ever.
But... (You knew that was coming, right?) It is important to understand that P/E's tend to spike after the economy experiences a recession. The key here is to remember that the stock market is a discounting mechanism of future expectations. So, as the economy enters a recession, stock prices (the "P" in P/E) tend to decline precipitously. Naturally, this pushes the P/E Ratio down. The best example of this would be the 2008 financial crisis.
However, as the recession runs its course, Ms. Market begins to sniff out the turn in the economy. Just as we are seeing now, investors "look ahead" to better days by buying stocks BEFORE the economic data - and more importantly, earnings - actually improve. So, with prices moving higher on expectations of an improving economy and earnings having taken a hit from the recession, the P/E ratio tends to spike higher.
From my seat, this is EXACTLY what we are seeing now. The "P" is moving up on hopes for better economic growth while the "E" remains has yet to improve. The result is an abnormally high P/E ratio.
So... As long as the "better days" that investors are looking ahead to show up within the window of time the stock market expects, a spike in P/E's after a recession isn't something to worry about. However, if the anticipated recoveries in the economy and earnings are either delayed or worse, derailed, then the elevated P/E's can present a problem.
On the other side of the valuation coin is the case where P/E's become elevated during an economic expansion. I'll argue this represents a case of "multiple expansion" which in some cases is warranted (i.e. when economic growth is strong) and others, well, not so much (think the technology bubble).
Of course, some analysts argue that we are seeing the equivalent of a bubble in the megacap leaders commonly referred to as FANMAG (FB, AMZN, NFLX, MSFT, AAPL, and GOOGL). Given that this is a complicated issue, I'll save this discussion for another day.
Thought For The Day:
To err is human, to blame it on somebody else shows management potential. -Unknown
Wishing you green screens and all the best for a great day,

David D. Moenning
Founder, Chief Investment Officer
Heritage Capital Research

Disclosures
At the time of publication, Mr. Moenning held long positions in the following securities mentioned: FB, AMZN, NFLX, MSFT, AAPL, and GOOGL - Note that positions may change at any time.
Fundamental Models Explained
Monetary Composite: The popular cliche, "Don't fight the Fed" is really a testament to the profound impact that interest rates and Fed policy have on the market. It is a proven fact that monetary conditions are one of the most powerful influences on the direction of stock prices. The Monetary Composite is a combination of two proprietary monetary models developed by Ned Davis Research. The first is comprised of 14 indicators and is plotted as a composite and the second is made up of eight monetary-related indicators including money supply, and the bond and commodities markets.
Economic Composite: During the middle of bull and bear markets, understanding the overall health of the economy and how it impacts the stock market is one of the few truly logical aspects of the stock market. The economic composite is a series of three models designed to indicate the current state of the economy.
Earnings Composite: A series of four models designed to indicate the overall health of corporate earnings. The first model is based on the slope of the smoothed S&P 500 earnings per share. The second model looks at the drivers of earnings and includes indicators such as U.S. industrial production, the CRB Spot Raw Industrial Material Price Index, the Treasury yield curve, Institute for Supply Management (ISM) indices, corporate bond credit spreads, unemployment claims, and the trend in analyst earnings estimate revisions for the S&P 500. The third model is designed to indicate the likely trend in the earnings per share reported for the S&P 500 Index. This model uses a variety of macro variables to indicate whether current conditions are favorable for strong, moderate, or weak growth in S&P 500 earnings. The fourth model the median 12-month percent change in the one-year analyst forecast out of the 500 components of the index.
Inflation Model: From an historical perspective, one of the best "big picture" indicators of what the market is expected to do next is inflation. The Inflation model is designed to identify cyclical changes in the rate of inflation. The model consists of 22 individual indicators primarily measuring various rates of change of such indicators as commodity prices, the Consumer Price Index (CPI), producer prices, and industrial production.
Valuation Composite: If you want to get analysts really riled up, you need only to begin a discussion of market valuation. While the question of whether stocks are overvalued or undervalued appears to be a simple one, the subject is actually extremely complex. The Valuation composite consists of five valuation indicators/models developed by Ned Davis Research. The first valuation indicator reviews the S&P 500 Price-to-Earnings GAAP Ratio relative to normal, expensive, and bargain valuation zones. The second model measures the S&P 500’s Median P/E ratio, representing the median P/E of the 500 stocks in the index. The third model measures the Median P/E ratio of a multi-cap stock index. The fourth indicator is the P/E ratio of the Value Line Index. The fifth model is a composite of 7 indicators designed to reflect stock market valuations based on how various valuation indicators compare to their latest 10-year historical ranges.
NOT INVESTMENT ADVICE. The opinions and forecasts expressed herein are those of Mr. David Moenning and Heritage Capital Research and may not actually come to pass. The opinions and viewpoints regarding the future of the markets should not be construed as recommendations. The analysis and information in this report is for informational purposes only. No part of the material presented in this report is intended as an investment recommendation or investment advice. Neither the information nor any opinion expressed constitutes a solicitation to purchase or sell securities or any investment program.
Any investment decisions must in all cases be made by the reader or by his or her investment adviser. Do NOT ever purchase any security without doing sufficient research. There is no guarantee that the investment objectives outlined will actually come to pass. All opinions expressed herein are subject to change without notice. Neither the editor, employees, nor any of their affiliates shall have any liability for any loss sustained by anyone who has relied on the information provided.
Mr. Moenning of Heritage Capital Research is an investment adviser representative of Eastsound Capital Advisors, LLC, a registered investment advisor. The adviser may not transact business in states where it is not appropriately registered, excluded or exempted from registration. Individualized responses to persons that involve either the effecting of transaction in securities, or the rendering of personalized investment advice for compensation, will not be made without registration or exemption.
Mr. Moenning and Heritage Capital Research may at times have positions in the securities referred to and may make purchases or sales of these securities while publications are in circulation. Positions may change at any time.
The analysis provided is based on both technical and fundamental research and is provided "as is" without warranty of any kind, either expressed or implied. Although the information contained is derived from sources which are believed to be reliable, they cannot be guaranteed.
The author neither endorses nor warrants the content of this site, any embedded advertisement, or any linked resource. The author or his managed funds may hold either long or short positions in the referenced securities. Republication rights must be expressly granted by author in writing.
Investments in equities carry an inherent element of risk including the potential for significant loss of principal. Past performance is not an indication of future results.