Bostic Boost
Until Thursday afternoon, the path of least resistance for both stock and bond prices appeared to be down. Given the macro narrative, this actually made some sense. After all, with February's inflation and economic data coming in hotter/better than expected and the Fed pledging to remain "data dependent," markets had been busy pricing in the necessary adjustments. As in higher peak rates from the Fed and a longer period for those rates to remain elevated.
In turn, investors fretted that the Fed would go too far (because historically, that's what they tend to do) and wind up wrecking the economy in the process. Continuing with the extrapolation of expectations, our furry friends in the bear camp had been arguing that if the economy is headed into a meaningful recession, then earnings were likely to take a hit too. Meaning that estimates are still too high. As are valuations. And as such, stock prices need to go lower. Perhaps even much lower.
So Far, So Good
But a funny thing happened on the way to the market debacle. In short, it didn't happen. Sure, stocks pulled back from their exuberant January highs. But instead of the major indices revisiting and/or breaking to new lows, as was widely and loudly predicted by a growing chorus of Wall Street bears, the market managed to hold up pretty well.
Exhibit A in the argument here is the S&P 500 refused to break below the seemingly all-important 200-day moving average.
For those of you keeping score at home, the 200-day is viewed as the simplistic line in the sand between bullish and bearish environs. Above the 200-day is good. Below is bad.
So, since the S&P 500 had broken below its 50-day moving average with relative ease and then having flirted with the 200-day a couple times in the past week, investors couldn't be blamed for thinking the bears were one bad data point away from yet another flush lower.
A Different View
But right about the time things were looking bleak, Atlanta Fed President Raphael Bostic stepped to the microphone. And while the FOMC had collectively maintained an uber-hawkish stance for some time, Bostic offered up a surprisingly different view. Although Bostic is a non-voter on the Federal Open Market Committee this year, he said that he favors a 25 basis point (0.25%) rate hike at the March meeting.
Up to this point, the talk related to the next Fed meeting had been mostly returning to larger rate hikes. You know, to help rein in inflation - now. As such, Bostic's view was a bit of a departure. And while this was refreshing news for investors, it was the next part that turned the market around - on a dime.
Cutting to the chase, Bostic said while he's open to revising his terminal rate higher from his current outlook of 5.0-5.25%, he also said that he could see the conditions developing for the Fed to pause by mid-to-late summer. Wait, did he say, "pause?"
Yes fans, a Fed official actually used the P-word - out loud - for everyone to hear!
Can It Last?
While we have no idea if or for how long this breath of fresh air will last, and there is a better-than average chance of multiple Fed officials pushing back on Bostic's remark, markets moved up in sigh-of-relief fashion.
Suddenly the thinking was the Fed wasn't going to force the economy off a cliff. And maybe, just maybe, Corporate America could come through the inflation fight relatively unscathed. Which, of course, would be a good thing.
And since the market had just spent the better part of the last month discounting the negative Nancy scenario, the thinking was that stock prices might need to do some un-discounting (and no, I'm not sure that's actually a word) of sorts for a while.
So, for two days at least, stocks rallied, and the S&P appears to have bounced up and off that much ballyhooed line in the sand. Rates fell. And risk was put back on. Well, for a couple days, anyway.
Will the current feel-good mood last, you ask? Frankly, I have no idea. Our models suggest that the bulls still have a chance and deserve the benefit of the doubt. However, my take is they'd best get something going soon or all that positive action seen in January could evaporate.
The Plan
From my perch, this is the stuff that trading ranges are made of. A back-and-forth argument in the market. One minute the mood is upbeat. The next, not so much. One minute the data is supportive. And then, not. So, until the outlook for inflation and the economy can become clearer, the market's road is likely to be bumpy.
So, my suggestion, which, as my compliance department reminds me, is clearly not to be construed as investment advice here, is to pick a side and play the game accordingly. If you think the economy will come through this battle against inflation in fine fashion, you should be buying any and all dips. But if you feel that things are bound to get worse from here, by all means, you should be selling rallies and preparing for those darker days.
For now, my models suggest that it is appropriate to side with the bulls. With the obvious caveat that when/if the models sour, a change in stance would be warranted. So, color me cautiously optimistic for now and as always, data/model dependent.
Now let's review the "state of the market" through the lens of our market models...
Primary Cycle Models
Below is a group of big-picture market models, each of which is designed to identify the primary trend of the overall "state of the stock market."

* Source: Ned Davis Research (NDR) as of the date of publication. Historical returns are hypothetical average annual performances calculated by NDR.
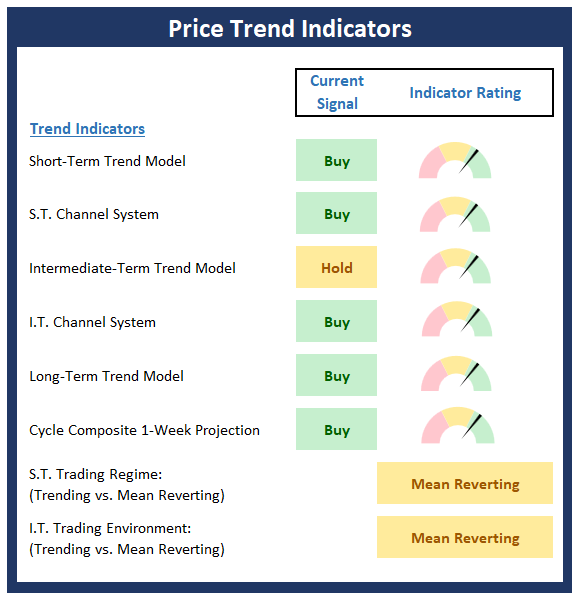
Trend Analysis:
Below are the ratings of key price trend indicators. This board of indicators is designed to tell us about the overall technical health of the market's trend.
Market Momentum Indicators
Below is a summary of key internal momentum indicators, which help determine if there is any "oomph" behind a move in the market.
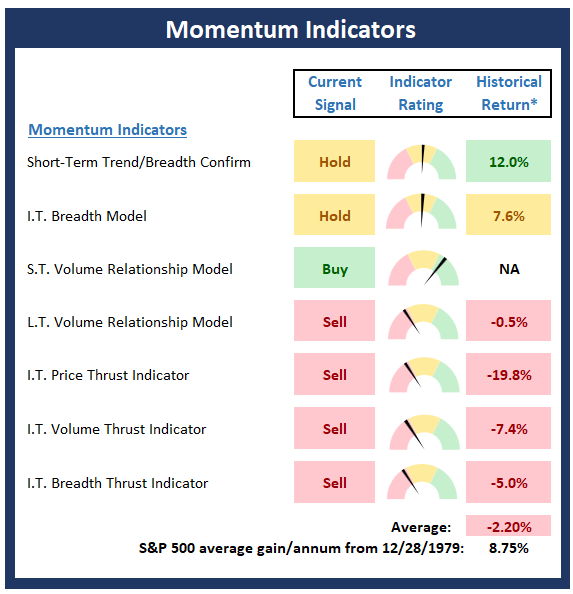
* Source: Ned Davis Research (NDR) as of the date of publication. Historical returns are hypothetical average annual performances calculated by NDR.
Early Warning Indicators
Below is a summary of key early warning indicators, which are designed to suggest when the market may be ripe for a reversal on a short-term basis.
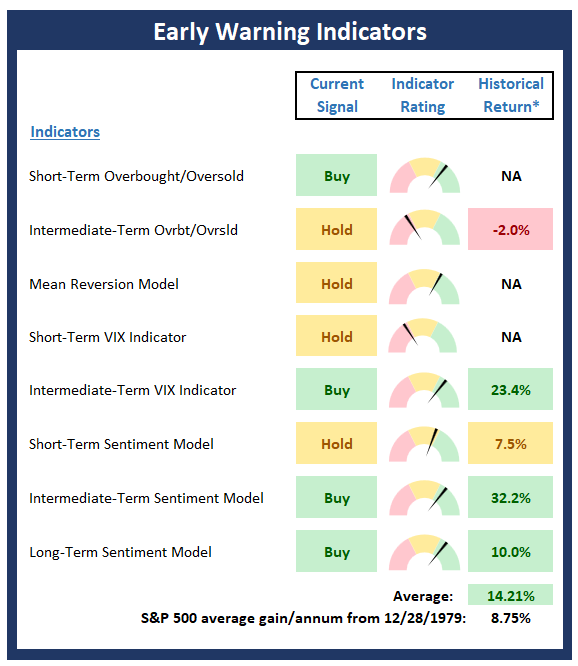
* Source: Ned Davis Research (NDR) as of the date of publication. Historical returns are hypothetical average annual performances calculated by NDR.
Fundamental Factor Indicators
Below is a summary of key external factors that have been known to drive stock prices on a long-term basis.
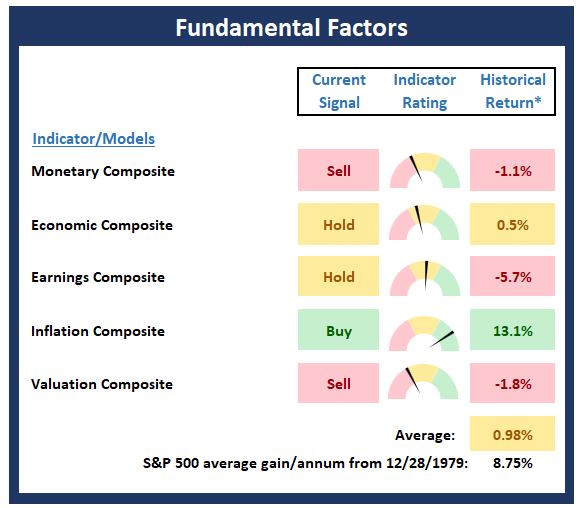
* Source: Ned Davis Research (NDR) as of the date of publication. Historical returns are hypothetical average annual performances calculated by NDR.
Thought for the Day:
When strong winds blow, don't build walls, but rather windmills -Nassim Taleb
Wishing you green screens and all the best for a great day,

David D. Moenning
Founder, Chief Investment Officer
Heritage Capital Research, a Registered Investment Advisor

Disclosures
At the time of publication, Mr. Moenning held long positions in the following securities mentioned: none - Note that positions may change at any time.
NOT INDIVIDUAL INVESTMENT ADVICE. IMPORTANT FURTHER DISCLOSURES