Bulls Are On Their Own
Executive Summary:
From my seat, the primary driving factors behind the stock market action continue to be (a) the state of the economic recovery, (b) the outlook for additional stimulus, and (c) the outlook on the COVID crisis. On the latter subject, the key seems to be the question of when we can return to "normal" in terms of social distancing, mask-wearing, etc. Because, in short, until people can gather indoors without the fear of becoming sick, the economy will not return to where it stood at the beginning of 2020. While hardly breaking news, I believe this continues to be the focal point of the stock market.
From an "Early Warning" standpoint, it looks as if the major indices now find themselves in no-man's land. Stocks are neither oversold nor overbought from a near-term perspective and sentiment doesn't really favor either team. As such, neither team looks like they have an edge here.
The good news on this fine Wednesday morning is the headline that Treasury Secretary Mnuchin says a compromise on stimulus is possible. This has lifted stock prices in the early going on the idea that stimulus will help limit the ultimate damage COVID inflicts on the economy. So, for now, it looks like the bulls have the ball.
Next, let's take a look at our Early Warning board for additional clues about the near-term action...
The State of the "Early Warning" Indicators
The Early Warning board has slipped a bit over the last week. While there wasn't a table-pounding set-up seen at this time a week ago, the board did seem to favor the bulls to a slight degree. This week, the board is more neutral, which suggests that the team currently in possession of the ball is likely to keep it for a while as there isn't a strong case for a mean-reversion move here.
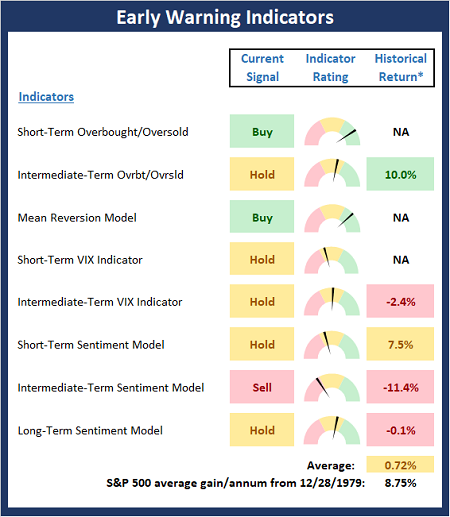
* Source: Ned Davis Research (NDR) as of the date of publication. Historical returns are hypothetical average annual performances calculated by NDR. Past performances do not guarantee future results or profitability - NOT INDIVIDUAL INVESTMENT ADVICE.
Stochastic Review
As you can see on the chart below, the recent buy signal from the stochastics appeared to be well-timed. However, with the stochastics quickly moving up into the neutral zone, the mean-reversion tailwinds have stopped blowing. As such, the bulls are now on their own and will need to generate some momentum if they hope to move prices much higher from here. So, as I mentioned above, from an "early warning" perspective, things are pretty darn neutral here. For me, this means it is time to lean on the trend and momentum indicators until the next "early warning" setup appears.
S&P 500 - Daily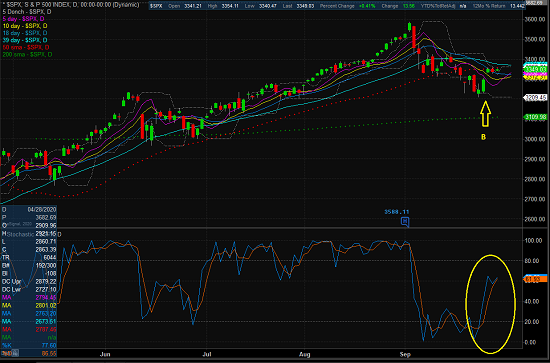
View Large Chart Online
Thought For The Day:
Dream as if you'll live forever, live as if you'll die today. -James Dean
Wishing you green screens and all the best for a great day,

David D. Moenning
Founder, Chief Investment Officer
Heritage Capital Research

Disclosures
At the time of publication, Mr. Moenning held long positions in the following securities mentioned: None - Note that positions may change at any time.
Early Warning Models Explained
Short-Term Overbought/sold Indicator: This indicator is the current reading of the 14,1,3 stochastic oscillator. When the oscillator is above 80 and the %K is above the %D, the indicator gives an overbought reading. Conversely, when the oscillator is below 20 and %K is below its %D, the indicator is oversold.
Intermediate-Term Overbought/sold Indicator: This indicator is a 40-day RSI reading. When above 57.5, the indicator is considered overbought and when below 45 it is oversold.
Mean Reversion Model: This is a diffusion model consisting of five indicators that can produce buy and sell signals based on overbought/sold conditions.
VIX Indicator: This indicator looks at the current reading of the VIX relative to a series of Donchian Channel bands. When the indicator reaches an extreme reading in either direction, it is an indication that a market trend could reverse in the near-term.
Short-Term Sentiment Indicator: This is a model-of-models composed of 18 independent sentiment indicators designed to indicate when market sentiment has reached an extreme from a short-term perspective. Historical analysis indicates that the stock market's best gains come after an environment has become extremely negative from a sentiment standpoint. Conversely, when sentiment becomes extremely positive, market returns have been subpar.
Intermediate-Term Sentiment Indicator: This is a model-of-models composed of 7 independent sentiment indicators designed to indicate when market sentiment has reached an extreme from a intermediate-term perspective. Historical analysis indicates that the stock market's best gains come after an environment has become extremely negative from a sentiment standpoint. Conversely, when sentiment becomes extremely positive, market returns have been subpar.
Long-Term Sentiment Indicator: This is a model-of-models composed of 6 independent sentiment indicators designed to indicate when market sentiment has reached an extreme from a long-term perspective. Historical analysis indicates that the stock market's best gains come after an environment has become extremely negative from a sentiment standpoint. Conversely, when sentiment becomes extremely positive, market returns have been subpar.
NOT INVESTMENT ADVICE. The opinions and forecasts expressed herein are those of Mr. David Moenning and Heritage Capital Research and may not actually come to pass. The opinions and viewpoints regarding the future of the markets should not be construed as recommendations. The analysis and information in this report is for informational purposes only. No part of the material presented in this report is intended as an investment recommendation or investment advice. Neither the information nor any opinion expressed constitutes a solicitation to purchase or sell securities or any investment program.
Any investment decisions must in all cases be made by the reader or by his or her investment adviser. Do NOT ever purchase any security without doing sufficient research. There is no guarantee that the investment objectives outlined will actually come to pass. All opinions expressed herein are subject to change without notice. Neither the editor, employees, nor any of their affiliates shall have any liability for any loss sustained by anyone who has relied on the information provided.
Mr. Moenning of Heritage Capital Research is an investment adviser representative of Eastsound Capital Advisors, LLC, a registered investment advisor. The adviser may not transact business in states where it is not appropriately registered, excluded or exempted from registration. Individualized responses to persons that involve either the effecting of transaction in securities, or the rendering of personalized investment advice for compensation, will not be made without registration or exemption.
Mr. Moenning and Heritage Capital Research may at times have positions in the securities referred to and may make purchases or sales of these securities while publications are in circulation. Positions may change at any time.
The analysis provided is based on both technical and fundamental research and is provided "as is" without warranty of any kind, either expressed or implied. Although the information contained is derived from sources which are believed to be reliable, they cannot be guaranteed.
The author neither endorses nor warrants the content of this site, any embedded advertisement, or any linked resource. The author or his managed funds may hold either long or short positions in the referenced securities. Republication rights must be expressly granted by author in writing.
Investments in equities carry an inherent element of risk including the potential for significant loss of principal. Past performance is not an indication of future results.