Coloring Outside The Lines
Executive Summary:
In last week's technical review, I opined that (a) there were clear lines in the sand on the charts of the major indices, (b) any movement in between those lines could be viewed as "noise," and (c) a break above or below the key support/resistance was the key to the next move. Fast forward three sessions and suddenly the Dow and S&P 500 finds themselves below those respective support zones. Worries over a prolonged economic slog, alarming increases in COVID cases, and the real possibility that the next round of stimulus (something that the Fed has stated it would like to see) may be derailed over the politics of RBG's replacement on SCOTUS have combined to provide the bears with the impetus to color outside the lines. From a technical perspective, this suggests that some additional downside price exploration may be in order. However, if the bulls can find a way to push back on the narrative that the economic recovery is in jeopardy, then buyers may find current levels in some of the big names appealing. As such, the action over the next couple days looks to be important.
The State of the Trend Indicators
As you might expect, the Trend Board has taken a hit over the past week. This suggests to me that the corrective/consolidation phase remains intact and that buyers may want to exercise some caution for a while.
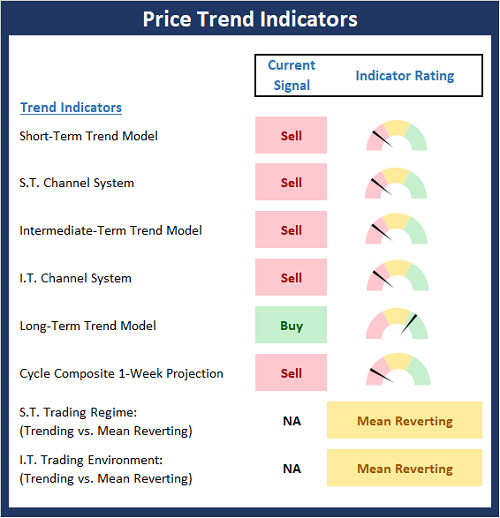
View Trend Indicator Board Online
NOT INDIVIDUAL INVESTMENT ADVICE.
About The Trend Board Indicators: The models/indicators on the Trend Board are designed to determine the overall technical health of the current stock market trend in terms of the short- and intermediate-term time frames.
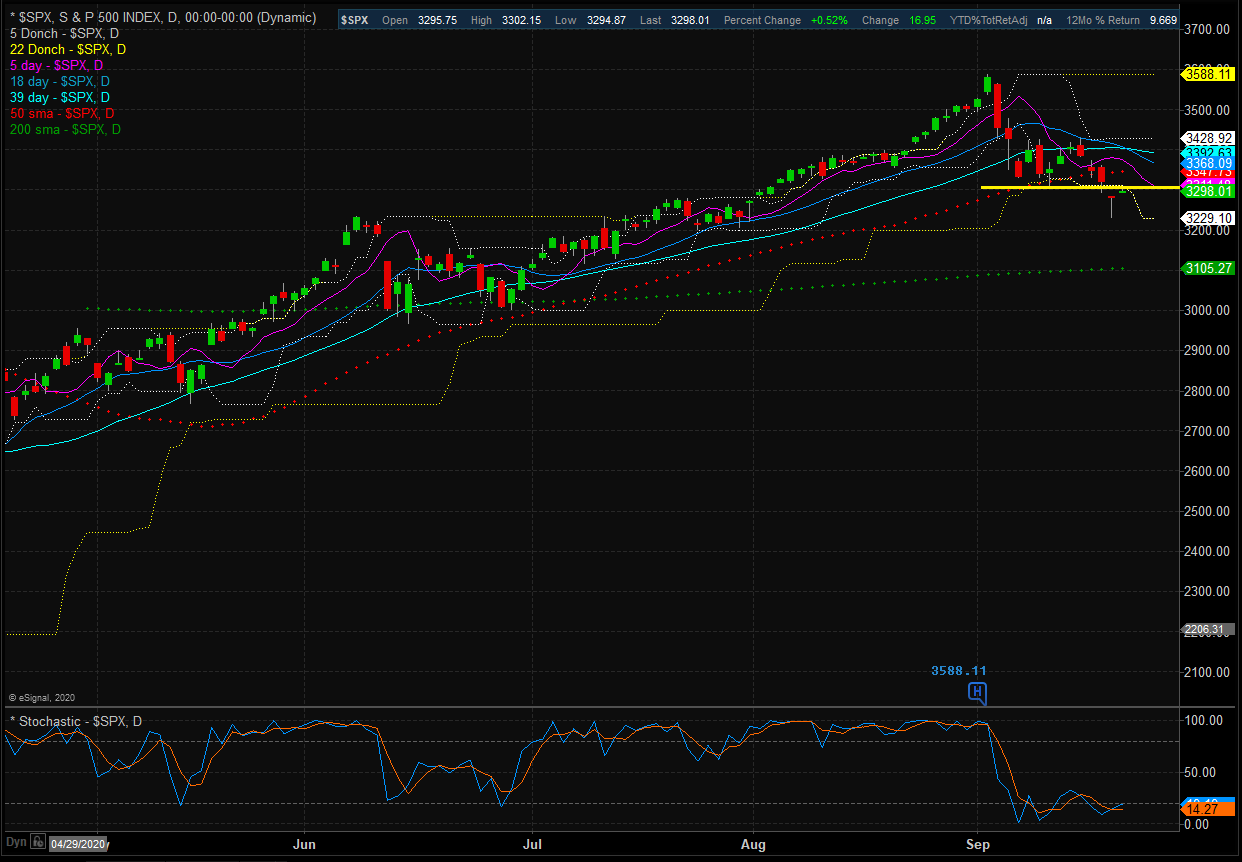
My Take on the State of the Charts...
With the "test" of the recent support zones looking like it failed, one can argue that the S&P 500 has now embarked on a downtrend. From here, I see two possible outcomes. First, the bears become emboldened given the potential for delayed/derailed economic recovery. If this occurs, we will want to watch to see if the indices can put in a "lower low" on a closing chart. Second, the "COVID Winners" trade resumes, supporting the S&P and NASDAQ indices in the process. I figure this would push the major indices back into a trading range until the skies clear. So, as I mentioned above, my feeling is the next few days may provide a decent tell as to what we should expect next.
S&P 500 - Daily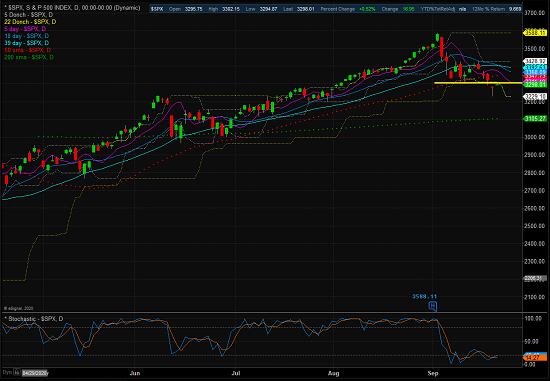
View Larger Chart
Next, let's check in on the state of the market's internal momentum indicators.
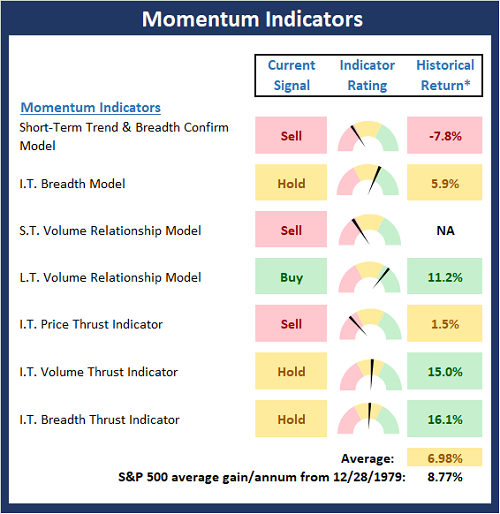
View Momentum Indicator Board Online
* Source: Ned Davis Research (NDR) as of the date of publication. Historical returns are hypothetical average annual performances calculated by NDR. Past performances do not guarantee future results or profitability - NOT INDIVIDUAL INVESTMENT ADVICE.
Like the Trend board, the Momentum board saw some meaningful deterioration over the past week. The good news is the intermediate-term indicators/models are not negative and some of the models that moved into the red did so only marginally. This tells me that so far at least, we are dealing with a correction/pullback/consolidation, and not the beginning of a cyclical bear.
The Bottom Line
From my perch, I continue to see the current action as a corrective move that is effectively "working off" some of the excesses that had built up during July/August. Remember, some of these moves (think TSLA) were, in my words, "ridiculous." As such, a period of consolidation/digestion certainly makes sense. However, we do need to stay alert for the possibility that something in the overall narrative (i.e. trader assumptions) has changed. Stay tuned!
Thought For The Day:
Try sending positive thoughts to someone who could use a lift - you never know, it just might help...
Wishing you green screens and all the best for a great day,

David D. Moenning
Founder, Chief Investment Officer
Heritage Capital Research

Disclosures
At the time of publication, Mr. Moenning held long positions in the following securities mentioned: SPY, QQQ, VTI - Note that positions may change at any time.
Trend Models Explained
Short-Term Trend Model: A series of indicator designed to identify the status of the stock market’s short-term (0-3 weeks) trend. The model compares the current price of S&P 500 relative to 5-day customized smoothing (weighted and moved forward 3 periods), the relationship of the 5-day to the 10-day, and the relationship of 10-day to 39-day.
Short- and Intermediate-Term Channel Breakout Systems: The short-term and intermediate-term Channel Breakout Systems are modified versions of the Donchian Channel indicator. According to Wikipedia, "The Donchian channel is an indicator used in market trading developed by Richard Donchian. It is formed by taking the highest high and the lowest low of the last n periods. The area between the high and the low is the channel for the period chosen."
Intermediate-Term Trend Model: A model designed to identify the status of the stock market’s intermediate-term (3 weeks to 6 months) price trend. The model compares the current weekly price of S&P 500 relative to relative to customized 10-week smoothing (weighted and moved forward 3 periods), the relationship of the 10-week to the 30-week, and the relationship of 30-week to 55-week.
Long-Term Trend Model: An indicator designed to identify the status of the stock market’s longer-term (>6 months) trend. The indicator compares the 50-day smoothing of the S&P 500 relative to its 200-day smoothing. When the 50-day is above 200-day, the indicator is positive and vice versa.
Cycle Composite Projections: The cycle composite combines the 1-year Seasonal, 4-year Presidential, and 10-year Decennial cycles. The indicator reading shown uses the cycle projection for the upcoming week.
Short- and Intermediate-Term Trading Mode Models: These indicators attempt to identify whether the current market action represents a "trending" or "mean reverting" environment. The indicator utilizes the readings of the Efficiency Ratio, the Average Correlation Coefficient, and Trend Strength models.
Momentum Models Explained
Short-Term Trend-and-Breadth Model: History shows the most reliable market moves tend to occur when the breadth indices are in tune with the major market averages. When the breadth measures diverge, investors should take note that a trend reversal may be at hand. This indicator incorporates an All-Cap Dollar Weighted Equity Series and A/D Line. At the time of this writing, when the A/D line has been above its 5-day smoothing and the All-Cap Equal Weighted Equity Series is above its 25-day smoothing, the equity index has gained at a rate of +26.5% per year since 1980. When one of the indicators is above its smoothing, the equity index has gained at a rate of +14.5% per year. And when both are below, the equity index has lost over -20% per year.
Intermediate-Term Breadth Model: A proprietary diffusion index developed by Ned Davis Research. The indicator is designed to determine the technical health of the market’s 157 sub-industry groups (GICS categorizes the market into 11 sectors, 20 industries, and 157 sub-industry groups). Technical health is determined by the direction of each sub-industry’s long-term smoothing and the rate of change of the sub-industry’s price index.
Short- and Long-Term Volume Relationship Models: These models review the relationship between "supply" and "demand" volume over the short- and intermediate-term time frames.
Intermediate-Term Price Thrust Model: This indicator measures the 3-day rate of change of the Value Line Composite relative to the standard deviation of the 30-day average.
Intermediate-Term Volume Thrust Model: This indicator uses NASDAQ volume data to indicate bullish and bearish conditions for the NASDAQ Composite Index. The indicator plots the ratio of the 10-day total of NASDAQ daily advancing volume to the 10-day total of daily declining volume. The indicator supports the case that a rising market supported by heavier volume in the advancing issues tends to be the most bullish condition, while a declining market with downside volume dominating confirms bearish conditions.
Breadth Thrust Model: This indicator uses the number of NASDAQ-listed stocks advancing and declining to indicate bullish or bearish breadth conditions for the NASDAQ Composite. The indicator plots the ratio of the 10-day total of the number of stocks rising on the NASDAQ each day to the 10-day total of the number of stocks declining each day. Using 10-day totals smooths the random daily fluctuations and gives indications on an intermediate-term basis. Historically, the NASDAQ Composite has performed much better when the 10-day A/D ratio is high (strong breadth) and worse when the indicator is in its lower mode (weak breadth). The most bullish conditions for the NASDAQ when the 10-day A/D indicator is not only high, but has recently posted an extreme high reading and thus indicated a thrust of upside momentum. Bearish conditions are confirmed when the indicator is low and has recently signaled a downside breadth thrust.
NOT INVESTMENT ADVICE. The opinions and forecasts expressed herein are those of Mr. David Moenning and Heritage Capital Research and may not actually come to pass. The opinions and viewpoints regarding the future of the markets should not be construed as recommendations. The analysis and information in this report is for informational purposes only. No part of the material presented in this report is intended as an investment recommendation or investment advice. Neither the information nor any opinion expressed constitutes a solicitation to purchase or sell securities or any investment program.
Any investment decisions must in all cases be made by the reader or by his or her investment adviser. Do NOT ever purchase any security without doing sufficient research. There is no guarantee that the investment objectives outlined will actually come to pass. All opinions expressed herein are subject to change without notice. Neither the editor, employees, nor any of their affiliates shall have any liability for any loss sustained by anyone who has relied on the information provided.
Mr. Moenning of Heritage Capital Research is an investment adviser representative of Eastsound Capital Advisors, LLC, a registered investment advisor. The adviser may not transact business in states where it is not appropriately registered, excluded or exempted from registration. Individualized responses to persons that involve either the effecting of transaction in securities, or the rendering of personalized investment advice for compensation, will not be made without registration or exemption.
Mr. Moenning and Heritage Capital Research may at times have positions in the securities referred to and may make purchases or sales of these securities while publications are in circulation. Positions may change at any time.
The analysis provided is based on both technical and fundamental research and is provided "as is" without warranty of any kind, either expressed or implied. Although the information contained is derived from sources which are believed to be reliable, they cannot be guaranteed.
The author neither endorses nor warrants the content of this site, any embedded advertisement, or any linked resource. The author or his managed funds may hold either long or short positions in the referenced securities. Republication rights must be expressly granted by author in writing.
Investments in equities carry an inherent element of risk including the potential for significant loss of principal. Past performance is not an indication of future results.