Drivers and Models Remain Constructive

The State of the Market
I'm on the road, so I'll be keeping my thoughts on the market brief for the next two weeks. From my seat, the key drivers to the current upward trend in the stock market include the expectations for the economy to "boom" in the coming quarters, consumer spending, the anticipated infrastructure bill (which is expected to increase spending for many years), the absolute level of interest rates, Mr. Powell's pledge to stay "friendly" as long as it takes for the economy to reach full employment (and to let inflation "run hot" for awhile, if necessary), and the ongoing vaccination campaign.
On that note, it is encouraging that according to the WSJ, over 50% of the US adult population has now been vaccinated with at least one dose and more than 25% of the population is fully vaccinated. As such, a fair amount of Americans are looking ahead to better days and a return to at least some form of "normalcy." I bring this up because the more hopeful feeling is likely to unleash a large amount of pent up demand for all kinds of spending. Which, of course, is a positive from an economic standpoint.
Speaking of economic positives, a few items were noteworthy last week. First, retail sales came in with an eye-popping gain +9.8%, which was approximately 50% higher than consensus expectations. Along those lines, JPM CEO Jamie Dimon remarked that consumers have more than $2 Trillion more in their checking accounts than they did prior to the pandemic. And finally, China's official GDP reading soared by 18.3%. To which, I say "wow" on all fronts.
And lest we forget, the earnings parade has begun in earnest and FactSet reports that 84% of companies reporting have exceeded estimates so far. However, the real key to this earnings season is what's called "forward guidance." So, if you are so inclined, pay attention to what corporate CEO's have to say about their expectations for the coming quarters in terms of both profits and hiring. Analysts will also be listening intently for any mentions of supply chain issues and what they are doing about rising prices.
Finally, it is encouraging to see the market's advance broadening out this year versus last year's megacap tech dominance. However, it is important to note that things are getting a bit frothy as stocks are overbought, signs of speculation are rising, and sentiment readings are approaching extreme levels. And since this is often a two-steps-forward and one-step-back type of game, we shouldn't be surprised to seem some sort of pullback or a pause in the action in the near-term.
Here's hoping you have a great week. Now let's turn to our weekly model update...
The Big-Picture Market Models
We start with six of our favorite long-term market models. These models are designed to help determine the "state" of the overall market.
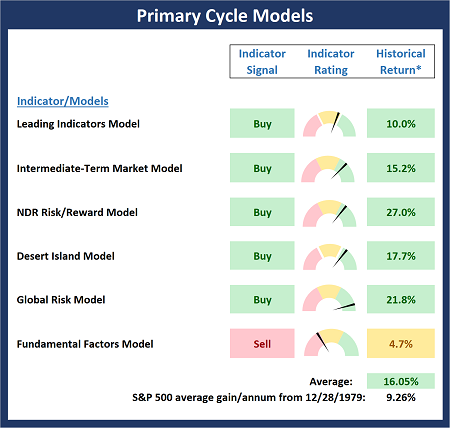
* Source: Ned Davis Research (NDR) as of the date of publication. Historical returns are hypothetical average annual performances calculated by NDR.
The Fundamental Backdrop
Next, we review the market's fundamental factors including interest rates, the economy, earnings, inflation, and valuations.
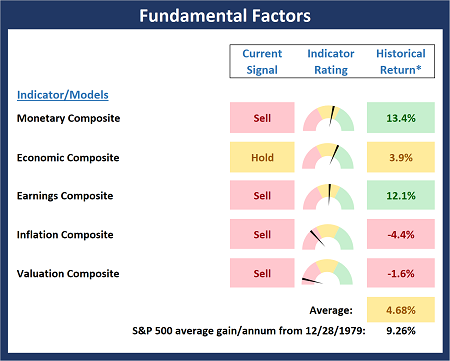
* Source: Ned Davis Research (NDR) as of the date of publication. Historical returns are hypothetical average annual performances calculated by NDR.
The State of the Trend
After reviewing the big-picture models and the fundamental backdrop, I like to look at the state of the current trend. This board of indicators is designed to tell us about the overall technical health of the market's trend.
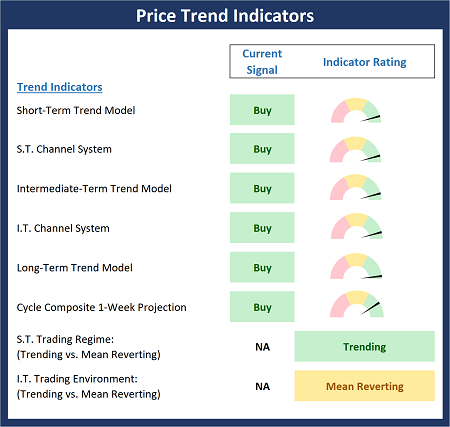
The State of Internal Momentum
Next, we analyze the momentum indicators/models to determine if there is any "oomph" behind the current move.
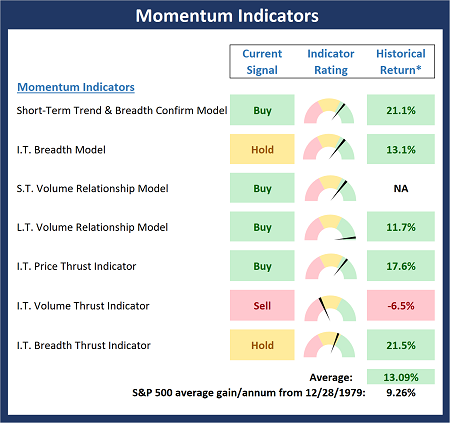
* Source: Ned Davis Research (NDR) as of the date of publication. Historical returns are hypothetical average annual performances calculated by NDR.
Early Warning Signals
Finally, we look at our early warning indicators to gauge the potential for counter-trend moves. This batch of indicators is designed to suggest when the table is set for the trend to "go the other way."
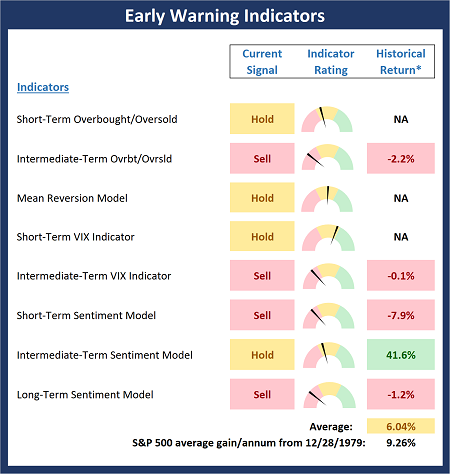
* Source: Ned Davis Research (NDR) as of the date of publication. Historical returns are hypothetical average annual performances calculated by NDR.
Thought for the Day:
Trust but verify. -Ronald Reagan
Wishing you green screens and all the best for a great day,

David D. Moenning
Founder, Chief Investment Officer
Heritage Capital Research, a Registered Investment Advisor
Disclosures
At the time of publication, Mr. Moenning held long positions in the following securities mentioned: None - Note that positions may change at any time.
NOT INDIVIDUAL INVESTMENT ADVICE. IMPORTANT FURTHER DISCLOSURES

