Everyone Is Singing The Same Song

Good morning and welcome to the first day of a brand-new year. If you are like most folks in this game, you are likely relishing the idea of being done with the nightmare that was 2022 and are ready to hit the reset button.
From my seat, the question of the day is how traders are planning to position themselves for the start of the 2023 campaign. Oftentimes, the first few days of a new calendar year acts like a light switch. Whatever the focus had been at the end of the previous year is quickly forgotten and something brand new comes to the fore, in a hurry.
While I'm not sure if there will be a big change in the focus to start this year, I will note that the outlook provided by so many Wall Street analysts for the coming year is rarely so one-sided. In short, just about everybody on the planet is singing the same song right now.
The refrain goes something like this. The economy is slowing (well, the manufacturing sector, anyway). The Fed refuses to back away from their aggressive stance (I.E. Powell & Co., as well as many other global central bankers, continue to talk tough). Inflation remains too high. And as such, the Fed is about to make a "policy error" by going too far, which, history shows they almost always do. This will, as we're told, most certainly push the economy into recession.
Further, the negative Nancy's of the street contend that the market has not yet discounted such an event. As such, earnings estimates are too high and MUST come down - substantially. Joy.
We're also told that, according to history, the market has NEVER bottomed BEFORE a recession begins. Therefore, the market is likely to head lower, because, after all, the economy is NOT in recession at the present time - and doesn't appear to be heading into one any time soon. So, again, there is only one way for stocks to go... down.
While I do believe the most important thing for the market outlook at the present time is the question of recession, I have to admit that I get VERY nervous when everybody in the game is looking for the same thing - at the same time.
Lest we forget, stocks - particularly those previously loved high growth names that were all the rage post COVID - have taken a beating for a year. So, my question is, how much is enough? Hasn't the massive declines seen in every manager's former faves discounted a fair amount of negativity already?
Sure, I get the idea that higher rates mean lower multiples for high growth names. But my key point on this first trading day of 2023 is, the consumer is doing just fine, thank you. And since the service sector (which, of course, is driven by John Q Public and his family), continues to hum along, everyone may be "expecting" something (a recession) that may not actually occur.
And while I reserve the right to be wrong and I recognize that sometimes an expectation that becomes too popular can also become a self-fulfilling prophecy, I'd like to offer up an alternative thought here.
Call me crazy, but if the economy doesn't go into recession and the Fed doesn't go too far, shouldn't we be looking ahead to better days at some point?
I know, I know. Everyone agrees here. Everything is terrible. There is no way out. The image in the crystal ball is clear and stocks must go lower.
My question is, do they though? We shall see. Here's wishing everyone a great first week of 2023!
Now let's review the "state of the market" through the lens of our market models...
Primary Cycle Models
Below is a group of big-picture market models, each of which is designed to identify the primary trend of the overall "state of the stock market."
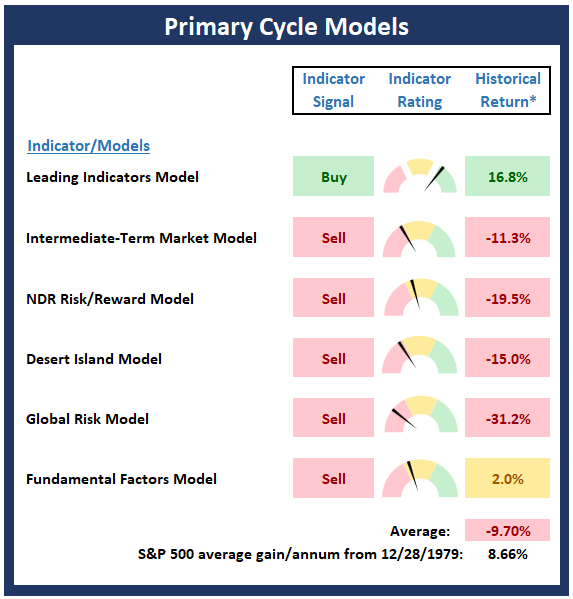
* Source: Ned Davis Research (NDR) as of the date of publication. Historical returns are hypothetical average annual performances calculated by NDR.
Trend Analysis:
Below are the ratings of key price trend indicators. This board of indicators is designed to tell us about the overall technical health of the market's trend.
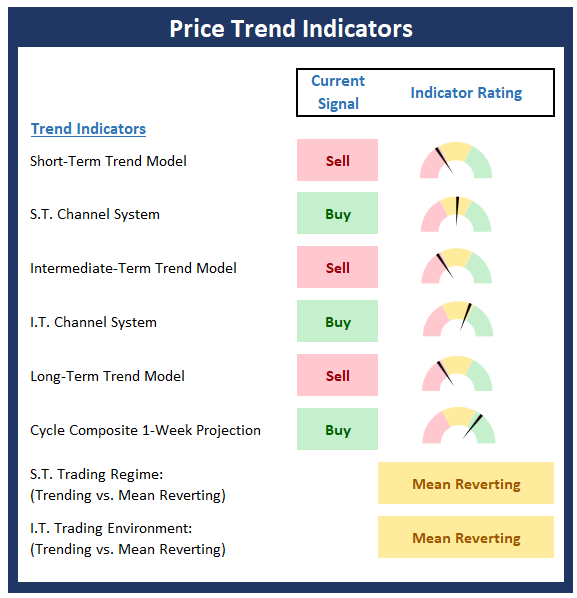
Key Price Levels
- S&P 500 Near-Term Support Zone: 3765
- S&P 500 Near-Term Resistance Zone: 3900
- S&P 500 50-day Simple MA: 3898
- MA Direction: Rising
- S&P 500 200-day Simple MA: 4008
- MA Direction: Declining
Market Momentum Indicators
Below is a summary of key internal momentum indicators, which help determine if there is any "oomph" behind a move in the market.
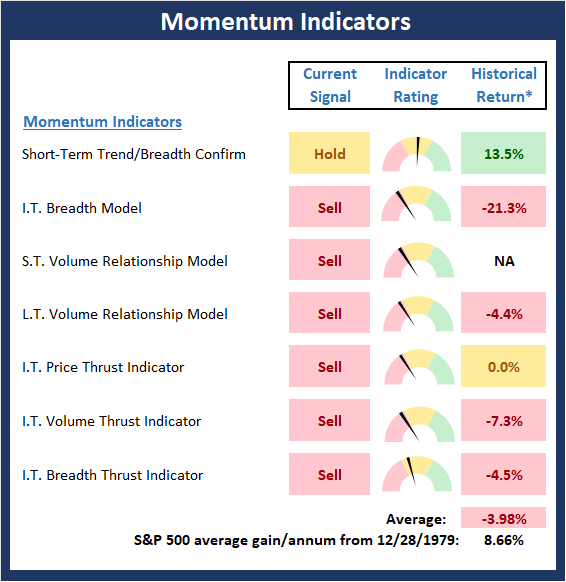
* Source: Ned Davis Research (NDR) as of the date of publication. Historical returns are hypothetical average annual performances calculated by NDR.
Early Warning Indicators
Below is a summary of key early warning indicators, which are designed to suggest when the market may be ripe for a reversal on a short-term basis.
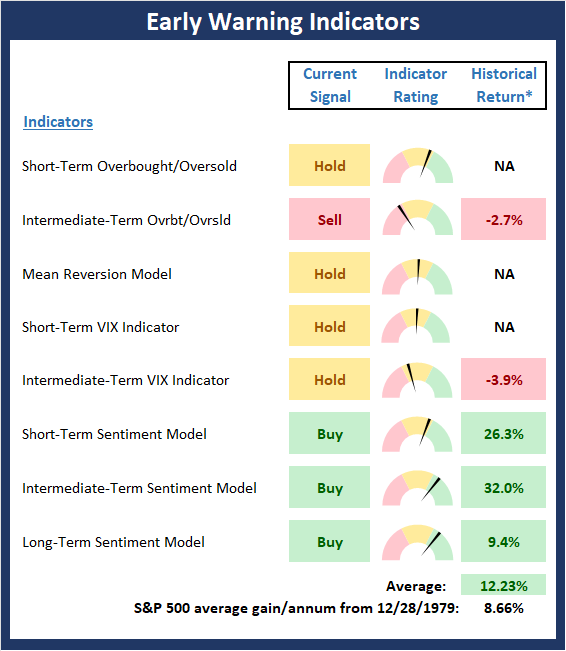
* Source: Ned Davis Research (NDR) as of the date of publication. Historical returns are hypothetical average annual performances calculated by NDR.
Fundamental Factor Indicators
Below is a summary of key external factors that have been known to drive stock prices on a long-term basis.
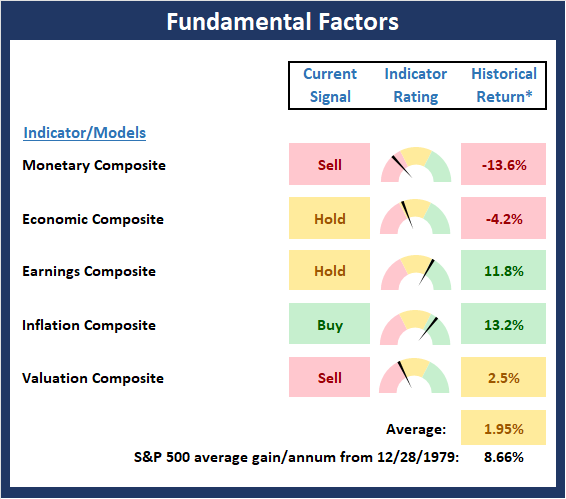
* Source: Ned Davis Research (NDR) as of the date of publication. Historical returns are hypothetical average annual performances calculated by NDR.
Thought for the Day:
True knowledge exists in knowing that you know nothing. -Socrates
Wishing you green screens and all the best for a great day,

David D. Moenning
Founder, Chief Investment Officer
Heritage Capital Research, a Registered Investment Advisor

Disclosures
At the time of publication, Mr. Moenning held long positions in the following securities mentioned: None - Note that positions may change at any time.
NOT INDIVIDUAL INVESTMENT ADVICE. IMPORTANT FURTHER DISCLOSURES