False Summit

In last week's missive, I asked the question, what else can go wrong? The basic point was that, according to the bull camp, perhaps all the bad news was out and that stocks had already priced in all the bad stuff. Extrapolating on the idea, our Heroes in Horns were arguing that maybe, just maybe, stocks should begin to look ahead to brighter days.
To a time when the Fed might pause their war on inflation. To a time when Russia would stand down. To a time when supply chain issues were in the rearview mirror. To a time when inflation numbers weren't at fresh 40-year highs every month. And to a time when the economy was on the upswing.
However, Friday's CPI report provided an answer to my question - in rather dramatic fashion. In short, with the release of one number, the bulls' hopes were crushed.
Yep, that's right, one glance at that CPI print and traders changed their tune. Suddenly, the narrative was higher inflation for longer. And increased worries about the economy. And fears about the state of the consumer. And a more aggressive Fed. So, at 6:31 am mountain daylight time, I had my answer. Cutting to the chase, apparently there's plenty that can still go wrong.
In case you were on the golf course and left your phone in the car, July's CPI was hotter - as in, much hotter - than expected. Instead of report showing that "peak inflation" was on the horizon and that the Fed could start "thinking about, thinking about" pausing, the bulls got a baseball bat to the head.
And then, a couple hours later, we got word that June's University of Michigan's Consumer Sentiment Index had fallen out of bed, hitting an all-time - yes, that's right, an ALL-TIME - low. For you numbers geeks, the index reading came in at 50.2, which was a statistical mile from the consensus estimate of 58.2 and May's 58.4. It was the fifth decline in the last six months and represented a drop of -41.3% from the reading a year ago. Yowza.
Digging into the report, the Current Conditions component plunged from 63.3 in May to 55.4 - also the worst reading on record. And the Expectations Index tanked to 46.8 from 55.2. But take heart dear reader, because this numbers was only the worst since 1975.
What is the cause for the "super bad feeling" consumers are sporting these days, you ask? Yep, you guessed it, inflation. As in gas prices. And food prices. And the costs of hotel rooms. And airline tickets. And, well, just about everything.
To put it succinctly, this is why stocks are plumbing new lows as I type. Because the hope that existed at this time last week has been replaced with fear and loathing.
It's like when you are hiking a "fourteener" (a mountain with a peak higher than 14,000 feet) and based on what you see ahead, you believe the summit is close. It's right there - right in front of you - you can see it. You are tired. Your feet hurt. Your back aches. And thoughts of, "Whose idea was this, anyway?" cross your mind. But alas, after hiking straight uphill for hours, the summit is in sight! You've made it - and the worst is behind you. Yay!
But when you crest that last rise and you expect the rocky trail to finally come to an end, your heart suddenly sinks. It turns out that peak you saw was just a "false summit." Oh, and there's at least another 500 vertical feet to go. This is where you want to cry. You want to give up. You question whether you can go on.
This is what I thought of on Friday - and am thinking about again on this fine summer Monday morning. The CPI report was the hiker's worst nightmare - a false summit. That idea of peak inflation, peak Fed hawkishness, and maybe the nadir in the current bear market? Gone.
Now, investors are faced with another hill to climb. And like the tired hiker, we must trudge forward. Step by step. It won't be easy. It will take time. And your will is going to be tested. But, if you stick to it, you will make it.
The good news is you've got plenty of water, clear skies, and lunch to look forward to at the actual summit (and a couple energy bars still in the pack for the way back home). For stock market investors, this equates to having some cash on hand that you can deploy into the emotional abyss. It means that you can "lose less" when things get bad, which, I'm reminded is a good thing.
Now let's review the "state of the market" through the lens of our market models...
The Big-Picture Market Models
We start with six of our favorite long-term market models. These models are designed to help determine the "state" of the overall market.
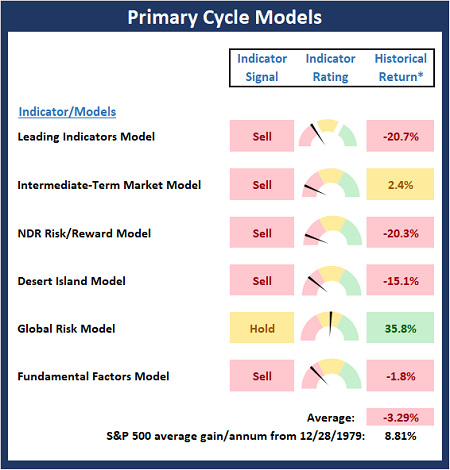
* Source: Ned Davis Research (NDR) as of the date of publication. Historical returns are hypothetical average annual performances calculated by NDR.
The Fundamental Backdrop
Next, we review the market's fundamental factors including interest rates, the economy, earnings, inflation, and valuations.
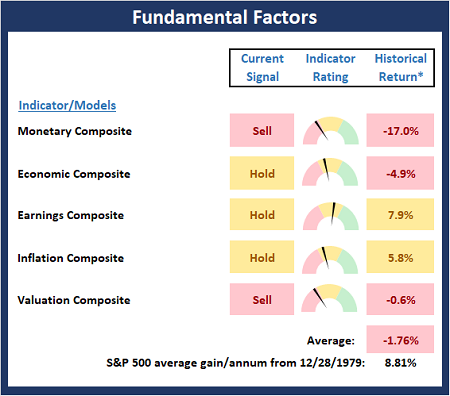
* Source: Ned Davis Research (NDR) as of the date of publication. Historical returns are hypothetical average annual performances calculated by NDR.
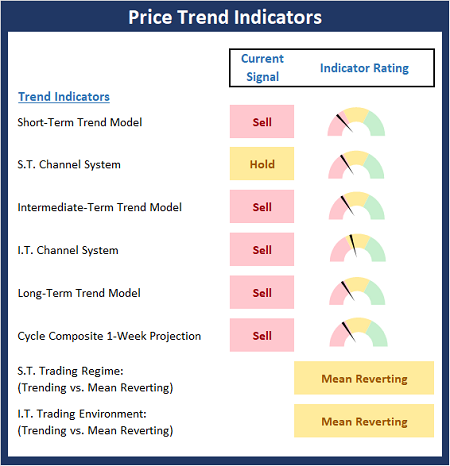
The State of the Trend
After reviewing the big-picture models and the fundamental backdrop, I like to look at the state of the current trend. This board of indicators is designed to tell us about the overall technical health of the market's trend.
The State of Internal Momentum
Next, we analyze the momentum indicators/models to determine if there is any "oomph" behind the current move.
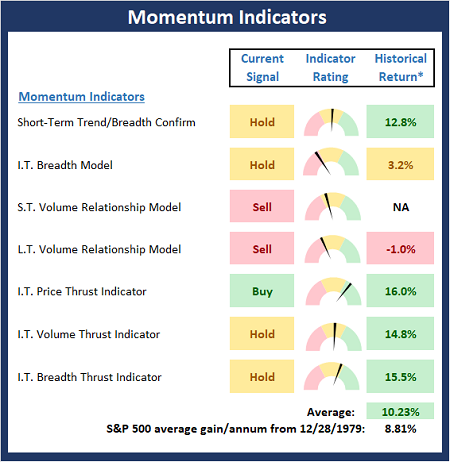
* Source: Ned Davis Research (NDR) as of the date of publication. Historical returns are hypothetical average annual performances calculated by NDR.
Early Warning Indicators
Finally, we look at our early warning indicators to gauge the potential for countertrend moves. This batch of indicators is designed to suggest when the table is set for the trend to "go the other way."
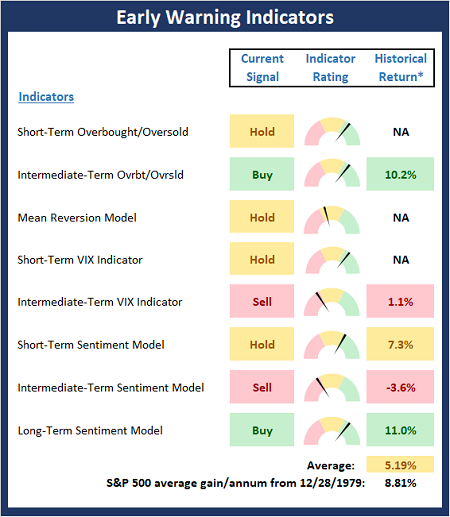
* Source: Ned Davis Research (NDR) as of the date of publication. Historical returns are hypothetical average annual performances calculated by NDR.
Thought for the Day:
As you walk down the fairway of life you must smell the roses, for you only get to play one round. -Ben Hogan
Wishing you green screens and all the best for a great day,

David D. Moenning
Founder, Chief Investment Officer
Heritage Capital Research, a Registered Investment Advisor

Disclosures
At the time of publication, Mr. Moenning held long positions in the following securities mentioned: None - Note that positions may change at any time.
NOT INDIVIDUAL INVESTMENT ADVICE. IMPORTANT FURTHER DISCLOSURES