Fundamentals Continue To Favor The Bulls
Good Morning. If it's Friday, it's time to review our longer-term market fundamentals models and indicators.
Our Review Process: Once we have identified the state of the big-picture environment (Market Model Mondays), the current trend and the degree of momentum behind the move (Technical Tuesdays), the potential for a countertrend move to develop (Early Warning Wednesdays), and my subjective review of what is behind the current market action (Thesis Thursdays), we close out the week by checking in on the state of the market's fundamental factors.
The State of the Fundamental Backdrop
Each week we review the market's fundamental factors in the areas of interest rates, the economy, inflation, and valuations.
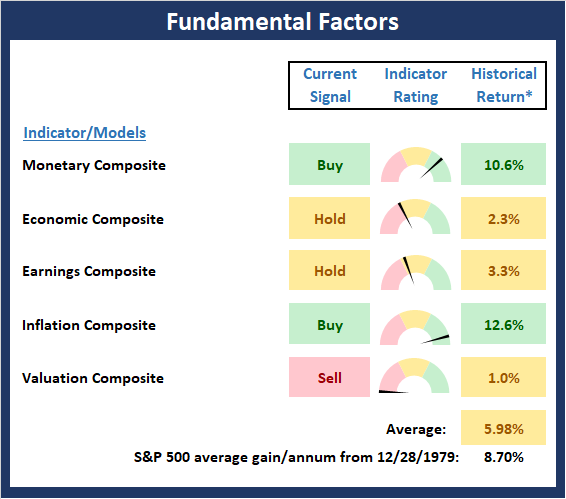
* Source: Ned Davis Research (NDR) as of the date of publication. Historical returns are hypothetical average annual performances calculated by NDR. Past performances do not guarantee future results or profitability - NOT INDIVIDUAL INVESTMENT ADVICE.
View Fundamental Indicator Board Online
My Take...
There are no changes to the Fundamental Factors board to report this week. I continue to take the readings from the economic and earnings composite with a rather large grain of salt. First, it is important to recognize that most of the indicators on this board are long-term oriented and as such, slow moving. As such, the economic indicators couldn't pick up the self-induced recession. And now will be slow to signal the recovery from the re-opening. A similar situation can be seen within our earnings models.
The good news from the board is that monetary conditions (interest rates and Fed policy) remain favorable and there is no inflation in sight. These two conditions alone are enough to create a positive backdrop for stocks.
Finally, the bad news is stock market valuations are high. However, this is a very normal occurrence in post-recession environments.
When taken together, I continue to believe the fundamentals favor the bulls and that dips should be bought.
Thought For The Day:
"If you don't make mistakes, you can't make decisions. You can't dwell on them." --Warren Buffett
Wishing you green screens and all the best for a great day,

David D. Moenning
Founder, Chief Investment Officer
Heritage Capital Research

Disclosures
At the time of publication, Mr. Moenning held long positions in the following securities mentioned: None - Note that positions may change at any time.
Fundamental Models Explained
Monetary Composite: The popular cliche, "Don't fight the Fed" is really a testament to the profound impact that interest rates and Fed policy have on the market. It is a proven fact that monetary conditions are one of the most powerful influences on the direction of stock prices. The Monetary Composite is a combination of two proprietary monetary models developed by Ned Davis Research. The first is comprised of 14 indicators and is plotted as a composite and the second is made up of eight monetary-related indicators including money supply, and the bond and commodities markets.
Economic Composite: During the middle of bull and bear markets, understanding the overall health of the economy and how it impacts the stock market is one of the few truly logical aspects of the stock market. The economic composite is a series of three models designed to indicate the current state of the economy.
Earnings Composite: A series of four models designed to indicate the overall health of corporate earnings. The first model is based on the slope of the smoothed S&P 500 earnings per share. The second model looks at the drivers of earnings and includes indicators such as U.S. industrial production, the CRB Spot Raw Industrial Material Price Index, the Treasury yield curve, Institute for Supply Management (ISM) indices, corporate bond credit spreads, unemployment claims, and the trend in analyst earnings estimate revisions for the S&P 500. The third model is designed to indicate the likely trend in the earnings per share reported for the S&P 500 Index. This model uses a variety of macro variables to indicate whether current conditions are favorable for strong, moderate, or weak growth in S&P 500 earnings. The fourth model the median 12-month percent change in the one-year analyst forecast out of the 500 components of the index.
Inflation Model: From an historical perspective, one of the best "big picture" indicators of what the market is expected to do next is inflation. The Inflation model is designed to identify cyclical changes in the rate of inflation. The model consists of 22 individual indicators primarily measuring various rates of change of such indicators as commodity prices, the Consumer Price Index (CPI), producer prices, and industrial production.
Valuation Composite: If you want to get analysts really riled up, you need only to begin a discussion of market valuation. While the question of whether stocks are overvalued or undervalued appears to be a simple one, the subject is actually extremely complex. The Valuation composite consists of five valuation indicators/models developed by Ned Davis Research. The first valuation indicator reviews the S&P 500 Price-to-Earnings GAAP Ratio relative to normal, expensive, and bargain valuation zones. The second model measures the S&P 500’s Median P/E ratio, representing the median P/E of the 500 stocks in the index. The third model measures the Median P/E ratio of a multi-cap stock index. The fourth indicator is the P/E ratio of the Value Line Index. The fifth model is a composite of 7 indicators designed to reflect stock market valuations based on how various valuation indicators compare to their latest 10-year historical ranges.
NOT INVESTMENT ADVICE. The opinions and forecasts expressed herein are those of Mr. David Moenning and Heritage Capital Research and may not actually come to pass. The opinions and viewpoints regarding the future of the markets should not be construed as recommendations. The analysis and information in this report is for informational purposes only. No part of the material presented in this report is intended as an investment recommendation or investment advice. Neither the information nor any opinion expressed constitutes a solicitation to purchase or sell securities or any investment program.
Any investment decisions must in all cases be made by the reader or by his or her investment adviser. Do NOT ever purchase any security without doing sufficient research. There is no guarantee that the investment objectives outlined will actually come to pass. All opinions expressed herein are subject to change without notice. Neither the editor, employees, nor any of their affiliates shall have any liability for any loss sustained by anyone who has relied on the information provided.
Mr. Moenning of Heritage Capital Research is an investment adviser representative of Eastsound Capital Advisors, LLC, a registered investment advisor. The adviser may not transact business in states where it is not appropriately registered, excluded or exempted from registration. Individualized responses to persons that involve either the effecting of transaction in securities, or the rendering of personalized investment advice for compensation, will not be made without registration or exemption.
Mr. Moenning and Heritage Capital Research may at times have positions in the securities referred to and may make purchases or sales of these securities while publications are in circulation. Positions may change at any time.
The analysis provided is based on both technical and fundamental research and is provided "as is" without warranty of any kind, either expressed or implied. Although the information contained is derived from sources which are believed to be reliable, they cannot be guaranteed.
The author neither endorses nor warrants the content of this site, any embedded advertisement, or any linked resource. The author or his managed funds may hold either long or short positions in the referenced securities. Republication rights must be expressly granted by author in writing.
Investments in equities carry an inherent element of risk including the potential for significant loss of principal. Past performance is not an indication of future results.