GDP Getting Real
A great many folks, including a host of analysts and financial professionals, seem to believe that the US is currently in recession. They point to last week's negative GDP print as Exhibit A in their argument, suggesting that two consecutive negative quarters is the very definition of recession.
As we've discussed here a time or two already, two negative quarters of GDP growth is definitely NOT the definition of recession. No, the secretive panel of economists at NBER (National Bureau of Economic Research) are the ones who determine the state of the economic cycle. According to NBER, the definition of recession is "a significant decline in economic activity spread across the market, lasting more than a few months, normally visible in real GDP, real income, employment, industrial production, and wholesale-retail sales."
So, you have to ask yourself, with GDP coming in a -1.6% in Q1 and -0.9% in Q2 (so far, there are two more revisions yet to come), does this represent "a significant decline in economic activity?"
Frankly, I can see how some may answer yes here. Neither number is a rounding error. These are meaningfully negative numbers.
But, but, but... It is critically important to recognize that the headline GDP print is "Real GDP," which, by definition, includes adjustments for... wait for it... inflation.
In the GDP report there are actually two rates of growth provided, "real" and "nominal." Meaning, in simple terms, with and without inflation. And the difference between these two numbers really tells the story here.
You see, in the first quarter, Nominal GDP, which is the actual growth in the economy without any adjustments for inflation, came in at an annualized rate of +6.6%. Then in Q2, which is where lots of folks contend a recession was underway, the nominal growth rate of the economy was reported at +7.3%.
I think we can all agree that these are robust growth rates for the US. So, no, the economy was not experiencing a significant decline in economic activity. The problem is that the rate of inflation was HIGHER than the nominal growth rate. And THIS is how the "REAL GDP" rate wound up in negative territory.
The good news is that some of the components of the inflation calculations have indeed pulled back of late. And because of this, the Atlanta Fed's GDPNow model currently stands at +2.1% for Q3. As you will recall, this model did a pretty good job of warning us that Q2's GDP was going to be negative.
The point is that it is inflation that is causing the negative GDP prints, not a big decline in economic activity. And since some of the components of inflation are likely to indeed be transitory in the coming months, then it is easy to see why we are not in recession.
From my seat, this is a small part of why stocks have been rallying lately as the "peak inflation" and, in turn, "peak Fed hawkishness" themes allow investors to start looking ahead. Ahead to days when inflation isn't constantly compared to the runaway days of the early 80's. To days when the Fed can pull back and take a less aggressive path.
Another part of the recent rally is the idea that many of the market's biggest names appear to be doing just fine, thank you. Unless you've been at the beach every day, you likely know that Microsoft (MSFT), Google parent Alphabet (GOOGL), Amazon.com (AMZN), and a little company called Apple (AAPL) continue to print money during this difficult period.
Sure, there have also been misses and disappointments. But the "generals" continue to march ahead - even in the face of inflation's worst surge in forty years.
As such, the thinking in the bull camp seems to be that the end of the Fed's aggressive rate hiking cycle is somewhere out there on the horizon and that the economy and, in turn, corporate profits, aren't going to crash and burn. As such, the thinking is that maybe, just maybe, we've seen the worst.
Put simply, the bulls argue that no recession improves the chances that we've seen the lows in the stock market decline. Remember, bear market declines that are not accompanied by a recession average in the low 20's (whereas bears that are accompanied by recession tend to produce declines in the mid 30's). And with this bear's low being -23.55% on the S&P 500, it is easy to see why the market had a more optimistic feel to it last week.
Does this mean it will be up, up, and away from here? Uh, no. My guess is it will take a fair amount of time for investors to become convinced that (a) inflation can be tamed and (b) that the economy's "landing" won't require fire trucks and emergency vehicles. Thus, I for one am looking for stocks to experience a classic bottoming phase for the coming months.
Of course, there is another side to the market's argument here. So, let's remember that the risk to the glass-is-half-full view is that inflation stays sticky and hot, and the Fed has to stay aggressive for longer than expected. Then as a result, the economy may indeed experience a "significant decline in activity." We shall see. But for now, traders appear to be looking ahead.
Now let's review the "state of the market" through the lens of our market models...
The Big-Picture Market Models
We start with six of our favorite long-term market models. These models are designed to help determine the "state" of the overall market.
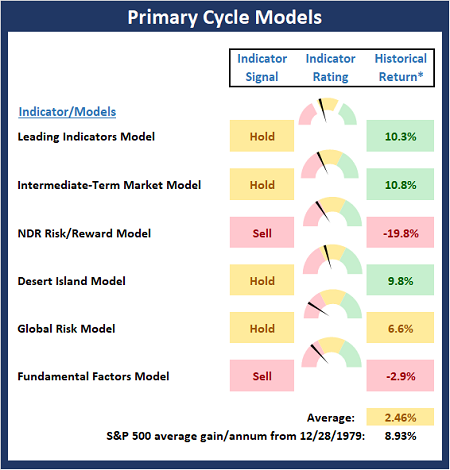
* Source: Ned Davis Research (NDR) as of the date of publication. Historical returns are hypothetical average annual performances calculated by NDR.
The Fundamental Backdrop
Next, we review the market's fundamental factors including interest rates, the economy, earnings, inflation, and valuations.
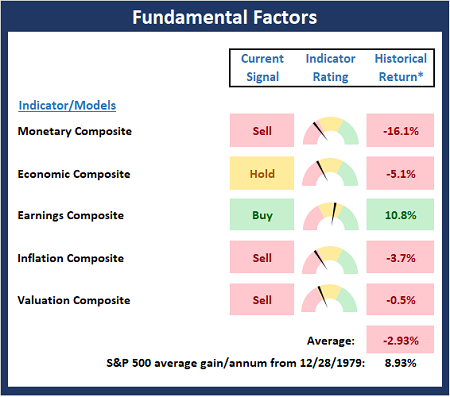
* Source: Ned Davis Research (NDR) as of the date of publication. Historical returns are hypothetical average annual performances calculated by NDR.
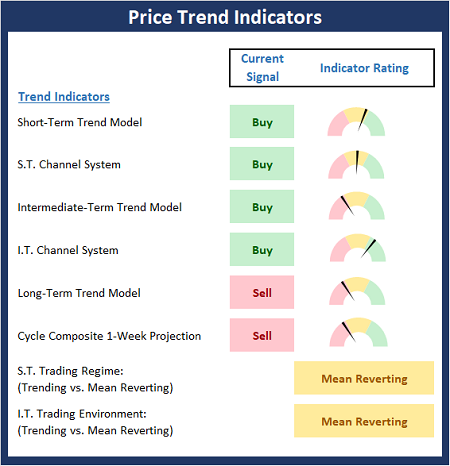
The State of the Trend
After reviewing the big-picture models and the fundamental backdrop, I like to look at the state of the current trend. This board of indicators is designed to tell us about the overall technical health of the market's trend.
The State of Internal Momentum
Next, we analyze the momentum indicators/models to determine if there is any "oomph" behind the current move.
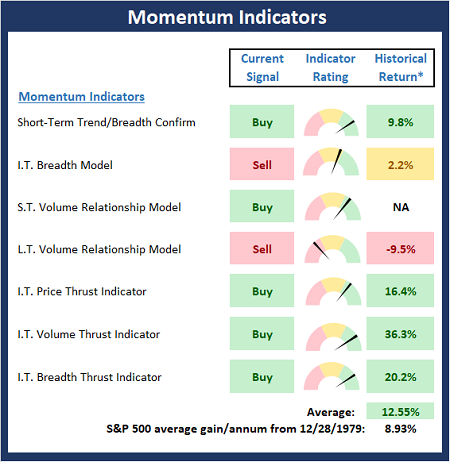
* Source: Ned Davis Research (NDR) as of the date of publication. Historical returns are hypothetical average annual performances calculated by NDR.
Early Warning Indicators
Finally, we look at our early warning indicators to gauge the potential for countertrend moves. This batch of indicators is designed to suggest when the table is set for the trend to "go the other way."
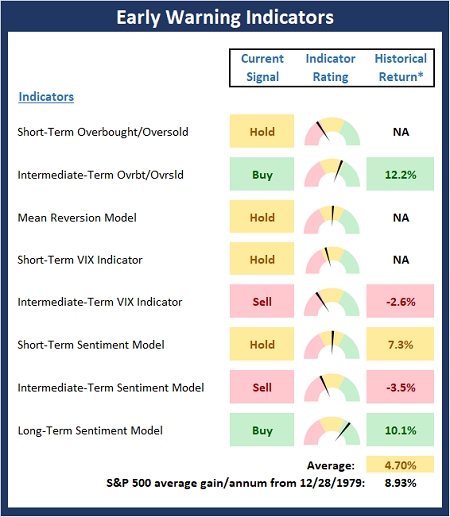
* Source: Ned Davis Research (NDR) as of the date of publication. Historical returns are hypothetical average annual performances calculated by NDR.
Thought for the Day:
Make the present good, and the past will take care of itself. -Knute Rockne
Wishing you green screens and all the best for a great day,

David D. Moenning
Founder, Chief Investment Officer
Heritage Capital Research, a Registered Investment Advisor

Disclosures
At the time of publication, Mr. Moenning held long positions in the following securities mentioned: MSFT, AMZN, GOOGL, AAPL - Note that positions may change at any time.
NOT INDIVIDUAL INVESTMENT ADVICE. IMPORTANT FURTHER DISCLOSURES