Hard To Argue With Bulls Here
Executive Summary:
From my seat, the state of the market depends largely on the time frame lens one is viewing the market through. Looking at the action from a shorter-term perspective, volatility remains high due likely to the uncertainty over the fate of additional stimulus and the election. Shorter-term, the market appears to want more stimulus and an uncontested election. On that note, it will be interesting to see if the elevated volatility levels can recede once the election is out of the way.
From a longer-term perspective, things are in pretty good shape. The economy is growing - albeit at a significantly slower pace than pre-COVID. Rates are exceptionally low. The Fed is in a very friendly mode. Inflation is low. The calendar has historically favored stocks for the next several months. And corporate earnings are moving in the right direction again. The only fly in the ointment is the extremely high valuation levels. As I've opined in the past, this condition isn't out of the ordinary when the economy emerges from a recession. Yet at the same time, there can be no denying that valuations are higher than normal this time around. All in, my stance hasn't changed, and I believe the bulls continue to deserve the benefit of any doubt here.
The Big-Picture Market Models
There are no signal changes on the Primary Cycle board this week. However, I think it is worth noting that the historical returns have improved a fair amount (17.1% vs. 11.8%) over that past two weeks as the readings on the Leading Indicators, Intermediate-Term Market, Risk/Reward, and Global Risk models have all increased since the last report. Given the state of the Primary Cycle board, it would be very hard for me not to side with the bull camp at this time.
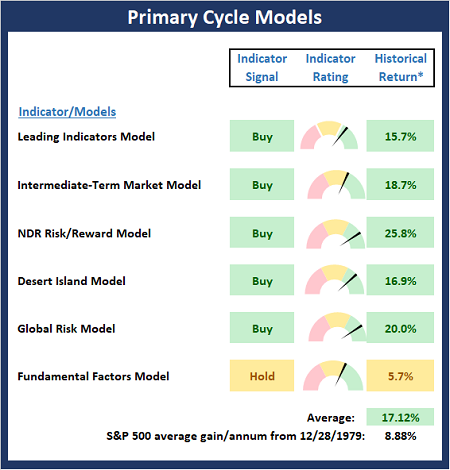
* Source: Ned Davis Research (NDR) as of the date of publication. Historical returns are hypothetical average annual performances calculated by NDR. Past performances do not guarantee future results or profitability - NOT INDIVIDUAL INVESTMENT ADVICE.
Checking On The "Primary" Cycles
While I don't often make portfolio adjustments based on the long-term trends in the stock market (aka the "primary cycles"), I have found over the years that checking in on state of the cycles and the weekly/monthly charts helps to keep the big-picture in perspective.
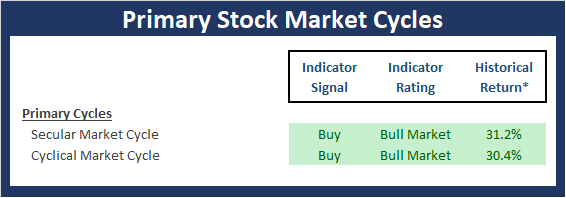
* Source: Ned Davis Research (NDR) as of the date of publication. Historical returns are hypothetical average annual performances calculated by NDR. Past performances do not guarantee future results or profitability - NOT INDIVIDUAL INVESTMENT ADVICE.
The Secular Market Cycle
Definition: A secular bull market is a period in which stock prices rise at an above-average rate for an extended period (think 5 years or longer) and suffer only relatively short intervening declines. A secular bear market is an extended period of flat or declining stock prices. Secular bull or bear markets typically consist of multiple cyclical bull and bear markets. Below is a monthly chart of the S&P 500 Index illustrating the current cycle, which we estimate began on March 9, 2009.
S&P 500 - Monthly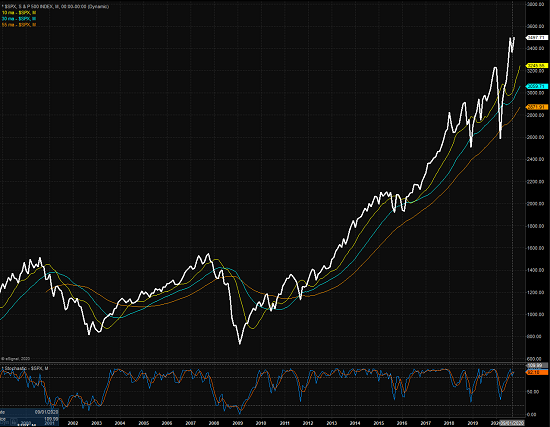
View Larger Chart Online
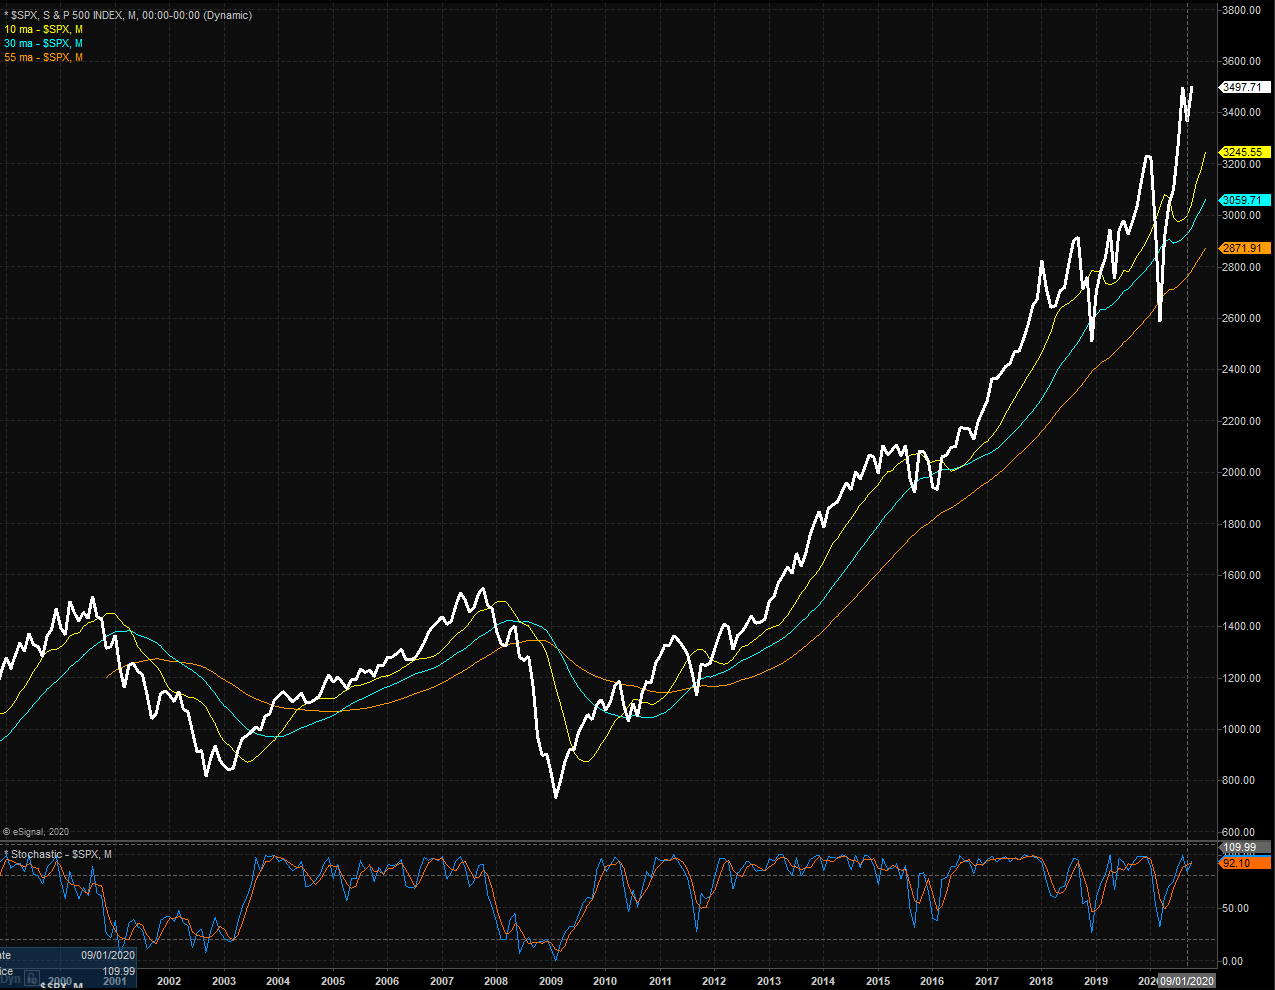
The Cyclical Market Cycle
Definition: A cyclical bull market requires a 30% rise in the DJIA after 50 calendar days or a 13% rise after 155 calendar days. Reversals of 30% in the Value Line Geometric Index since 1965 also qualify. A cyclical bear market requires a 30% drop in the DJIA after 50 calendar days or a 13% decline after 145 calendar days. Reversals of 30% in the Value Line Geometric Index also qualify. Below is a weekly chart of the S&P 500 illustrating the current cycle, which we estimate began on March 24, 2020.
S&P 500 - Weekly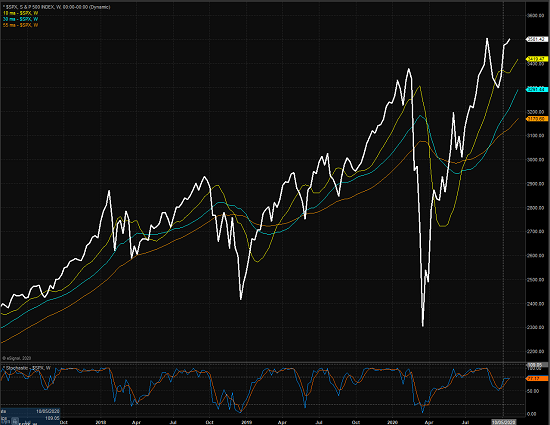
View Larger Chart Online
Thought For The Day:
It is never too late to be what you might have been. -George Eliot
Wishing you green screens and all the best for a great day,

David D. Moenning
Founder, Chief Investment Officer
Heritage Capital Research

Disclosures
At the time of publication, Mr. Moenning held long positions in the following securities mentioned: None - Note that positions may change at any time.
Primary Market Models Explained
Leading Indicators Model: A group of indicators that have historically shown tendencies to lead the market at major turning points.
Intermediate-Term Market Model: A composite model-of-models focused on trend and momentum indicators which has been designed to provide identify intermediate-term trading opportunities. The model includes 38 independent indicators covering price trends, volume, breadth, momentum, historical cycles, sentiment, and mean reversion.
Risk/Reward Model: A model-of-models designed to provide an overall view of the state of the risk/reward environment. The model includes tape, monetary, and sentiment indicators as well as 7 big-picture market model readings.
Desert Island Model: If I was stranded on a desert island with access to only one market model to manage money with, this would be the model. The model is a comprehensive model-of-models comprised of trend, momentum, mean reversion, economic, monetary, sentiment, and factor-based indicators/models.
Global Risk Model: A series of indicators designed to gauge the relative risk tolerance of the global investment environment.
Fundamental Factors Model: A model-of-models designed to provide a reading on the "macro state" of the environment. The model is comprised of indicators/models in the areas of monetary conditions, the economy, corporate earnings, inflation, and stock market valuation.
NOT INVESTMENT ADVICE. The opinions and forecasts expressed herein are those of Mr. David Moenning and Heritage Capital Research and may not actually come to pass. The opinions and viewpoints regarding the future of the markets should not be construed as recommendations. The analysis and information in this report is for informational purposes only. No part of the material presented in this report is intended as an investment recommendation or investment advice. Neither the information nor any opinion expressed constitutes a solicitation to purchase or sell securities or any investment program.
Any investment decisions must in all cases be made by the reader or by his or her investment adviser. Do NOT ever purchase any security without doing sufficient research. There is no guarantee that the investment objectives outlined will actually come to pass. All opinions expressed herein are subject to change without notice. Neither the editor, employees, nor any of their affiliates shall have any liability for any loss sustained by anyone who has relied on the information provided.
Mr. Moenning of Heritage Capital Research is an investment adviser representative of Eastsound Capital Advisors, LLC, a registered investment advisor. The adviser may not transact business in states where it is not appropriately registered, excluded or exempted from registration. Individualized responses to persons that involve either the effecting of transaction in securities, or the rendering of personalized investment advice for compensation, will not be made without registration or exemption.
Mr. Moenning and Heritage Capital Research may at times have positions in the securities referred to and may make purchases or sales of these securities while publications are in circulation. Positions may change at any time.
The analysis provided is based on both technical and fundamental research and is provided "as is" without warranty of any kind, either expressed or implied. Although the information contained is derived from sources which are believed to be reliable, they cannot be guaranteed.
The author neither endorses nor warrants the content of this site, any embedded advertisement, or any linked resource. The author or his managed funds may hold either long or short positions in the referenced securities. Republication rights must be expressly granted by author in writing.
Investments in equities carry an inherent element of risk including the potential for significant loss of principal. Past performance is not an indication of future results.