Higher, Sooner
One need look no further than the bond market to understand the current correction happening in the major stock indices. As is often the case, traders appeared to flip the switch the moment the calendar turned to 2022. Gone is the steady march higher based on earnings expectations. Gone is the upbeat view of GDP growth for the new year. And gone is the thinking that Omicron might not have much of an economic impact. Instead, traders now appear to be focused on higher rates.
The yield on the 10-year ended 2021 at 1.512%. It trades this morning at nearly 1.8%. This represents an increase of almost 20% - in just a little over five trading sessions. It is also worth noting that the move in the 10-year has broken out to a new cycle high. Something that many traders see as the start of a trend, not the end.
Although one can argue that some of the swift decline in bond prices is due to technical positioning and liquidity issues, the major driver here looks to be the realization that the Fed has changed its tune - almost completely. A few months back, Jay Powell went to painstaking lengths to explain why he and his merry band of U.S. central bankers believed the recent surge in inflation was likely to be transitory. As such, most bond market players expected rates to stay "lower for longer."
However, given Powell's recent and very public U-Turn on the subject, and then the rather hawkish takeaway from the December FOMC minutes, "lower for longer" appears to have morphed into "higher, sooner." As in, market participants now expect the Fed to hike rates higher and sooner than had been expected.
Remember, the investing game is about expectations. And when expectations suddenly change, prices tend to adjust accordingly. Oftentimes in a very swift and violent fashion. And from my perch, this is what we are seeing in the stock market right now. A very fast adjustment to the idea that rates are going to be higher than had been expected and that the move will happen sooner than had been priced in.
The problem for stocks, especially those high-flying growth stocks, is higher rates make future earnings less attractive and current earnings more attractive. For example, a company that will earn $100 per share in the next twelve months is more appealing to traders right now than the company with groundbreaking technology that expects to earn $100 per share over the next 10 years. Thus, another violent rotation out of growth and into value looks to be occurring.
The question, of course, is how long said rotation will last. Obviously, nobody knows. But it is comforting to know that we have seen this movie before. And what we learned is that if/when economic growth begins to slow, investors tend to move back to those areas viewed as "dependable growth."
It is also worth noting that the value areas including banks, industrials, and energy companies do not have limitless upside. You can only sell so many tractors. And if the economy slows, it follows that the upside in energy might not be sky-high either.
My point is that while the current rotation and/or this morning's "risk off" move appear to be justified given the Fed's new stance, I think we have to keep the rate move in perspective with the overall macro picture. And to be sure, rates are only one part of the big picture.
For example, another issue to be reckoned with is the impact that higher rates, Omicron, and inflation may have on the economy. The problem right now is this trio of issues is creating some uncertainty about the future. And we all know how Ms. Market hates uncertainty!
From a near-term perspective, it looks like some additional downside price exploration may be in order. Yet we should keep in mind that stocks are becoming oversold and sentiment is falling like a stone. As such, we should probably expect the bulls to try and make a stand sometime this week. Whether they will be successful or not remains to be seen.
But for now, it looks like "higher, sooner" is the theme of the day and is something that markets will need to digest.
Now let's review the "state of the market" through the lens of our market models...
The Big-Picture Market Models
We start with six of our favorite long-term market models. These models are designed to help determine the "state" of the overall market.
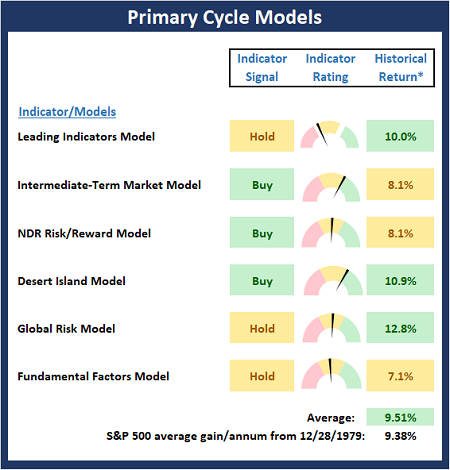
* Source: Ned Davis Research (NDR) as of the date of publication. Historical returns are hypothetical average annual performances calculated by NDR.
Current Take: Big Picture Models
There is no change to the Primary Cycle Board to report this week. So, with no red on the board, my take is to take the current market consternation in stride and continue to lean bullish.
The Fundamental Backdrop
Next, we review the market's fundamental factors including interest rates, the economy, earnings, inflation, and valuations.
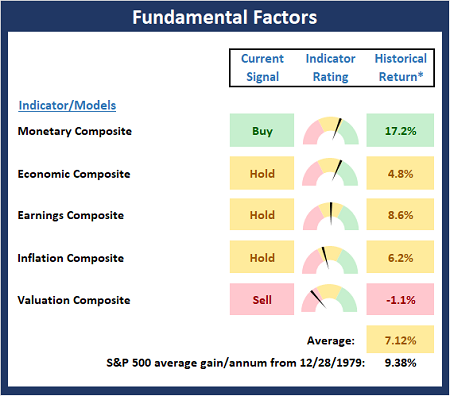
* Source: Ned Davis Research (NDR) as of the date of publication. Historical returns are hypothetical average annual performances calculated by NDR.
Current Take: Fundamental Models
There are also no changes to the Fundamental Board this week. To be sure, one can argue that several of the fundamental inputs are currently in question. However, the takeaway from the Fundamental and Primary Cycle boards is that it's a bull market until proven otherwise. As such, a "buy the dip" approach remains warranted at this time.
The State of the Trend
After reviewing the big-picture models and the fundamental backdrop, I like to look at the state of the current trend. This board of indicators is designed to tell us about the overall technical health of the market's trend.
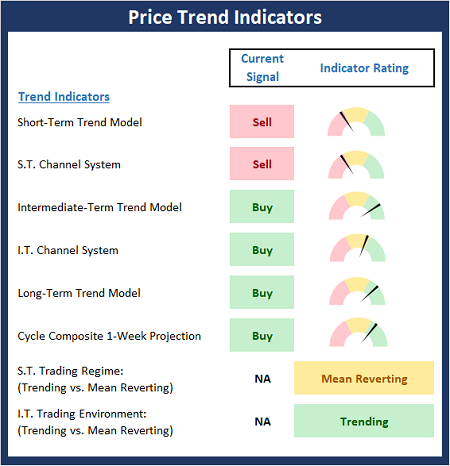
Current Take: Trend Models
The Trend Board pulled back last week as some of the shorter-term indicators flipped to negative. The good news is at this stage, the damage has not crept into the intermediate-term indicators yet. But this remains something to watch closely going forward.
The State of Internal Momentum
Next, we analyze the momentum indicators/models to determine if there is any "oomph" behind the current move.
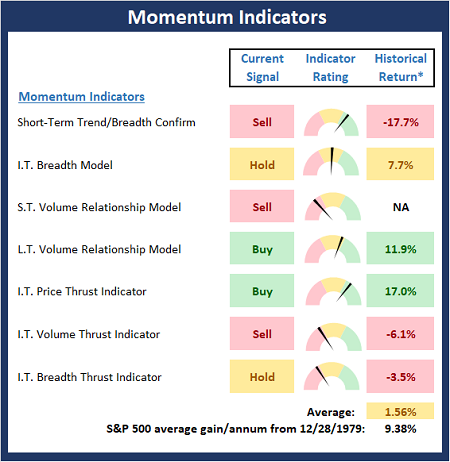
* Source: Ned Davis Research (NDR) as of the date of publication. Historical returns are hypothetical average annual performances calculated by NDR.
Current Take: Momentum Models
The Momentum Board continues to sport a fair amount of technical damage and should be viewed as moderately negative here. From a purely technical perspective, this suggests that there may some additional downside exploration ahead.
Early Warning Indicators
Finally, we look at our early warning indicators to gauge the potential for countertrend moves. This batch of indicators is designed to suggest when the table is set for the trend to "go the other way."
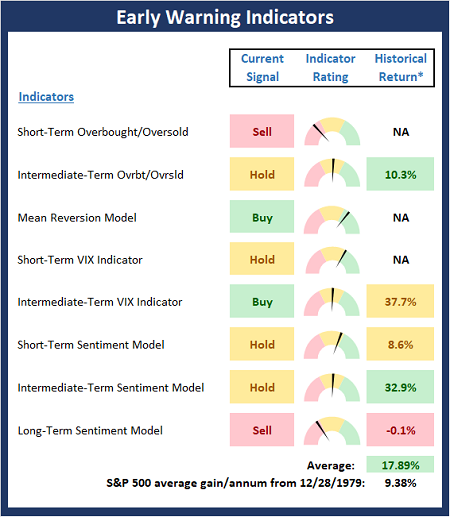
* Source: Ned Davis Research (NDR) as of the date of publication. Historical returns are hypothetical average annual performances calculated by NDR.
Current Take: Early Warning Models
Although stocks appear to be in a corrective mode so far in 2022, the Early Warning Board has yet to suggest that an opportunity to "go the other way" is near. Thus, some caution remains warranted here until sentiment becomes more dour and prices become more oversold.
Thought for the Day:
Unless you change direction, you are likely to arrive at where you are headed. -Chinese Proverb
Wishing you green screens and all the best for a great day,

David D. Moenning
Founder, Chief Investment Officer
Heritage Capital Research, a Registered Investment Advisor

Disclosures
At the time of publication, Mr. Moenning held long positions in the following securities mentioned: None - Note that positions may change at any time.
NOT INDIVIDUAL INVESTMENT ADVICE. IMPORTANT FURTHER DISCLOSURES