Historical Cycles Disagree With Wall Street

In last week's meandering market missive, I opined that analysts of all shapes and sizes were pretty much singing the same song right now regarding the outlook for the economy, inflation, corporate earnings, and in turn, the stock market.
To review, I wrote... The refrain goes something like this. The economy is slowing. The Fed refuses to back away from their aggressive stance (I.E. Powell & Co., as well as many other global central bankers, continue to talk tough). Inflation remains too high. And as such, the Fed is about to make a "policy error" by going too far, which, history shows they almost always do. This will, as we're told, most certainly push the economy into recession.
Further, the negative Nancy's of the street contend that the market has not yet discounted such an event. As such, earnings estimates are too high and MUST come down - substantially. Joy.
And in looking at the various forecasts Wall Street analysts feel compelled to provide for the stock market each year, the song remains the same. In short, a lot of analysts believe that stocks will fall in the first half of the year and will then rally in the back half. Once the Fed relents, of course.
There are any number of reasons and/or historical analogs provided to support this view. Frankly, the evidence is tough to argue with as the situation looks clear. And everyone agrees.
Whether you agree or disagree with the narrative that stocks must go lower doesn't really matter. It is important to recognize that there are times in this game when the prophecies offered up become self-fulfilling. So, with everybody sporting their bear hats at the present time, one of my biggest concerns is that traders will simply stick to the script and keep selling at every turn.
Now For The Good News
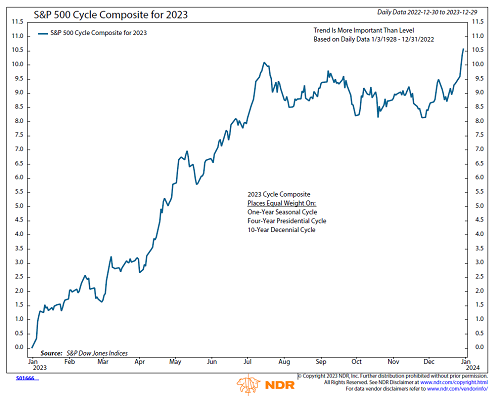
Long-time readers know that I like to check in with something called the Cycle Composite from time to time to see how stocks are acting relative to their historical trends.
As a reminder, the Cycle Composite was developed and maintained by the good folks at Ned Davis Research Group. They take the price action from all the 1-year seasonal, 4-year Presidential, and 10-year decennial cycles from 1900 and throw them into the computer. The cycles are then mashed up to create a projection for what a calendar year might look like.
Although I don't believe in making predictions, I admit that the action in the stock market oftentimes rhymes beautifully with its historical tendencies. And yet, there are also times when stocks go their own way due to the inputs du jour, rendering the Cycle Composite's projection almost useless.
But as I've said a time or twenty over the years, when stocks are in sync with the historical cycles, the projection provided can be good. As in, scary good.
So, imagine my surprise when I pulled up the new Cycle Composite projection for 2023 shown below.
View Chart Online
Image Source: Ned Davis Research Group
Interesting, eh? Instead of confirming the consensus view that stocks have nowhere to go but down, the historical cycles suggest that investors should hop onboard the bull train - and fast. Instead of moving down on fears of how the Fed is going to wreck the economy, the cycles are pointing up and to the right from now through mid-summer. And then higher still into the fourth quarter. Hmmm...
While I do NOT manage money based on projections, views, gut hunches, or even phases of the moon, I found this to be a bit of an eye-opener - and I wanted to share.
So, will this year's stock market adventure become the self-fulling prophecy professed by the majority of analysts or something completely different?
Will stocks start declining again on the idea that the economy and earnings are in trouble? Or head higher as the much feared and overly predicted recession fails to materialize?
As you might have guessed, I have no answers here. But the fact that history suggest a completely different outcome that what is expected by the masses right now is certainly food for thought.
Now let's review the "state of the market" through the lens of our market models...
Primary Cycle Models
Below is a group of big-picture market models, each of which is designed to identify the primary trend of the overall "state of the stock market."
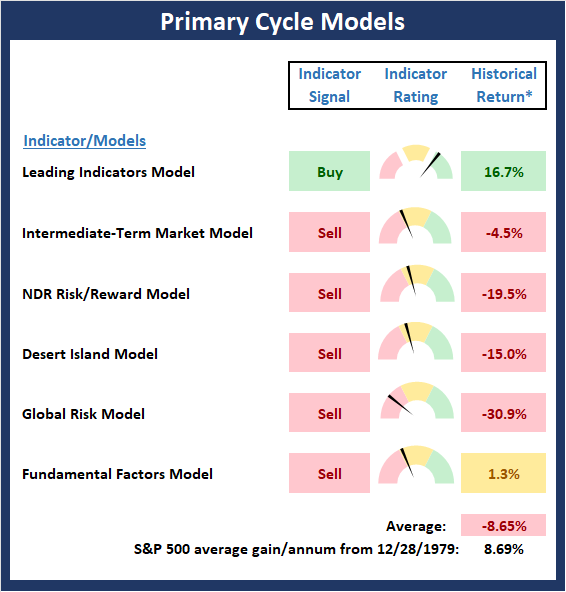
* Source: Ned Davis Research (NDR) as of the date of publication. Historical returns are hypothetical average annual performances calculated by NDR.
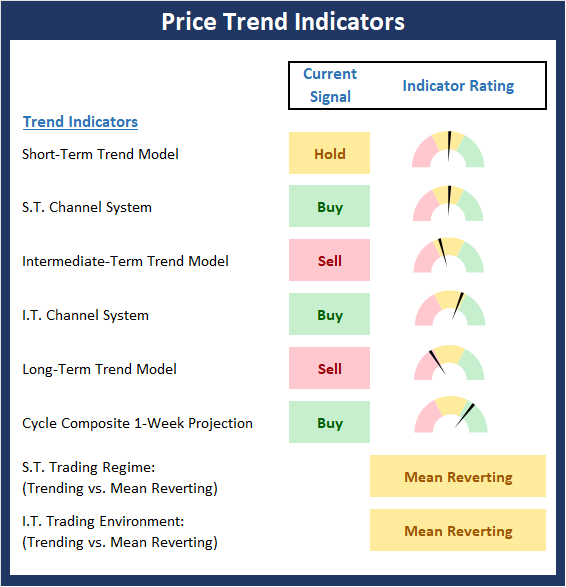
Trend Analysis:
Below are the ratings of key price trend indicators. This board of indicators is designed to tell us about the overall technical health of the market's trend.
Key Price Levels
- S&P 500 Near-Term Support Zone: 3765
- S&P 500 Near-Term Resistance Zone: 3904
- S&P 500 50-day Simple MA: 3904
- MA Direction: Flat
- S&P 500 200-day Simple MA: 3996
- MA Direction: Declining
Market Momentum Indicators
Below is a summary of key internal momentum indicators, which help determine if there is any "oomph" behind a move in the market.
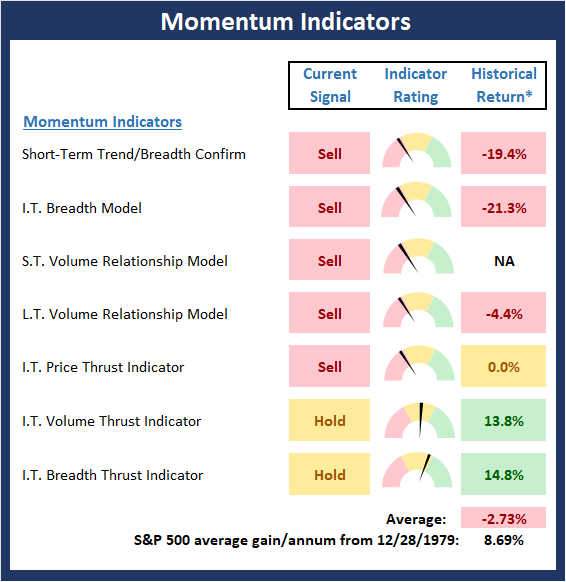
* Source: Ned Davis Research (NDR) as of the date of publication. Historical returns are hypothetical average annual performances calculated by NDR.
Early Warning Indicators
Below is a summary of key early warning indicators, which are designed to suggest when the market may be ripe for a reversal on a short-term basis.
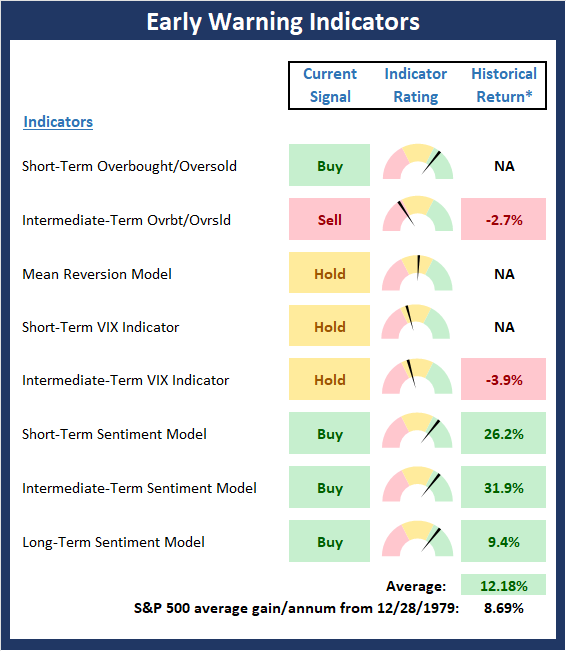
* Source: Ned Davis Research (NDR) as of the date of publication. Historical returns are hypothetical average annual performances calculated by NDR.
Fundamental Factor Indicators
Below is a summary of key external factors that have been known to drive stock prices on a long-term basis.
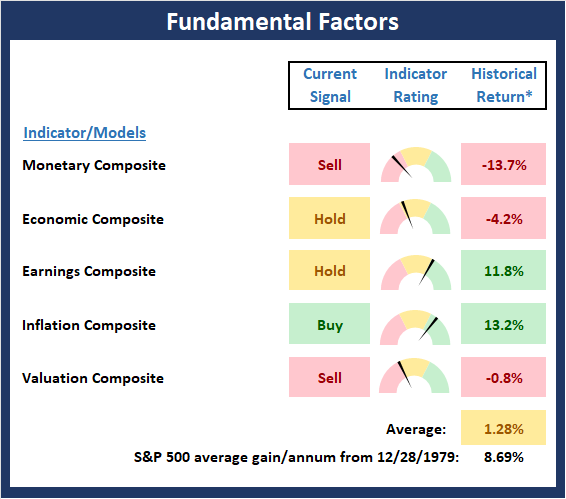
* Source: Ned Davis Research (NDR) as of the date of publication. Historical returns are hypothetical average annual performances calculated by NDR.
Thought for the Day:
Never forget that the first rule of life, medicine (and money management) is to do no harm...
Wishing you green screens and all the best for a great day,

David D. Moenning
Founder, Chief Investment Officer
Heritage Capital Research, a Registered Investment Advisor

Disclosures
At the time of publication, Mr. Moenning held long positions in the following securities mentioned: None - Note that positions may change at any time.
NOT INDIVIDUAL INVESTMENT ADVICE. IMPORTANT FURTHER DISCLOSURES